Search results
361 results found.
361 results found.
COVID-19’s cataclysmic impact on K–12 education, coming on the heels of a decade of stagnation in schools, has yielded a lost generation of growth for adolescents, new federal data reveal.
Wednesday’s publication of scores from the National Assessment of Educational Progress (NAEP) — America’s most prominent benchmark of learning, typically referred to as the Nation’s Report Card — shows the average 13-year-old’s understanding of math plummeting back to levels last seen in the 1990s; struggling readers scored lower than they did in 1971, when the test was first administered. Gaps in performance between children of different backgrounds, already huge during the Bush and Obama presidencies, have stretched to still-greater magnitudes.
The bad tidings are, in a sense, predictable: Beginning in 2022, successive updates from NAEPhave laid bare the consequences of prolonged school closures and spottily delivered virtual instruction. Only last month, disappointing resultson the exam’s history and civics component led to a fresh round of headlines about the pandemic’s ugly hangover.
But the latest release, highlighting “long-term trends” that extend back to the 1970s, widens the aperture on the nation’s profound academic slump. In doing so, it serves as a complement to the 2020 iteration of the same test, which showed that the math and English skills of 13-year-olds had noticeably eroded even before the emergence of COVID-19.
Seems like huge spending increases during COVID didn't help.
— Robin Vos (@repvos) June 21, 2023
We need to hold students & teachers accountable and not let the rampant social promotion in K-12 schools continue. https://t.co/krIJY1DgzV
“Well, it’s kind of too bad that we’ve got the smartest people at our universities, and yet we have to create a law to tell them how to teach.”
The data clearly indicate that being able to read is not a requirement for graduation at (Madison) East, especially if you are black or Hispanic”
My Question to Wisconsin Governor Tony Evers on Teacher Mulligans and our Disastrous Reading Results
2017: West High Reading Interventionist Teacher’s Remarks to the School Board on Madison’s Disastrous Reading Results
Madison’s taxpayer supported K-12 school district, despite spending far more than most, has long tolerated disastrous reading results.
“An emphasis on adult employment”
Wisconsin Public Policy Forum Madison School District Report[PDF]
WEAC: $1.57 million for Four Wisconsin Senators
Friday Afternoon Veto: Governor Evers Rejects AB446/SB454; an effort to address our long term, disastrous reading results
Booked, but can’t read (Madison): functional literacy, National citizenship and the new face of Dred Scott in the age of mass incarceration.
When A Stands for Average: Students at the UW-Madison School of Education Receive Sky-High Grades. How Smart is That?
In February, 2023 Bari Weiss produced a podcast, “Why 65% of Fourth Graders Can’t Really Read” and Nicholas Kristof, New York Times columnist, wrote “Two-Thirds of Kids Struggle to Read, and We Know How to Fix It.” Both headlines are misleading. The 65% and two-thirds figures are referring to the percentage of 4th graders who scored below proficient on the last reading test of the National Assessment of Educational Progress (NAEP), administered in 2022.
The problem is this: scoring below proficient doesn’t mean “can’t really read” or “struggling to read.” It also does not mean “functionally illiterate” or identify “non- readers” as some of the more vituperative descriptions on social media have claimed. It doesn’t even mean “below grade level in reading,” one of the milder distortions.
Both press reports were second-hand accountings of Emily Hanford’s series, Sold a Story. Hanford immediately took to Twitter to try to clear up the matter.
But what about the percent below basic? How do they fare, Tom? And when we go periods of time when we fail to make progress in further reducing the percent below basic we are harming these children and putting their prospects at risk, no? @arotherham @1in5advocacy @CharlesBarone
— Sandy Kress (@Kress_Sandy) June 12, 2023
“Well, it’s kind of too bad that we’ve got the smartest people at our universities, and yet we have to create a law to tell them how to teach.”
The data clearly indicate that being able to read is not a requirement for graduation at (Madison) East, especially if you are black or Hispanic”
My Question to Wisconsin Governor Tony Evers on Teacher Mulligans and our Disastrous Reading Results
2017: West High Reading Interventionist Teacher’s Remarks to the School Board on Madison’s Disastrous Reading Results
Madison’s taxpayer supported K-12 school district, despite spending far more than most, has long tolerated disastrous reading results.
“An emphasis on adult employment”
Wisconsin Public Policy Forum Madison School District Report[PDF]
WEAC: $1.57 million for Four Wisconsin Senators
Friday Afternoon Veto: Governor Evers Rejects AB446/SB454; an effort to address our long term, disastrous reading results
Booked, but can’t read (Madison): functional literacy, National citizenship and the new face of Dred Scott in the age of mass incarceration.
When A Stands for Average: Students at the UW-Madison School of Education Receive Sky-High Grades. How Smart is That?
Students of all backgrounds are having academic success in Mississippi.
Our state is in the top of the nation in 4th grade reading gains for black students!
Thank you to our teachers, parents, and students for working so hard to get us here. pic.twitter.com/7Jw3wkj47H
— Governor Tate Reeves (@tatereeves) November 4, 2022
The data clearly indicate that being able to read is not a requirement for graduation at (Madison) East, especially if you are black or Hispanic”
My Question to Wisconsin Governor Tony Evers on Teacher Mulligans and our Disastrous Reading Results
2017: West High Reading Interventionist Teacher’s Remarks to the School Board on Madison’s Disastrous Reading Results
Madison’s taxpayer supported K-12 school district, despite spending far more than most, has long tolerated disastrous reading results.
“An emphasis on adult employment”
Wisconsin Public Policy Forum Madison School District Report[PDF]
WEAC: $1.57 million for Four Wisconsin Senators
Friday Afternoon Veto: Governor Evers Rejects AB446/SB454; an effort to address our long term, disastrous reading results
Booked, but can’t read (Madison): functional literacy, National citizenship and the new face of Dred Scott in the age of mass incarceration.
No When A Stands for Average: Students at the UW-Madison School of Education Receive Sky-High Grades. How Smart is That?
In 2022, the average fourth-grade mathematics score decreased by 5 points and was lower than all previous assessment years going back to 2005; the average score was one point higher compared to 2003. The average eighth-grade mathematics score decreased by 8 points compared to 2019 and was lower than all previous assessment years going back to 2003. In 2022, fourth- and eighth-grade mathematics scores declined for most states/jurisdictions as well as for most participating urban districts compared to 2019. Average scores are reported on NAEP mathematics scales at grades 4 and 8 that range from 0 to 500
The percentage of students who performed at or above the proficient level in reading was 36% in 2019, 35% in 2017 and 34% in 1998. While Wisconsin’s numbers remain higher than Mississippi’s, the trend line is flat.
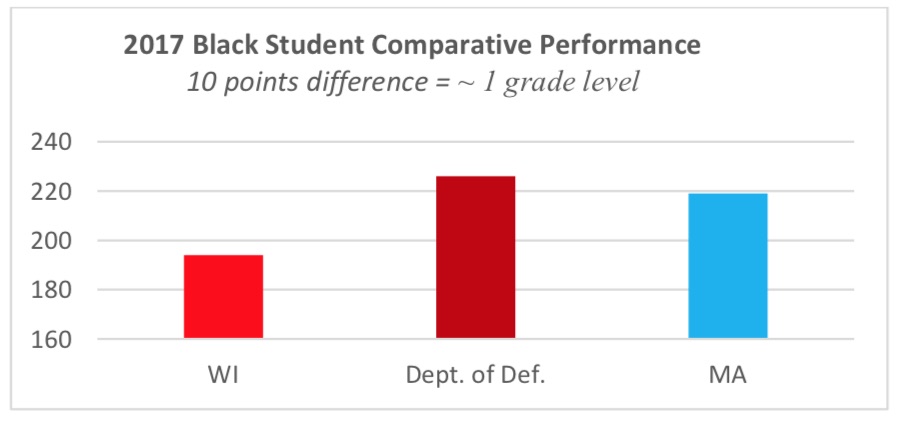
Further, Black fourth-graders in Mississippi are outperforming Black fourthgraders in Wisconsin in reading, portending what’s to come in other academic measurements as the students age. And while Black students in Mississippi averaged a reading score 21 percentage points lower than White students — nothing to be content with — the performance gap was 39 points in Wisconsin, a chasm that is both shocking and familiar.
“We have done virtually nothing to close the Black-white gap,” said state Rep. LaKeshia Myers, a Milwaukee Democrat.
Nationally, a just-released NAEP report, the first to gauge the impact of the COVID pandemic, shows a national drop in scores. State by state results will come later. Still, while far from perfect, Mississippi appears to offer lessons on how reading improvements can be achieved.
The data clearly indicate that being able to read is not a requirement for graduation at (Madison) East, especially if you are black or Hispanic”
2017: West High Reading Interventionist Teacher’s Remarks to the School Board on Madison’s Disastrous Reading Results
Madison’s taxpayer supported K-12 school district, despite spending far more than most, has long tolerated disastrous reading results.
My Question to Wisconsin Governor Tony Evers on Teacher Mulligans and our Disastrous Reading Results
“An emphasis on adult employment”
Wisconsin Public Policy Forum Madison School District Report[PDF]
WEAC: $1.57 million for Four Wisconsin Senators
Friday Afternoon Veto: Governor Evers Rejects AB446/SB454; an effort to address our long term, disastrous reading results
Booked, but can’t read (Madison): functional literacy, National citizenship and the new face of Dred Scott in the age of mass incarceration.
No When A Stands for Average: Students at the UW-Madison School of Education Receive Sky-High Grades. How Smart is That?
NAEP scores were not good! We heard from Morgan Polikoff, Marguerite Roza, and Sandy Kress with thoughts on why. Today Denise Forte, CEO of the Education Trust weighs in:
NAEP Is Telling Us Again That It’s Past Time to Close Long-Standing Resource Gaps By Denise Forte
Those who study educational disparities know that money matters in education. And it’s not just about how much money is allocated, it’s about resource equity, that is, how effectively state and district leaders spend their funds and whether funds are distributed equitably.
From this perspective, the story behind this year’s lackluster NAEP results began nearly a decade ago. The eighthgraders whose test results were captured by NAEP’s long-term assessment were born right before the Great Recession. They started kindergarten around 2012-13 as federal relief dollars for schools dried up, impacting the very factors that are essential to ensuring a high-quality learning experience.
Consider that state preschool program access and quality declined as a result of the economic downturn and have yet to return to pre-recession trends. Also, between 2008 and 2012, the K-12 public education system lost nearly 300,000 jobs, the largest reduction in our nation’s history. Of the jobs lost, more than 120,000 belonged to elementary and secondary teachers with layoffs disproportionately affecting schools serving students of color and students from low-income backgrounds.
Even when district leaders were able to reinstate classes and programs that were reduced or eliminated during the recession, there were teacher shortages, especially in math, science, and special education. It has taken years to begin rebuilding the teacher workforce. Yet, the nation still has fewer public school teachers today than it did in 2008 and remains a long way from developing a racially and culturally diverse workforce that reflects the diversity of the student population.
Reading and math scores fell between 2012 and 2020, especially for 13-year-olds, according to the National Assessment of Educational Progress (NAEP), which released is 2020 assessment of long-term trends today.
High performing students did as well as ever, but low-performing students slid farther behind, reports Kevin Mahnken on The 74.
Students were tested before the pandemic lockdowns. Tests in 2022 are expected to show the effect of disrupted education.
Scores for nine-year-olds held steady, except for girls, who did significantly worse in math than in 2012.
“It’s really a matter for national concern, this high
Thirteen-year-olds saw unprecedented declines in both reading and math between 2012 and 2020, according to scores released this morning from the National Assessment of Educational Progress (NAEP). Consistent with several years of previous data, the results point to a clear and widening cleavage between America’s highest- and lowest-performing students and raise urgent questions about how to reverse prolonged academic stagnation.
The scores offer more discouraging evidence from NAEP, often referred to as “the Nation’s Report Card.” Various iterations of the exam, each tracking differentsubjects and age groups over several years, have now shown flat or falling numbers.
The latest release comes from NAEP’s 2020 assessment of long-term trends, which was administered by the National Center for Education Statistics to nine- and 13-year-olds before COVID-19 first shuttered schools last spring. In a Wednesday media call, NCES Commissioner Peggy Carr told reporters that 13-year-olds had never before seen declines on the assessment, and the results were so startling that she had her staff double-check the results.
“I asked them to go back and check because I wanted to be sure,” Carr recalled. “I’ve been reporting these results for…decades, and I’ve never reported a decline like this.”
2017: West High Reading Interventionist Teacher’s Remarks to the School Board on Madison’s Disastrous Reading Results
Madison’s taxpayer supported K-12 school district, despite spending far more than most, has long tolerated disastrous reading results.
My Question to Wisconsin Governor Tony Evers on Teacher Mulligans and our Disastrous Reading Results
“An emphasis on adult employment”
Wisconsin Public Policy Forum Madison School District Report[PDF]
WEAC: $1.57 million for Four Wisconsin Senators
Booked, but can’t read (Madison): functional literacy, National citizenship and the new face of Dred Scott in the age of mass incarceration.
The results for the 2019 administration of the National Assessment of Educational Progress (NAEP) have just been released. The NAEP is given to samples of students around the country on a biannual basis and provides the best method for comparing performance among students in different states. Unfortunately for Wisconsin, the story is yet another riff on a tired tune: student achievement is largely stagnant and wide racial achievement gaps persist.
Overall, achievement in Wisconsin remains relatively flat. Scores have moved no more than a point in either direction over the past decade. In some ways, this is not a bad thing. Wisconsin students remain above the national average among eighth graders in reading and math. But there is some cause for concern. Wisconsin’s fourth grade students used to exceed the national average in these areas as well but are now on par with the rest of the country. It appears other states are “catching up” to Wisconsin.
Some might say that this is a result of cuts in Wisconsin’s spending, but the facts don’t support this. The chart below shows Wisconsin’s per pupil spending since 2013 along with the NAEP scores. Inflation-adjusted spending has increased while NAEP scores stagnate.
2017: West High Reading Interventionist Teacher’s Remarks to the School Board on Madison’s Disastrous Reading Results
Madison’s taxpayer supported K-12 school district, despite spending far more than most, has long tolerated disastrous reading results.
My Question to Wisconsin Governor Tony Evers on Teacher Mulligans and our Disastrous Reading Results
“An emphasis on adult employment”
Wisconsin Public Policy Forum Madison School District Report[PDF]
Booked, but can’t read (Madison): functional literacy, National citizenship and the new face of Dred Scott in the age of mass incarceration
While last week’s NAEP news was glum nationwide, Mississippi students performed relatively well. You have to dig into the details to see just how well.
First, a bit of backstory.
Mississippi is one of the nation’s poorest states and has the largest African-American student population in the country. The state has ranked at or near the bottom on NAEP scores for many years. Over the past decade, policymakers have adopted several K-12 policies familiar to Floridians: A-F letter grades for schools, a strong emphasis on early literacy, a charter school law and an education savings account program for students with disabilities.
The state’s choice sector went from non-existent to nascent in recent years, although it’s not yet at a scale where it can play more than a complimentary role to the public education system. Yet based on this year’s NAEP, as seen in this crosstab of student race/ethnicity on fourth-grade reading, something seems to have gone very right.
Meanwhile, Wisconsin continues to address its long term, disastrous reading results by granting thousands of mulligans to elementary reading teachers.
One surprising finding in the school-level spending numbers was that spending is actually higher in schools with higher levels of poverty, generally speaking, even after federal dollars—which are typically higher at schools with more students in poverty—are removed.
“You can’t draw many conclusions,” said Alabama Superintendent Eric Mackey directly from the spending data. While some want to look for correlations between high amounts of spending and high student outcomes, he said, it’s just not that easy.
In Alabama, the average amount spent per student was $9,425, but spending ranged from $726 per student in Limestone County’s Virtual School Center to $131,305 per student at Shelby County’s Linda Nolen Learning Center, which served 49 students with unique emotional, academic and medical needs.
When federal dollars are removed from the mix, the average amount drops to $7,787 statewide, and spending at the school level ranges from $637 per student at Decatur High’s Developmental school to $116,240 at Tuscaloosa City School’s Oak Hill School. Both of those schools serve students with special needs.
Madison taxpayers spend between $18.5k to 20K per student, depending on the District documents reviewed.
Visit the Nation’s Report Card to compare academic results.
“I didn’t have one phone call, I don’t have one email about this NAEP data. But my phone can ring all day if there’s a fight at a school or can ring all day because a video has gone out about a board meeting. That’s got to change, that’s just got to change. …
“My best day will be when we have an auditorium full of people who are upset because of our student performance and our student achievement and because of the achievement gaps that we have. My question is, where is our community around these issues?
“I feel that people have become very numb to our data and numb to poor performance. I can appreciate that it is frustrating. I have been in education my whole life and it is frustrating, you do feel like the work that we’re doing isn’t getting us where we want to be. But we can’t give up.”
She said, “Look, the data are telling us that what we’re doing isn’t working. Arguing hasn’t gotten us anywhere. Being polarized in our education beliefs has not gotten us anywhere.”
Madison spends more per student than Milwaukee, yet has long tolerated disastrous reading results.
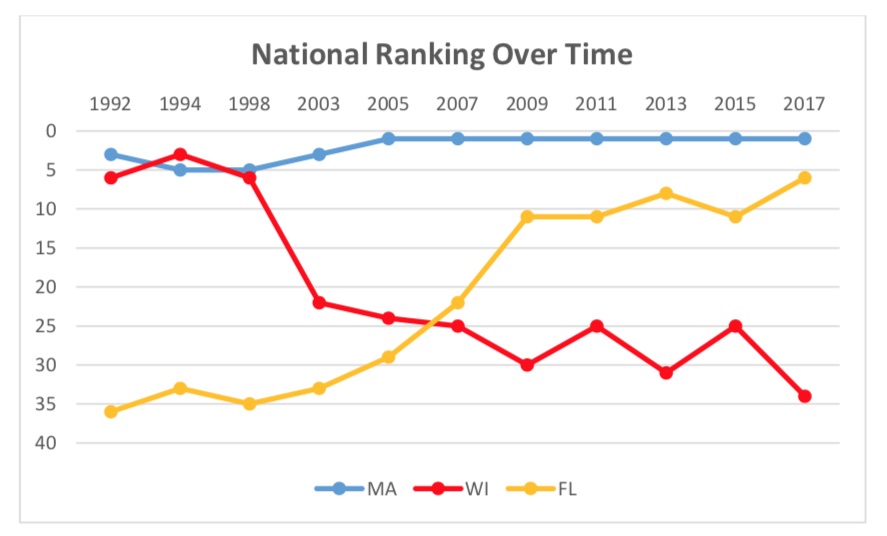
Main takeaways from the 2017 NAEP 4th grade reading exam:
Wisconsin’s score was 220, below the national average of 222
Wisconsin score statistically declined from 2015
Wisconsin scores have been statistically flat since 1992
Wisconsin ranked 34th nationally, compared to 25th in 2015
All Wisconsin racial, economic status, and disability status sub-groups perform below the national average for that sub-group
Wisconsin African-American students rank 49th among black students in the country and
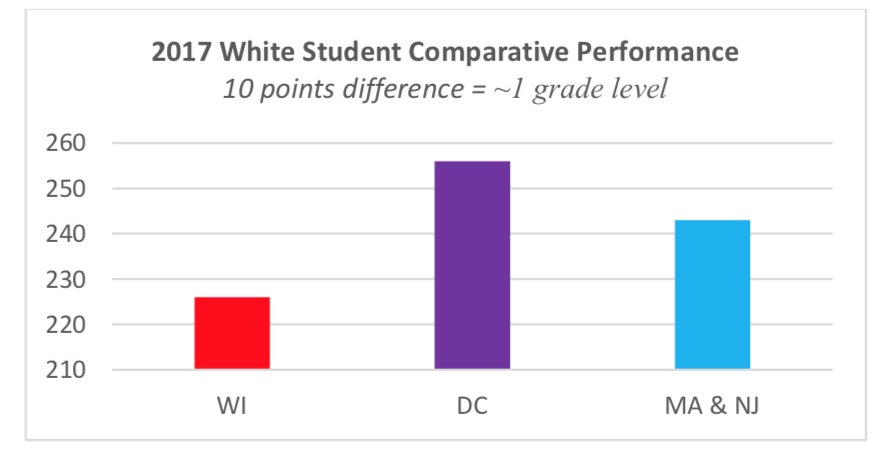
Wisconsin white students rank 41st (behind Alabama and Mississippi) among white students
Wisconsin has a gap of 32 points between white and black students, the fifth largest in the country; this gap represents approximately 3 grade levels
Wisconsin ranks 31st in the country for the percentage of students at proficient or advanced
35% of Wisconsin 4th graders score proficient or advanced, down from 37% in 2015
51.7% of Wisconsin 4th graders were proficient or advanced on the 2016-17 Wisconsin Forward exam, raising the question of whether Wisconsin is again starting to move away from the NAEP scale in scoring its own state tests
Milwaukee is 25th of 26 national urban districts, with a 30 point white/black gap
Madison has long tolerated disastrous reading results, despite spending more than most, now nearly $20,000 per student.
Michael Hansen, Elizabeth Mann Levesque, Diana Quintero, and Jon Valant
:
Last week, the National Assessment Governing Board and National Center for Education Statistics released results from the 2017 National Assessment of Education Progress (NAEP). Often referred to as “the Nation’s Report Card,” these results provide a bi-annual barometer on how states and the country as a whole are performing in the classroom. This year’s results are particularly noteworthy because they are from the final NAEP administered before implementation of the new Every Student Succeeds Act (ESSA), which replaced No Child Left Behind (NCLB). In this sense, these results reflect a boundary in the timeline of education policy, demarcating the end of the NCLB era and the beginning of the ESSA era.
The release itself and the early commentary on the results so far has largely highlighted the overall flat trend lines among the nation’s schoolchildren. Though the early NCLB era did see some improvements in student achievement, it appears that this progress has largely stalled during the latter half of the period. Moreover, a dip in performance in the 2015 assessment has persisted in the current results, suggesting it was no statistical anomaly.
Telated: Madison’s long term, disastrous reading results.
Wisconsin Reading Coalition, via a kind email:
The 2017 scores from the National Assessment of Educational Progress have been released, and the news is not good for Wisconsin. All the data is available in the NAEP Data Explorer at https://www.nationsreportcard.gov/ndecore/landing.
We will do a detailed analysis soon, but here are some important takeaways from the 4th grade reading test:
- Wisconsin ranked 34th nationally, our lowest ranking to date
- The Wisconsin average score is 220 (down 4 points from two years ago, and 2 points lower than the national average)
- Our black students ranked 49th (3rd from last)
- Our white students ranked 41st (lower than white students in Alabama and Mississippi)
- Our black-white gap was tied for 5th largest in the country
- 65% of Wisconsin students were not proficient in reading: 34% were below basic, 31% basic, 27% proficient, and 8% advanced
- All of our racial sub-groups, as well as low SES students and students with disabilities performed below the national average for their particular sub-group
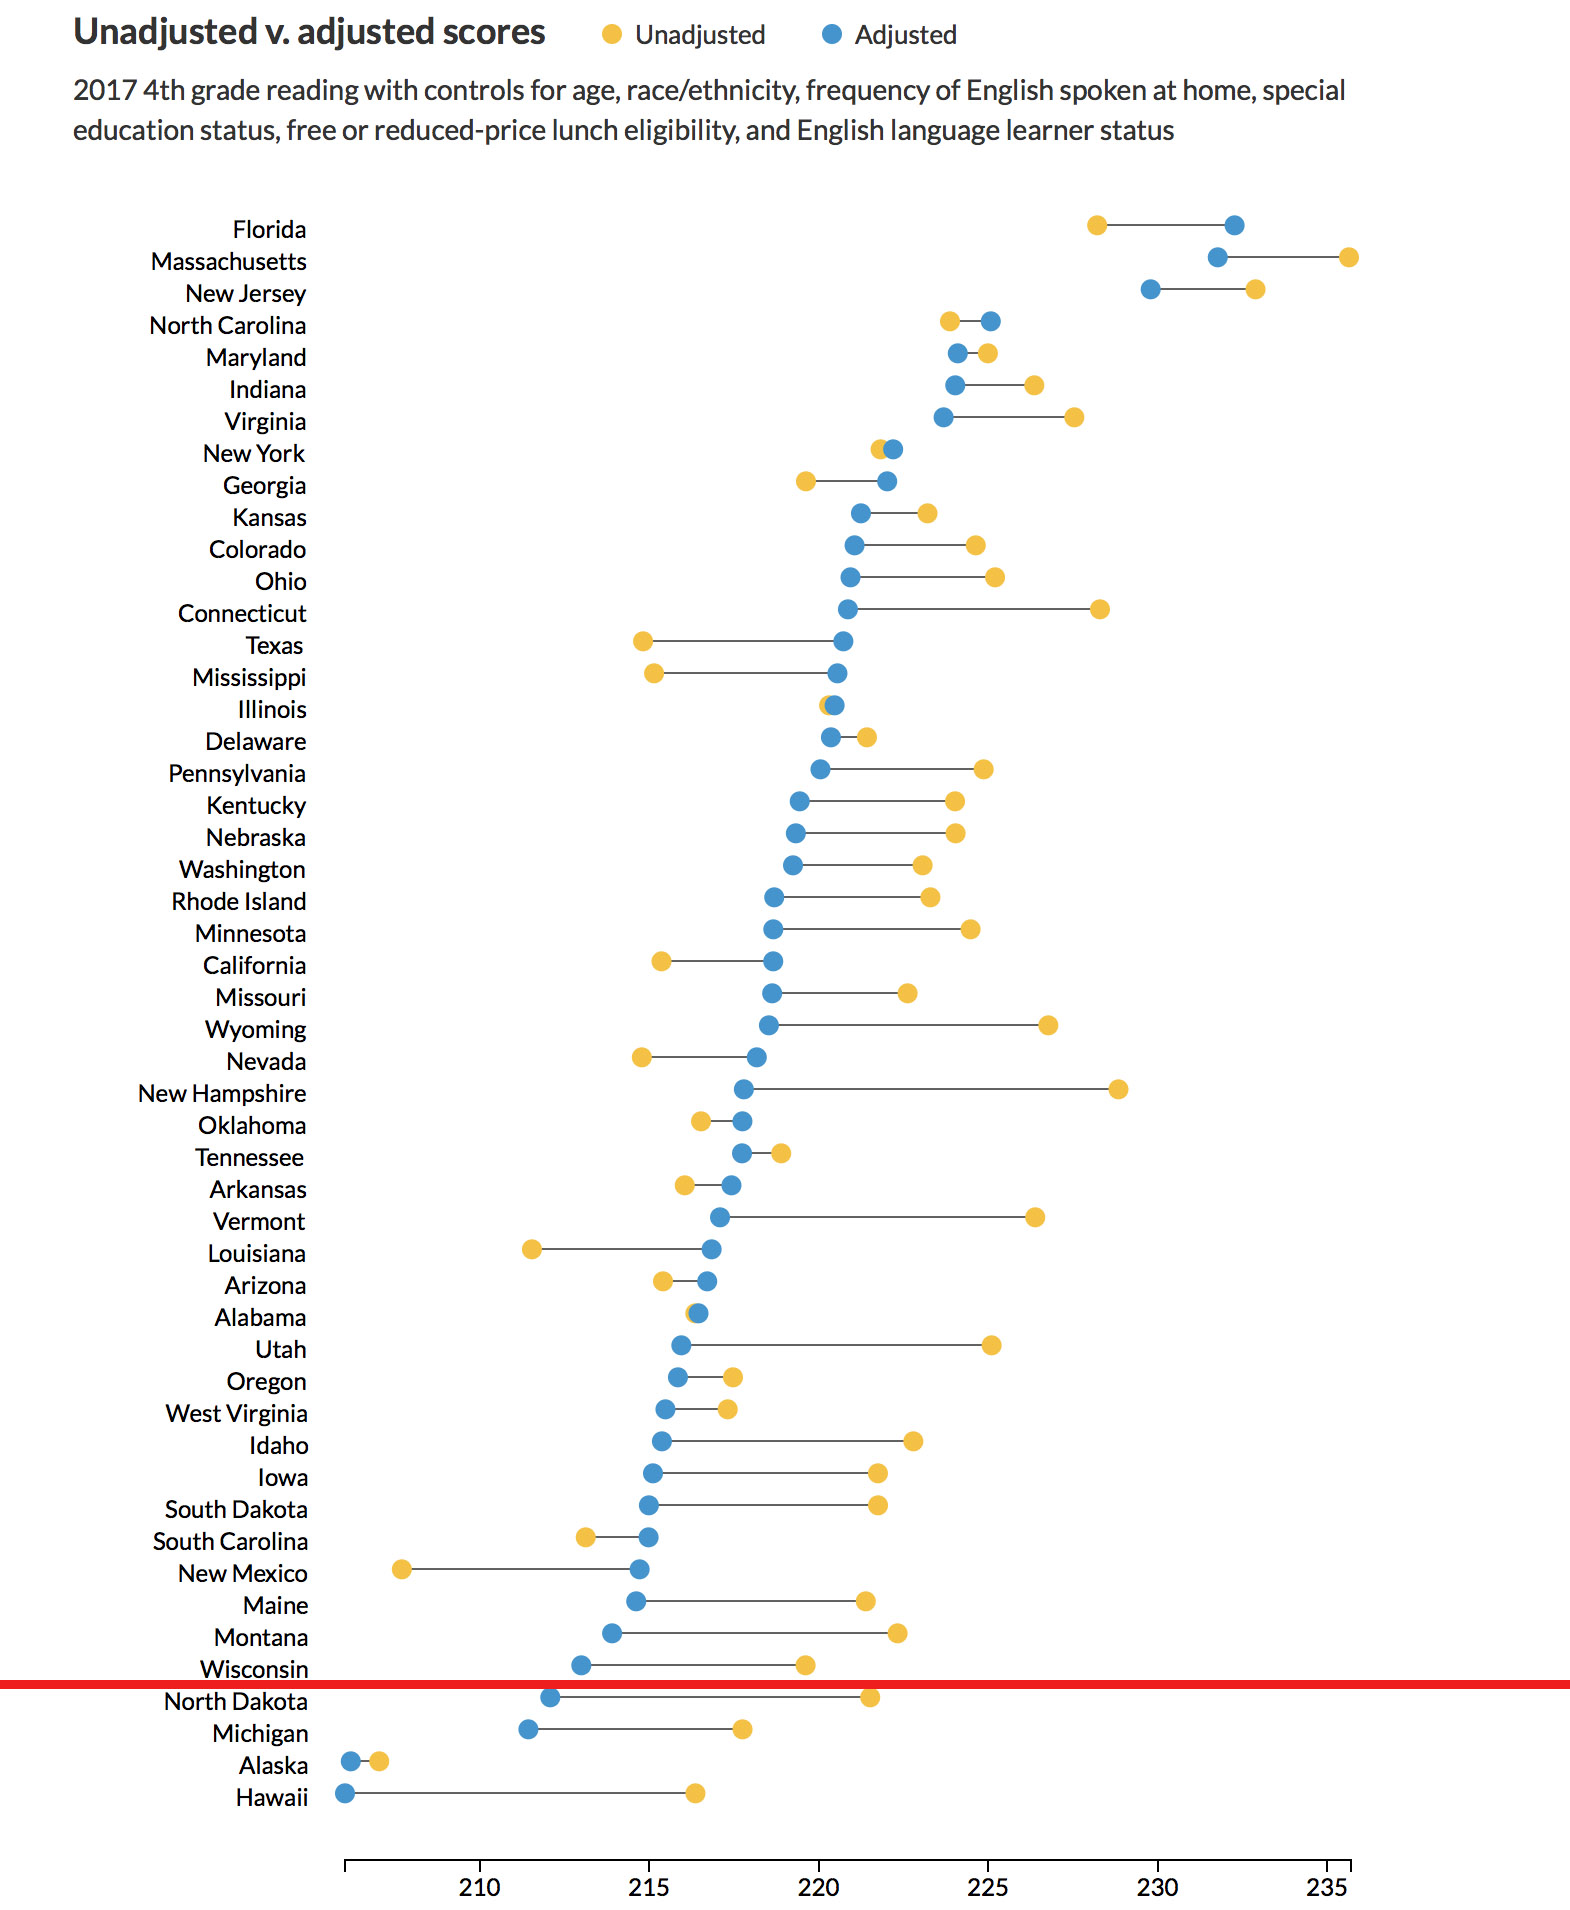
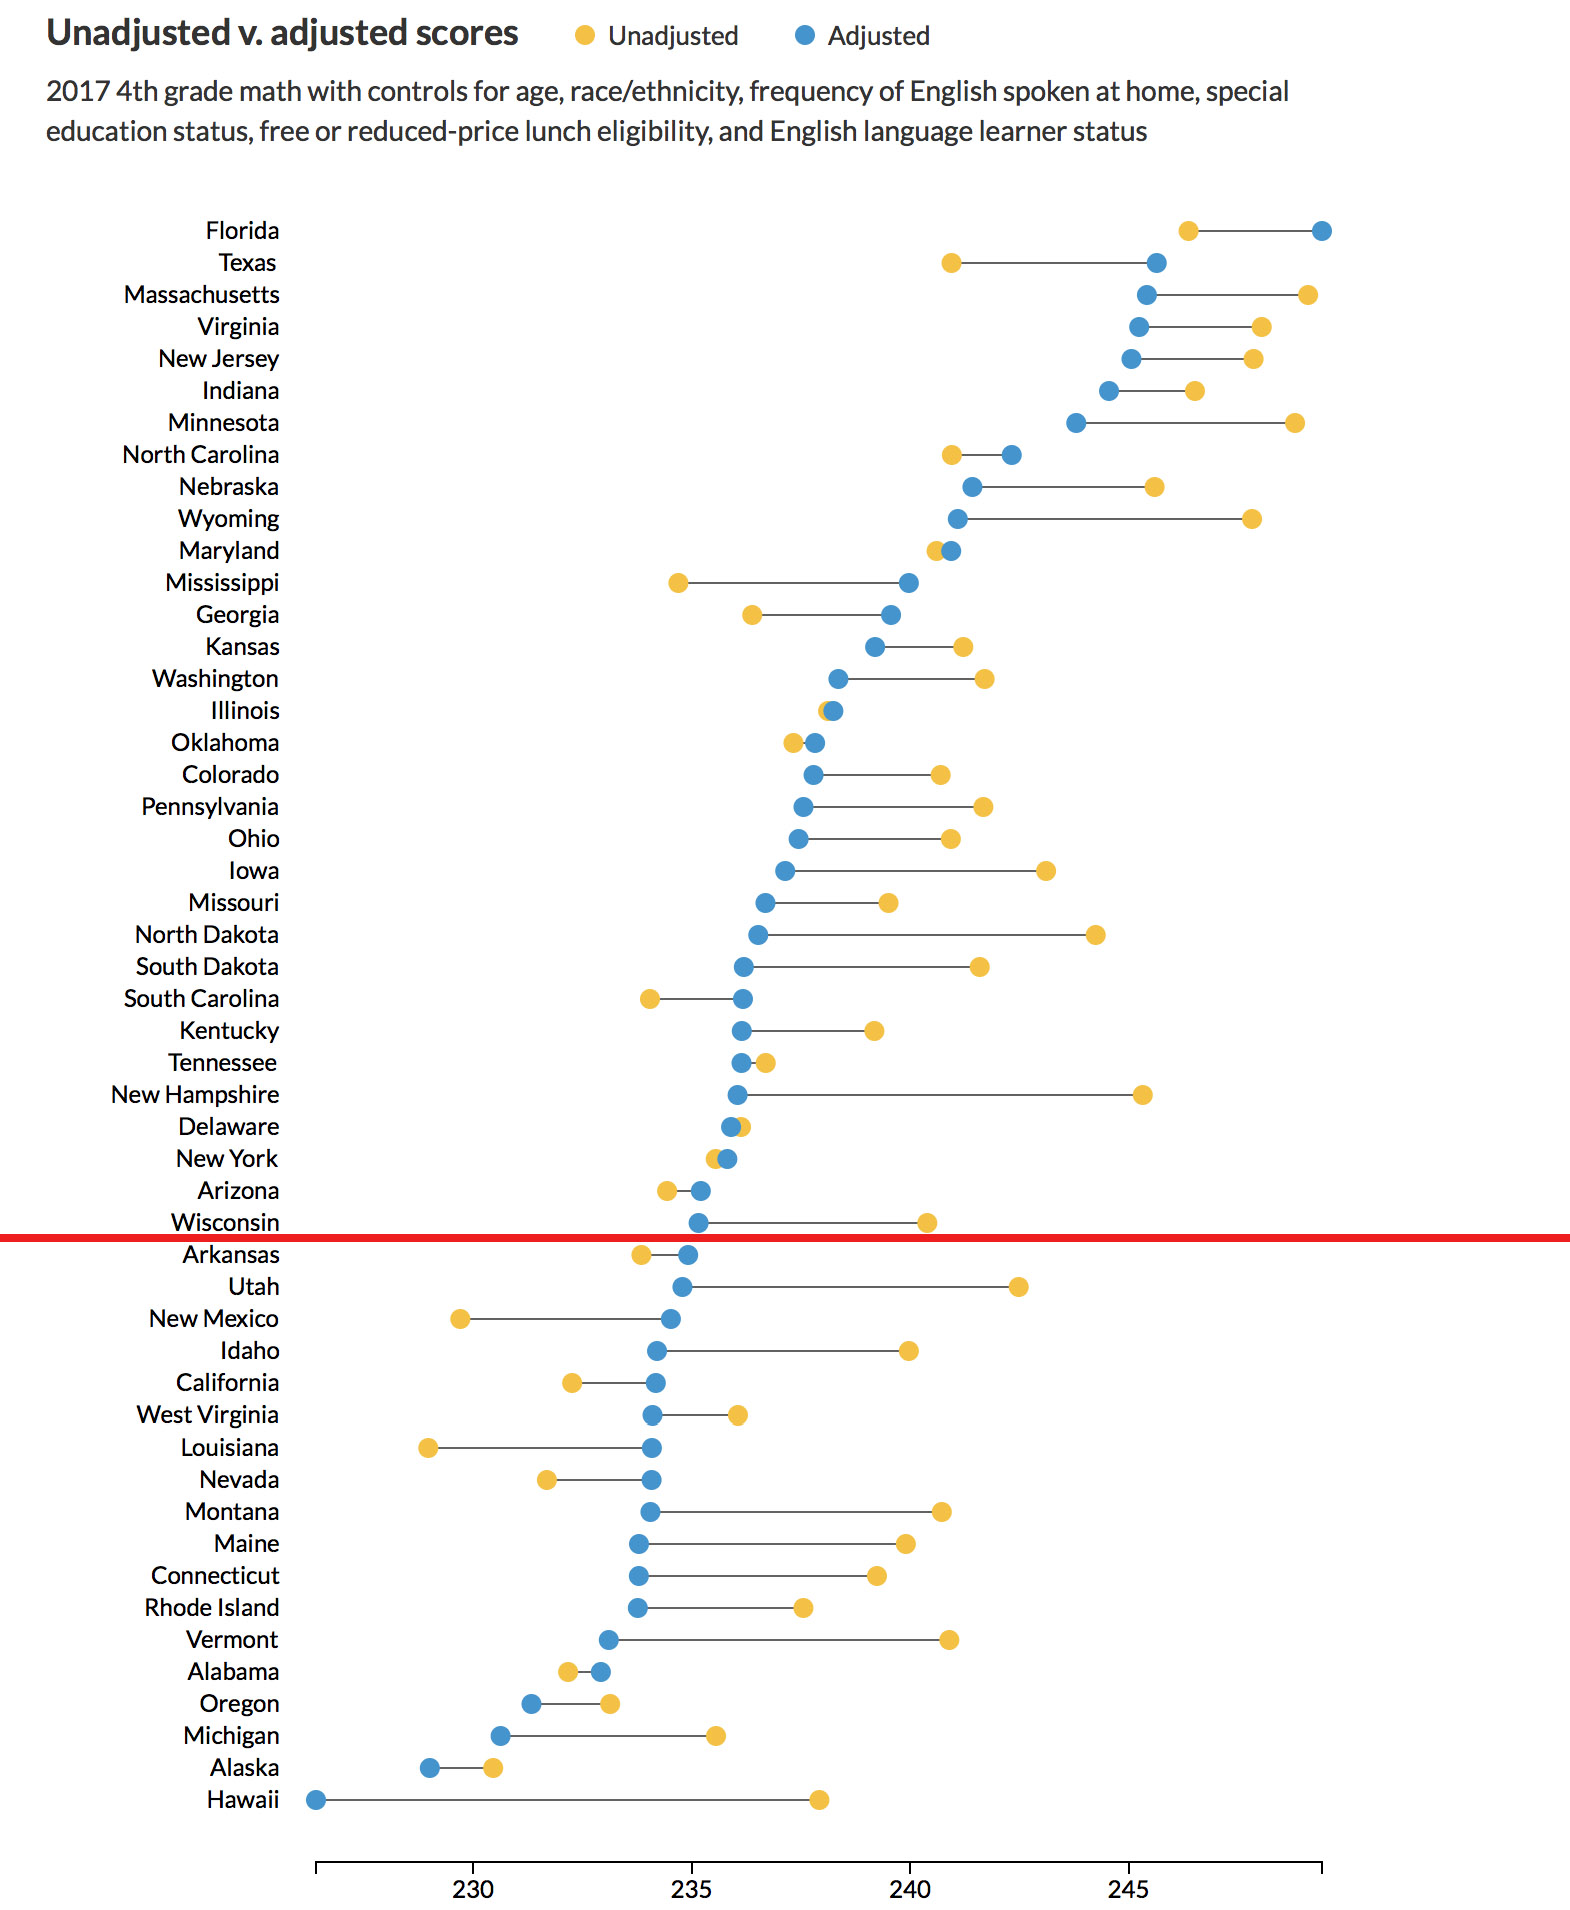
Charts from the Urban Institute:
Wisconsin ranks 22nd amongst the States in per student spending at $11,375.
Madison currently spends nearly $20,000 per student, far more than most school districts. Yet, we’ve long tolerated disastrous reading results.
Matthew Ladner on charters and the “lost decade”.
As feared, the new results from the National Assessment of Educational Progress show that national trends are mostly flat. Coming on the heels of some modest declines in 2015, the 2017 scores amount to more bleak news. It’s now been almost a decade since we’ve seen strong growth in either reading or math, with the slight exception of eighth grade reading. There’s no way to sugarcoat these scores; they are extremely disappointing.
Much more on NAEP, here.
Related: Stretchtargets.org
Since 2002, federal law has conditioned Title I funding on states’ participation in the biannual administration of the National Assessment of Educational Progress (NAEP) in math and reading in grades four and eight. This is a boon to us policy wonks because we can study the progress (or lack thereof) of individual states and use sophisticated research methodologies to relate score changes to differences in education policies or practices. That’s the approach that allowed Tom Dee and Brian Jacob, for example, to inform us that NCLB-style accountability likely boosted math achievement in the 2000s.
Over the years, NAEP has also made stars out of leading states and their governors or education leaders, and has galvanized reformers to try to learn from their successes. It started with North Carolina and Texas, which saw stratospheric increases in the 1990s, especially in math, and across all racial groups. Then it was Jeb Bush’s moment in the sun, as Florida’s scores climbed quickly from the late-1990s through the 2000s, with particular progress for black and Hispanic youngsters. Delaware, Minnesota, and even New York have also produced some big improvements at various times. And let us not forget the Massachusetts Miracle.
My guess is that reformers picked the low-hanging fruit of education reform in the early aughts. The introduction of standards and testing in the early days seems to have produced a bump in achievement. Over time however this effect may be fading.
Political Science 101 teaches that organized interests defeat diffuse interests 99 times out of a hundred, so the ability of states to employ a cat o’ nine tails and whip schools into improvement has limits. Dozens of decisions taken daily in the musty basements of State Departments of Education and obscure measures voted on by State Boards of Education can slowly but surely defang and/or subvert state accountability systems.
If there are two things that the organized employee interests of adults working in schools are expert at it is passive resistance and bureaucratic infighting. In my book, much of the reform crowd chose to fight their opponents on ground they did not choose wisely, and upon which they have little chance to prevail. Things fall apart, the center cannot hold.
Mike Petrilli recently and correctly imo noted that the 2017 NAEP would be a pretty definitive test on the efficacy of the Obama year projects- promoting Common Core and teacher evaluation, student discipline reform. Top down directives have a funny way of not working out, even backfiring. Let’s see what happens next.

Tap for a larger version.
Wisconsin Reading Coalition:
Are you interested in how Wisconsin 4th graders’ reading performance stacks up against other 4th graders nationwide? The National Assessment of Education Progress (NAEP), administered every two years, is the one way we can get answers. See the attached document for the results from the 2015 NAEP, including our current and historical national ranking and how subgroups of Wisconsin students compare to each other as well as to their peers in higher performing states.
The first step in improving outcomes is always to be knowledgeable and honest about our current performance.
Much more, here (PDF Commentary).
Wisconsin’s long serving WKCE exam was often criticized for its low standards.
Overall, the 2015 National Assessment for Educational Progress (NAEP) data released today were disappointing. We’ll be delving into it for weeks, looking for insights along with many of our fellow edu-data nerds. For today, we’ll refer you to some of the good work that’s already been done from our friends at the The Education Trust, The Education Post, and from USC Professor Morgan Polikoff.
Because this year’s NAEP scores came on the heels of the first wave of Common Core-aligned assessments — Smarter Balanced Assessment Consortium (SBAC) and the Partnership for Assessment of Readiness for College and Careers (PARCC) — we decided to match up the results for states with data across those instruments.
They do not include individual district- and school-level data for public schools or the scores for private schools participating in the state-funded voucher programs.
Among the highlights:
The composite score for juniors who took the ACT was 20 on a scale of 36. That’s below the 22.2 reported in August 2015. Again, DPI said any comparisons would be “flawed” because of significant changes in the pool of test-takers.Until this year, the ACT scores reflected those taken during senior year, in many cases by students who had taken it multiple times. The drop was expected because of a new mandate that requires all juniors to take the exam.
Overall, 45.7% of students scored proficient or advanced on the combined ACT/Dynamic Learning Maps exams; 35.9% did as well in math. The ACT/DLM scores also show significant achievement gaps along racial, socioeconomic and other lines.
In the elementary grades, third- and fourth-graders performed significantly better in math than their older counterparts on the Badger Exam. DPI spokesman John Johnson said that may be attributed to the state’s adoption of the Common Core standards.
“What we think is going on is that those students… had been taught pretty much with the new standards from the time they went into school, as opposed to students in the older grades who transitioned to the new standards,” Johnson said.
Milwaukee Public Schools, the state’s largest district, which has a disproportionate percentage of students in poverty, performed well-below the state average, district officials said Wednesday.
In grades three through eight, 27% of MPS students scored proficient or advanced in language arts and 17% did so in math. On ACT scores, 22% of juniors were sufficient or advanced in language arts and 10% did as well in math.
2014-15 Badger Exam (administered April-May 2015), via a kind reader:
% Proficient/Advanced, English Language Arts, 4th grade:
All: 50.4%
Black: 20.2%
Hispanic: 33.5%
White: 57.7%
2015 NAEP
% at or above Proficient:
All: 37%
Black: 11%
Hispanic: 19%
White: 44%
More, from Doug Erickson.
Yesterday’s analysis of exclusion data from the reading portion of this year’s National Assessment of Educational Progress revealed that far too many states were excluding numbers of children in special education ghettos and English Language Learner programs far above what is allowed under federal law. But none of those revelations are a stark as what Dropout Nation learned from analyzing the reading exclusion data from the federal exam’s Trial Urban District Assessment of big-city school systems.
At some point the next few weeks, the results from the 2015 administration of the National Assessment of Educational Progress (NAEP) will be released. I can all but guarantee you that the results will be misused and abused in ways that scream misNAEPery. My warning in advance is twofold. First, do not misuse these results yourself. Second, do not share or promote the misuse of these results by others who happen to agree with your policy predilections. This warning applies of course to academics, but also to policy advocates and, perhaps most importantly of all, to education journalists.
much more of the NAEP scores here.
Walt Gardner, via Will Fitzugh:
Elitism is a dirty word in education in this country.
Just why, I don’t understand because supporting students with academic ability is as important as supporting students with special needs.
I thought of this as I read the news about the latest NAEP results (“U.S. ‘report card’: stagnation in 12th-grade math, reading scores,” The Christian Science Monitor, May 8). The closely watched report showed that high school seniors did no better in reading and math than they did four years ago. The head of the National Assessment Governing Board, which was created by Congress in 1988 to create and measure standards for student performance, warned that too few students are achieving at a level to make the U.S. internationally competitive.
I urge him to look over the index of The Concord Review from 1988 to 2014. For those readers not familiar with TCR, its founder and publisher is Will Fitzhugh. He has provided a forum for essays written overwhelmingly by high school students in this country (and to a small extent to those abroad) on a wide variety of subjects. They range from ancient history to modern issues. I’ve read many of them. They are not only meticulously researched but gracefully written.
I realize that the students who have been published in TCR constitute only a tiny percentage of high school seniors in this country (and in 39 other countries). But I maintain that far more students are capable of writing informative and lively papers than we believe. As much as I respect NAEP, I submit that the essays in TCR are better indicators of the highest academic ability than scores on NAEP. Read some of them to see if you agree.
I don’t know if the almost total focus on students below average is the result of anti-elitism or of sheer ignorance. But TCR serves as compelling evidence that we are squandering talent. Many of these students will go on to make a name for themselves in their various fields of specialization. They’re the ones who can make the U.S. highly competitive in the global economy. Yet we feel extremely uncomfortable supporting them.We don’t have to choose democratization or differentiation. There is room for both in our schools. But so far, most of our resources are earmarked to achieve the former. Only in the U.S. does that happen. Most countries have no compunction about identifying and nurturing their academically gifted students.
————————-
“Teach with Examples”
Will Fitzhugh [founder]
The Concord Review [1987]
Ralph Waldo Emerson Prizes [1995]
National Writing Board [1998]
TCR Institute [2002]
730 Boston Post Road, Suite 24
Sudbury, Massachusetts 01776-3371 USA
978-443-0022; 800-331-5007
www.tcr.org; fitzhugh@tcr.org
Varsity Academics®
tcr.org/bookstore
www.tcr.org/blog
Maryland’s scores on a national reading test may have been inflated because the state’s schools excluded a higher percentage of special-education students than any other state, according to data from the U.S. Department of Education.
The National Center for Education Statistics, which administers the test, estimates that Maryland’s scores were 7 points higher for fourth-grade reading and 5 points higher for eighth-grade reading because of the exclusion.
Maryland has always earned high scores on the National Assessment of Educational Progress, and its steady increases in test scores over the years has helped earn it the ranking of No. 1 in the nation by Education Week, an often-quoted measure.
“When exclusion rates are higher, average scores tend to be higher than if more children were tested,” said Larry Feinberg, assistant director for reporting and analysis for the National Assessment Governing Board, an independent body that sets policy for NAEP.
Florida made small gains over the last NAEP cycle, but how does its growth compare over the long haul? Pretty good.
If you go all the way back to the beginning of NAEP time (which can vary from 1990 to 2003 depending on the grade, subject and sub-group), Florida’s gains since then best the national gains in 38 of 40 categories. If NAEP gains were heavyweight boxing, Florida’s career record would be 38-2 with 11 KO’s (beating the average by 10 or more points).
Florida’s average gain per category is 21.5 points (about two grade levels worth of advancement). Its average spread over the national gain is 7.1 points (nearly a grade level).
One caveat: In the two areas where Florida was beat by the national average (4th grade math by English Language Learners (ELL) and 8th grade math by low-income Hispanics) the results may be biased because so few states had enough ELL and Hispanic students to compare.
What are we doing wrong? Why aren’t things getting better?
No, I don’t have some powerful secret answer. But I know the urgency behind the questions became all the clearer last week, whether you’re talking about Milwaukee or Wisconsin as a whole. Whatever it is that would work, we haven’t done it yet or, at best, we haven’t done it well enough.
There are so many people trying to change education outcomes for the better. I respect so many of them and think some are having praiseworthy impact in specific arenas. But the overall pursuit? Look at the record.
There are two reasons for my fresh agitation:
First are new results from the National Assessment of Educational Progress (NAEP). NAEP is the best, most nailed-down gauge of how students are doing nationwide. About every two years, NAEP releases results from reading and math tests of samples of fourth and eighth graders in every state. New results came out Thursday.
Nationwide, there were some bright spots, but overall, not much was new or better.
For Wisconsin, the results were disheartening. The average score of a fourth grader in reading was lower than in 1992. We pride ourselves on being a high performing state, but the Wisconsin score and the national score were the same. Sounds pretty middle-of-the-pack to me.
There has been long-term improvement in math scores in Wisconsin. But almost all of it occurred years ago — scores have been flat for the last half-dozen years.
Wisconsin Reading Coalition, via a kind email:
The results of the 2013 National Assessment of Educational Progress (NAEP) were released today. For Wisconsin, the news on reading is much the same as it was two years ago at the last NAEP administration. 33.6% of our 4th graders reached the proficient level. Massachusetts again scored at the top, with 50.4% of its 4th graders proficient.
Wisconsin students who are Asian, black, and white, as well as students who are not eligible for a free and reduced lunch, all posted scores that are significantly lower than the national averages for those groups of students. We had no 4th grade sub-groups that scored significantly above the national average for their group.
Wisconsin’s black 8th graders had the lowest scores in the nation, falling below Mississippi and Alabama. Wisconsin’s black 4th graders had the second lowest scores in the nation, and at both 4th and 8th grade, Wisconsin had the largest gap between white and black students.
As we examine the data more fully, we will have more specifics.
Fourth- and eighth-graders across the country made modest advances in national math and reading exams this year, according to data released Thursday, but proficiency rates remained stubbornly below 50% on every test.
Amid the sluggish progress nationwide, a few areas notched drastic improvements on the 2013 National Assessment of Educational Progress exams, with Tennessee and Washington, D.C., –as well as schools on military bases–the only ones achieving statistically significant gains on all tests.
Washington gained a cumulative 23 points since 2011, while Tennessee posted a 22-point jump–both compared with a 4-point national gain. The exams are scored on a 0-500 scale.
Officials in Tennessee and Washington attributed the gains to tougher classroom math and reading standards, improved teacher development and overhauling teacher evaluations.
State posts widest achievement gap in ‘the nation’s report card’ by Lydia Mulvany:
Steven Dykstra, a founding member of the Wisconsin Reading Coalition, a grassroots group devoted to reforming reading instruction, said the state needs to start imitating reforms in other states by training teachers more effectively. In the past, Wisconsin students ranked as high as third in the nation in reading.
“This isn’t a surprise. The last time we did well in reading was when everyone sucked at reading,” Dykstra said. “When some states started doing better, they very quickly left us behind.”
“Left behind” is precisely what the data shows is happening to Wisconsin’s black students:
Eighth graders, reading: 9% were judged proficient; 55% rated below basic, the most of any state.
Fourth graders, reading: 11% were proficient; 65% scored below basic, again the most of any state.
Eighth graders, math: 8% were proficient; 62% rated below basic, better than only three states.
Fourth graders, math: 25% were proficient; 30% scored below basic, again with only three states performing worse.
Henry Krankendonk, a retired Milwaukee Public Schools math curriculum planner and NAEP board member, said Wisconsin’s failure to narrow the disparity — which has existed for decades — is a challenge for Milwaukee in particular, because it has the highest concentration of minority students. Krankendonk said the problem has long been weak standards for what students should know, and he was hopeful that the recent adoption of new standards more in line with NAEP, called Common Core State Standards, would help.
Meanwhile, St. Norbert College Education Professor Steve Correia emphasized how well (!) Reading Recovery is working while discussing Wisconsin’s NAEP results on WPR. [5.6mb mp3 audio]
Related: Madison’s long term disastrous reading results.
Much more on NAEP over time, here.
Next, by grade: In 1978, 28 percent of NAEP-LTT test takers were in 7th grade or lower, compared with 39 percent in 2012. Although standards and curriculum are different today, it’s worth noting that the 13-year old sample has changed as far as where they are in the K-12 system.
Third, there is the difference in parental education. The proportion of the 2012 sample with parents who completed college is over twice as high (54 percent) as in 1978 (26 percent). Conversely, the percentage of 13-year olds with parents who have a high school diploma or less is half its 1978 level. Again, some of this change is recent – for example, the proportion with a high school diploma or less was 27 percent in 1999, compared with 20 percent in 2012.
In short, the student population, and thus the NAEP samples, are changing, over the short- and longer terms. Any concurrent changes in testing performance may just as easily be due to these and many other shifts in the characteristics of the test takers- including unobservable factors that cannot be gleaned from breakdowns by subgroup – as to any change in school performance. This most certainly does not mean that schooling quality is unimportant, only that raw NAEP scores by themselves do not measure it very well, and they’re not supposed to.
bout 22 percent of California’s eighth-graders tested on a national science test passed, ranking the Golden State among the worst in the nation, according to figures released Thursday.
Scores from the 2011 National Assessment of Educational Progress, also known as the Nation’s Report Card, show that too few students have the skills that could lead to careers in the field, educators said.
Nationally, 31 percent of eighth-graders who were tested scored proficient or advanced. Both the national and state scores improved slightly over scores from two years ago, the last time the test was administered.
2011 NAEP Science results (3.3MB PDF).
What does the Hillsborough County, Fla., school district have that Milwaukee Public Schools doesn’t? What about Charlotte-Mecklenburg schools in North Carolina?
Much better overall scores in reading and math, for one thing. They were at the top of the list of 21 urban school districts in results released last week as part of the National Assessment of Education Progress, or NAEP. Milwaukee was near the bottom.
But here’s something else Hillsborough County – which is the Tampa school district – has: Among its 193,000 students, 57% are from low-income homes. For Charlotte-Mecklenburg, the percentage of low-income students among its 136,000 students is 52%.
For MPS, with 80,000-plus students, the low-income rate is 83%.
Each of the four urban districts that scored the best in fourth-grade reading had a low-income rate of 61% or less. Among the four with the worst results, MPS was the lowest with its 83% rate. Detroit, with the worst scores, was listed in the NAEP report at 87%, Cleveland at 100%, and Fresno, Calif., at 93%.
Two other things:
The chart on the right presents scores for Free and Reduced Lunch Eligible students on the 2011 NAEP 4th grade reading test. Memo to self: remember not to come back as a poor kid in Alaska or DC in the next life. Ten points roughly equals a grade level worth of progress. Low-income kids in Alaska and DC are reading almost as poorly as 1st graders in Massachusetts, which is to say, not much all.
Florida hit a wall in terms of improvement (more on that later), DC saw nice math gains but not much progress in reading, Arizona finally started to move the needle a bit, and it is not entirely isolated to Hispanic children.
The 2009-2011 scores are pretty “meh” so far, and this biggest story I am finding is something big and positive going on with Maryland’s reading scores: 8 point gain for FRL kids between 2009 and 2011, and a nothing to sneeze at five point gain among middle and high income students.
Education think tanks and reformers have been abuzz today with the release of NAEP (National Assessment of Educational Progress) scores — also known as “The Nation’s Report Card.” The biennial release charts student achievement in math and English in fourth and eighth grades. (For an explainer on all things NAEP, go here.) The 2011 stats showed slight improvement in math across both levels, but reading scores among fourth-graders remained stagnant.
NAEP provides us the data, but officials do not surmise causes or reasons for growth – or lack thereof. That’s why we have eduwonks. Here’s what they had to say (in no particular order):
Wisconsin Reading Coalition E-Alert, via a kind Chan Stroman Roll email:
The 4th and 8th grade NAEP reading and math scores were released today. You can view the results at http://nationsreportcard.gov. The presentation webinar is at http://www.nagb.org/reading-math-2011/.
Following is commentary on Wisconsin’s NAEP reading scores that was sent to the Governor’s Read to Lead task force by task force member Steve Dykstra.
2011 NAEP data for reading was released earlier than usual, this year. Under the previous timeline we wouldn’t get the reading data until Spring.
While we returned to our 2007 rank of 25 from our 2009 rank of 30, that is misleading. All of our gains come from modest improvement among Black students who no longer rank last, but are still very near the bottom. The shift in rank is among Wisconsin and a group of states who all perform at an essentially identical level, and have for years. We’re talking tenths of points as the difference.
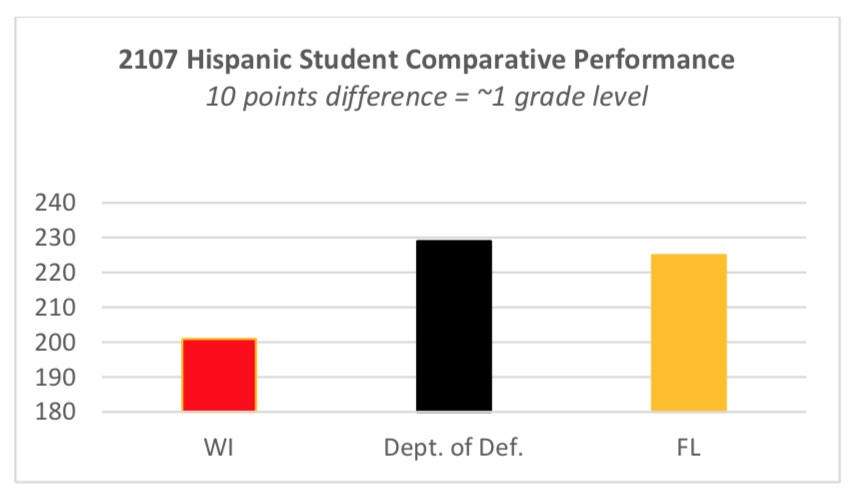
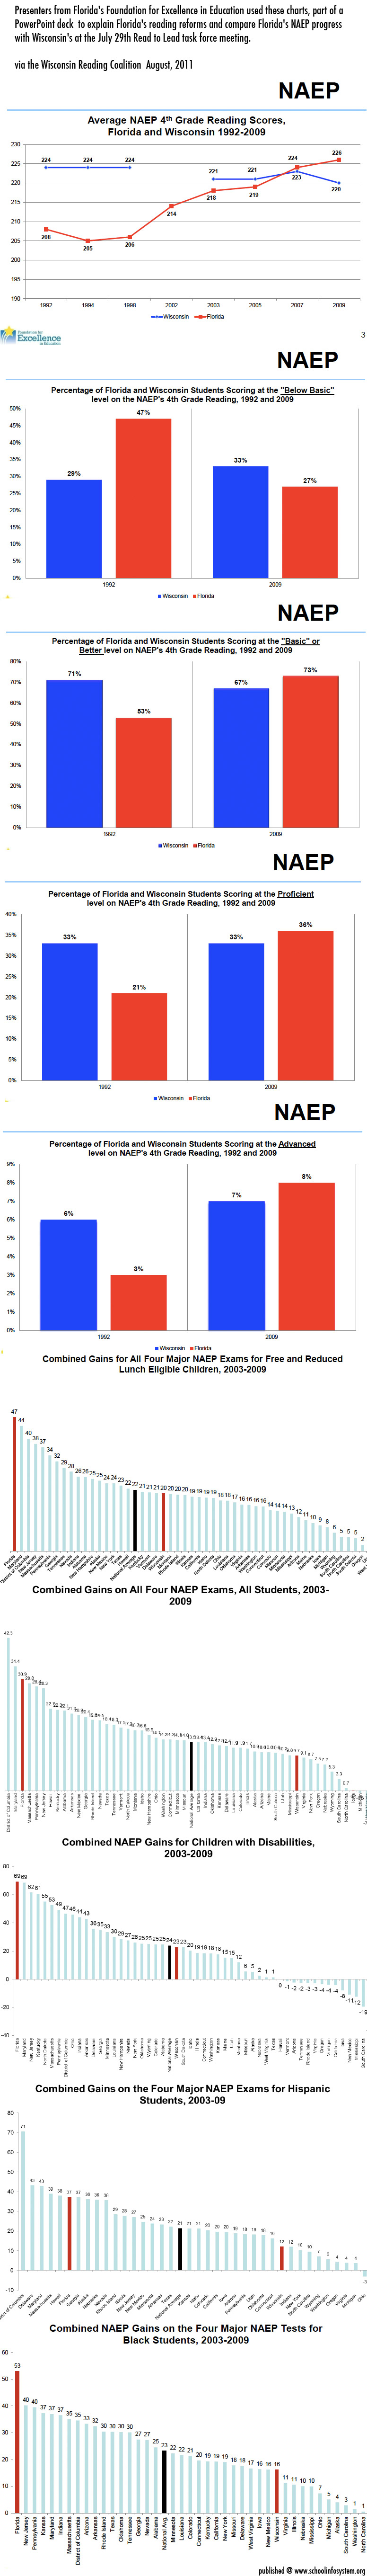
It is always misleading to consider NAEP scores on a whole-state basis. Different states may have very different demographic make-ups and those difference can either exaggerate or mask the actual differences between the two states. For instance, the difference between Florida and Wisconsin (all scores refer to 4th grade reading) at the whole-state level is only 3 points. In reality, the difference is much greater. Demographic variation masks the real difference because Florida has far more minority students and far more poverty than Wisconsin. When we look at the subgroups, comparing apples to apples, we see that the real differences are vast.
When we break the groups down by gender and race, Florida outperforms Wisconsin by a statistically significant margin in every group. The smallest difference is 8 and some are as large as 20. If we break the groups down by race and school lunch status Florida outperforms Wisconsin by a statistically significant margin in every group, except black students who don’t get a free lunch. For that group Florida does better, but not by enough to declare statistical certainty. The smallest margin is 9, and many are at or above 15.
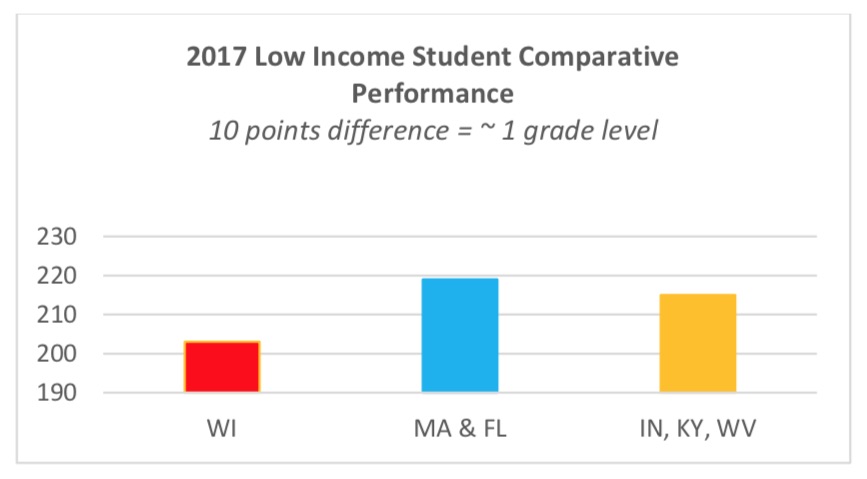
10 points are generally accepted as a grade level for this range of the NAEP. Every Florida subgroup except one exceeds it’s Wisconsin counterpart by a nearly a full grade level, and most by a lot more.
When we compare Wisconsin to Massachusetts the story is the same, only worse. The same groups are significantly different from each other, but the margins are slightly larger. The whole-state difference between Wisconsin and Massachusetts (15+ pts) only appears larger than for Florida because Massachusetts enjoys many of the same demographic advantages as Wisconsin. In fact, Wisconsin students are about the same 1.5 grade levels behind both Florida and Massachusetts for 4th grade reading.
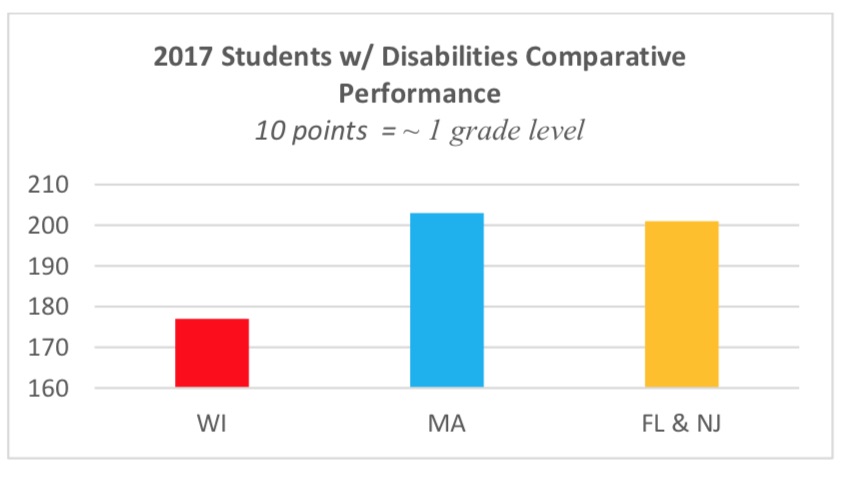
If you want to dig deeper and kick over more rocks, it only gets worse. Every Wisconsin subgroup is below their national average and most are statistically significantly below. The gaps are found in overall scores, as well as for performance categories. We do about the same in terms of advanced students as we do with low performing students. Except for black students who don’t get a free lunch (where the three states are in a virtual dead heat), Wisconsin ranks last compared to Florida and Massachusetts for every subgroup in terms of percentage of students at the advanced level. In many cases the other states exceed our rate by 50-100% or more. Their children have a 50 -100% better chance to read at the advanced level.
We need a sense of urgency to do more than meet, and talk, and discuss. We need to actually change the things that will make a difference, we need to do it fast, and we need to get it right. A lot of what needs to be done can be accomplished in a matter of days. Some of it takes a few hours. The parts that will take longer would benefit from getting the other stuff done and out of the way so we can devote our attention to those long term issues.
Our children are suffering and so far, all we’re doing is talking about it. Shame on us.
Texas Hispanic and African-American students rank
second on eighth-grade NAEP math test
Texas Education Agency:
Texas Hispanic and African-American students earned the second highest score among their peer groups on the 2011 eighth-grade National Assessment of Educational Progress (NAEP) mathematics test. The state’s white eighth grade students ranked fourth, missing out on the second place position themselves by less than one point.
Only Hispanic students in Montana earned a higher scale score on the math test than did eighth-grade Hispanic Texans. Only African-American students in Hawaii earned a higher average score than did their counterparts in Texas.
White students in the District of Columbia earned an average scale score of 319, the highest score for that ethnic group. Texas students ranked fourth, with less than a fraction of a point separating this group from students in Massachusetts and New Jersey. Massachusetts students had the second highest scale score at 304.2876, while Texas received an average score of 303.5460.
Overall, the state ranked 10th among the states with an average scale score of 290, substantially above the national average score of 283.
NAEP math on upward trend, state reading results stable
Wisconsin DPI:
Wisconsin’s biennial mathematics and reading results held steady on the 2011 National Assessment of Educational Progress (NAEP), also known as the Nation’s Report Card. The state’s overall trend in mathematics is improving.
For fourth-grade mathematics, the state’s 2011 scale score was 245, up one point but statistically the same as in 2009, compared to the national scale score of 240, a one-point increase from 2009. Wisconsin results for fourth-grade math are significantly higher than in 2003 when the average scale score was 237. At eighth grade, the Wisconsin scale score for mathematics was 289,
the same as in 2009 and up five points from 2003, which is statistically significant. For the nation, the 2011 mathematics scale score was 283, up one-point from 2009. State average scale scores in mathematics at both grade levels were statistically higher than the national score.
Average scores for fourth grade
| All | White | Black | Hispanic | Asian Amer-Pac.Island | Native Amer | |
|---|---|---|---|---|---|---|
| US | 240 | 249 | 224 | 229 | 256 | 227 |
| Texas | 241 | 253 | 232 | 235 | 263 | *** |
| Wisconsin | 245 | 251 | 217 | 228 | 242 | 231 |
| Average scores for eighth grade | ||||||
| US | 283 | 293 | 262 | 269 | 302 | 266 |
| Texas | 290 | 304 | 277 | 283 | 316 | *** |
| Wisconsin | 289 | 295 | 256 | 270 | 290 | *** |
via a kind Richard Askey email.
Erin Richards has more on Wisconsin’s results.
Steve Dykstra’s comments on Wisconsin’s NAEP reading scores.
Related: Madison and College Station, TX.
US Department of Education, via a kind Chan Stroman email:
State-level National Assessment of Educational Progress (NAEP) results are an important resource for policymakers and other stakeholders responsible for making sense of and acting on state assessment results. Since 2003, the National Center for Education Statistics (NCES) has supported research that focuses on comparing NAEP and state proficiency standards. By showing where states’ standards lie on the NAEP scale, the mapping analyses offer several important contributions. First, they allow each state to compare the stringency of its criteria for proficiency with that of other states.
Second, mapping analyses inform a state whether the rigor of its standards, as represented by the NAEP scale equivalent of the state’s standard, changed over time. (A state’s NAEP scale equivalent is the score on the NAEP scale at which the percentage of students in a state’s NAEP sample who score at or above that value matches the percentage of students in the state who score proficient or higher on the state assessment.) Significant differences in NAEP scale equivalents might reflect changes in state assessments and standards or changes in policies or practices that occurred between the years. Finally, when key aspects of a state’s assessment or standards remain the same, these mapping analyses allow NAEP to substantiate state-reported changes in student achievement.
The following are the research questions and the key findings regarding state proficiency standards, as they are measured on the NAEP scale.
Wisconsin’s oft criticized WKCE vis a vis NAEP:
WKCE “proficient” = 2009 NAEP Below Basic for grade 4 reading (along with 34 other states) and grade 8 reading (along with 15 other states)
= 2009 NAEP Basic for grade 4 math (along with 41 other states) and grade 8 (along with 35 other states)
WKCE results showed more positive changes than NAEP results for grade 4
reading from 2007 to 2009, grade 4 math from 2007 to 2009, and grade 4 math from 2005 to 2009
NAEP results showed more positive changes than WKCE results in grade 8
reading from 2005 to 2009.
How does Wisconsin compare? Learn more, here.
Excellence in Education’s PowerPoint presentation: 1MB PDF, via a kind Julie Gocey email.
Related links: Video: Governor’s “Read to Lead” Task Force Meeting.
Wisconsin Reading Coalition.
Much more on Wisconsin’s Read To Lead Task Force, here.
How does Wisconsin compare? Learn more at www.wisconsin2.org
Even as schools aim to better prepare students for a global work force, fewer than one in three American students are proficient in geography, with most eighth graders unable to explain what causes earthquakes or accurately describe the American Southwest, according to a report released Tuesday morning.
Over all, high school seniors demonstrated the least proficiency on a 2010 test, the National Assessment of Educational Progress, also known as the nation’s geography report card, with 20 percent found to be proficient or better, compared with 27 percent of eighth graders and 21 percent of fourth graders.
The average test score for 12th graders declined to 282 (on a scale of 500) from 284 in 2001 when the test was last given. It remained essentially unchanged for eighth graders during that period, though there were gains among the lowest-performing students. Fourth graders had the largest gains, with the average score rising to 213, up five points from 2001.
Wisconsin Reading Coalition, via a kind reader’s email:
Wisconsin’s performance on the reading portion of the National Assessment of Educational Progress (NAEP) is simply unacceptable and unnecessary. Click here to view a summary of the results. Click here for more statistics.
4/25/2011 meeting agenda:
A general and detailed agenda for the April 25th meeting of the Governor’s Read to Lead task force have been released. We feel the important topics in reading reform can be addressed through this agenda.
General:
Introductions
Welcome and opening remarks by Governor Walker on the mission of the Task Force.
A discussion of the current state of reading achievement in Wisconsin
A discussion of current practices as well as ways to improve reading instruction at the classroom level in Wisconsin
A discussion of future topics and future meeting dates.
Adjournment
Detailed:
I. Identifying the problem and its root causes.
A. An overview of the problem in Wisconsin
B. What are the some of the root causes of illiteracy?
1. Teaching methods and curriculum
2. Teacher training and professional development
3. Problematic interventions
4. Societal problems
5. Lack of accountability
6. Others?
C. Why are we doing so much worse than many other states and so much worse, relative to other states, than we did in the past?
II. Reading instruction
A. How are children typically taught to read in Wisconsin schools?
B. How do early childhood programs fit into the equation?
C. How might reading instruction be improved?
D. How do these methods and curricula differ with ELL & special needs students?
E. How quickly could improved reading instruction be implemented?
The attached fact sheet of NAEP scores (PDF), assembled with the assistance of task force and WRC member Steve Dykstra, was attached to the detailed agenda.
————
Governor Walker’s blue ribbon task force, Read to Lead, will have its first meeting on Monday, April 25, 2011, from 9:00 AM to 11:00 AM. The meeting will be held in the Governor’s conference room, 115 East, in the State Capitol. All meetings are open to the public. In addition, WRC will prepare reports on the progress of the task force to send as E-Alerts and post on our website, www.wisconsinreadingcoalition.org. Questions on the task force can be addressed to Kimber Liedl or Michael Brickman in the Governor’s office at 608-267-9096.
In preparation for the meeting, the Governor’s office made this comment:
“As the Milwaukee Journal Sentinel’s education columnist observed on Sunday, “[t]his is not your ordinary task force.” The creation of this task force is an opportunity to improve reading instruction and achievement in our state in an effort to open new opportunities for thousands of children. The MJS also noted that our task force “has diversity of opinion.” This is by design. Governor Walker is not looking for a rubber stamp, but for a robust, yet focused, conversation that will ultimately lead to concrete policy solutions.”
Related: Dave Baskerville: Wisconsin Needs Two Big Goals. (video)
More students – but still not enough – are taking a rigorous course load, according to the NAEP report card from The National Assessment of Educational Progress, released Wednesday.
American high-schoolers are earning more credits and taking more challenging courses than they did 20 years ago, according to a new study of high school transcripts. But education experts still worry that not enough of them are graduating ready to enter college or get on track for science- and math-based careers.
Almost twice as many students completed at least a standard curriculum in 2009 as in 1990, the report shows. Curricular rigor improved for students across racial and ethnic groups, but significant gaps still remain.
The economic future of the country depends on improving education, and “the message [of this study] is that rigor works,” says Bob Wise, president of Alliance for Excellent Education in Washington, which advocates for improving high schools. “But it puts an obligation on all of us to be sure we’re not only providing rigorous courses, but also the support students need to succeed in them.”
But the Department of Public Instruction (DPI) is questioning the legality of Walker’s proposal to fund the program through the Department of Administration.
Walker has proposed spending $600,000 in each of the next two years to implement recommendations of a new task force appointed by Walker that would develop a third-grade reading test. Walker noted Wisconsin’s performance on a national fourth-grade reading exam has fallen from third out of 39 states in 1994 to 30th out of 50 states in 2009.
“From kindergarten to third grade, our kids learn to read, and then from third grade on, they use reading to learn,” Walker said in his budget address. “We need to make sure every child can read as they move on from third grade.”
Related:
Wisconsin DPI, via a kind reader’s email:
cience scores for Wisconsin students exceeded the national average on the National Assessment of Educational Progress (NAEP) science assessment, administered between January and March of 2009.
The state’s scale scores on the assessments were 157 at both fourth and eighth grades, eight points higher than the national scale scores of 149 for both grades. In state-by-state comparisons, Wisconsin’s results at fourth grade were higher than those in 27 states, not significantly different from those in 12 states, and lower than seven states. At eighth grade, Wisconsin’s results were higher than 27 states, not significantly different than 14 states, and lower than five states.
Today I am releasing the 2009 National Assessment of Educational Progress science results.
Students were assessed at the fourth, eighth, and twelfth grades. Over 156,000 students at grade 4, 151,000 at grade 8, and 11,000 at grade 12 took the assessment. We have national results for public and private school students at all three grades. At grades 4 and 8, we also have results for public school students in 46 states and the Department of Defense schools. The state samples were combined and augmented with sampled students from the four non-participating states plus the District of Columbia, along with a national sample of private school students, to create the full national samples for grades 4 and 8. The twelfth-grade sample is smaller because there are no state-representative samples at that grade.
WEAC statement.
NCES state profiles.
Richard Askey on 12th Grade NAEP Results.
http://www.math.wisc.edu/~askey/
Much more on 12th grade NAEP results here.
High school seniors in Massachusetts are ranked highest in the nation in reading and math ability, according to new test results from the National Assessment of Educational Progress.
The first state-specific results for Grade 12 in 2009 showed that Massachusetts students had the highest scaled score in both the reading and math exams. The Bay State was one of 11 states to participate in the pilot program for states to receive state-specific Grade 12 results.
In a ceremony at Medford High School, Governor Deval Patrick, surrounded by state education officials and hundreds of students, heralded the results as proof of the state’s position as a leader in public education.
State and local tax burdens vary greatly from state to state. New Hampshire, for instance, has no income or sales tax — but its neighbor Vermont has both. Fiscal conservatives say New Hampshire’s long history of low taxes has forced the state to keep spending in line. But New Hampshire residents say that tradition of fiscal austerity has exacted a price on the state’s schools.
NAEP 4th grade average math scale score: New Hampshire: 251; Wisconsin 244; Vermont 248, Massachusetts 252, Minnesota 249, Iowa 243. Low income: New Hampshire: 237; Wisconsin 229; Vermont 235, Massachusetts 237, Minnesota 234, Iowa 232.
NAEP 4th grade average reading scale score (national average is 220): New Hampshire: 229; Wisconsin 220; Vermont 229, Massachusetts 234, Minnesota 223, Iowa 221. Low income (national average is 206): New Hampshire: 213; Wisconsin 202; Vermont 215, Massachusetts 215, Minnesota 203, Iowa 208.
NAEP 8th grade average reading scale score (national average is 262): New Hampshire: 271; Wisconsin 266; Vermont 272, Massachusetts 274, Minnesota 271, Iowa 265. Low income (national average is 249): New Hampshire: 257; Wisconsin 249; Vermont 260, Massachusetts 254, Minnesota 252, Iowa 253.
NAEP 2005 Science Assessment is here
As Chad Aldeman pointed out at the Quick and the Ed, many major newspapers missed the story on the recent National Assessment of Educational Progress scores. The New York Times bemoaned that fourth-grade reading scores have barely increased since the early 1990s.
Aldeman pointed out that reading scores look somewhat better if you separate the data by race, as shown here.
The latest scorecard gauging how well Wisconsin’s students read compared with their classmates in other states showed little change from previous years, but the rest of the nation’s fourth-graders have been catching up and Wisconsin’s black students now rank behind those in every other state.
“Holding steady is not good enough,” state schools Superintendent Tony Evers said about the results. “Despite increasing poverty that has a negative impact on student learning, we must do more to improve the reading achievement of all students in Wisconsin.”
Fourth-graders in Wisconsin posted an average score of 220 on the 500-point reading test administered in 2009 as part of the National Assessment of Educational Progress, also known as the nation’s report card. That represented a three-point drop from two years before and translated to a 33% proficiency rate.
It also matched the national average score for fourth-graders. In 1994, Wisconsin students bested the nation’s fourth-grade average by 12 points.
Scores for most districts higher than in 2003, but few make gains since 2007
Representative samples of fourth- and eighth-grade public school students from 18 urban districts participated in the 2009 assessment. Eleven of the districts also participated in the 2007 assessment, and 10 participated in 2003. Between 1,800 and 4,300 fourth- and eighth-graders were assessed in each district.
- In comparison to 2007, average mathematics scores for students in large cities increased in 2009 at both grades 4 and 8; however, only two participating districts at each grade showed gains.
- Scores were higher in 2009 for Boston and the District of Columbia at grade 4, and for Austin and San Diego at grade 8.
- No districts showed a decline in scores at either grade.
- In comparison to 2003, scores for students in large cities were higher in 2009 at both grades 4 and 8.
- Increases in scores were also seen across most urban districts that participated in both years, except in Charlotte at grade 4 and in Cleveland at grades 4 and 8, where there were no significant changes.
Complete 13MB pdf report can be found here.
The 2009 state NAEP math results were released today, and they’re disappointing. Fourth grade scores, which have been a great and under-recognized success story over the last two decades, were flat. Eighth grade scores rose slightly. What to conclude? Most broadly, that most of the claims about national education policy, pro and con, have been overwrought.
Supporters of the No Child Left Behind Act-and I’ve generally been one of them-hoped that the law would catalyze a major upward move in student achievement. That hasn’t happened. Perhaps it’s because every state got to choose its own standards; perhaps it’s because the law did little to get better teachers in classrooms; perhaps it’s because yawning revenue disparities between and within states were largely unaddressed. Whatever was missing, something was missing, probably many things, and the next version of ESEA will need significant changes if we want to achieve more than just more of the same.
Freedom Kentucky, via a kind reader’s email:
The NAEP is a federally administered academic testing program for school systems throughout the nation. NAEP documents often refer to the assessments as “The Nation’s Report Card”.
The NAEP has been of considerable interest in many states, including Kentucky, as it generally offers the only state-to-state comparisions available for fourth and eighth grade academic performance. However, there are often considerable problems involved with making these comparisons, as discussed below.
The NAEP is operated by the US Department of Education at the direction of the Congress. It is administered by the National Center for Education Statistics. Since 1988, NAEP policy has been determined by the congressionally created non-partisan National Assessment Governing Board.
Over the years the NAEP has periodically assessed various academic areas.
The NAEP began in 1969 as a strictly nation-wide test, prohibited by law from producing scores for either individual states or local school jurisdictions. The testing samples were drawn from across the entire nation in such a way that the results would actually provide invalid scores even if the students from each state could be separately identified. In succeeding years, more testing has been added to cover both state level results and, most recently, results for some of the nation’s largest urban school districts.
An Interview with Will Fitzhugh: About Assessing Writing EdNews.org Houston, Texas, 24 January 2007
Michael F. Shaughnessy Senior Columnist EdNews.org:
1) I understand that you have just finished a stint on the ACT/NAGB Steering Committee for the 2011 NAEP (National Assessment of Educational Progress) Writing Assessment. What was that like? (And what does NAGB stand for?)
WF: NAGB is the National Assessment Governing Board, which runs the NAEP, “America’s Report Card,” as they say. I was glad that Diane Ravitch recommended me for the Steering Committee for the new national writing assessment scheduled for 2011. I was very impressed with the intelligence and competence of Mary Crovo, representing NAEP, and Rosanne Cook, who is running the project for American College Testing. Many people on the Committee were from the National Council of Teachers of English and the College Composition world, which have little interest in having students read history books or write history research papers. In fact that world favors, or has favored in the past, personal and creative writing and the five-paragraph essay, which do a terrible job of preparing high school students for the nonfiction books and the academic term papers most will be asked to cope with in college.
2) Given the paucity of writing that goes on in the high schools of America, is it really fair to ask high school students to engage in a robust writing assessment?
WF: It would not be fair to ask high school students to play in a football game if they hadn’t had an opportunity for lots of practice, and it is very hard to ask high school students to do the sort of academic expository writing they should be doing if they have never done it in all their years in school. But we need to start somewhere. Every high school student does not need to be able to play football, but they all need to be able to read nonfiction books and write serious term papers.
3) On the other hand, since so much of the college experience is writing, are high school teachers doing students a disservice by NOT requiring more writing?
WF: High school teachers would make terrible football coaches and their teams would lose most if not all of their games, if the teacher/coaches did not have time to practice their teams. We take football seriously, and we take band seriously, so ample time and money are made available to produce the best teams and the best bands the high school can manage. We allow really no time for a public high school teacher to work with students on heavy-duty term papers. We don’t make time for them, because we don’t think they are that important. Not as important as drama practice, yearbook, chorus, debate or a host of other activities. As a result our high school students are, once again, ill-prepared for college reading and writing. AP courses in history do not require, in most cases, that students read a complete nonfiction book, and most of the AP teachers say they don’t have time to ask the student to write a research paper, because they “have to get students ready for the AP Exam.”
“The Nation’s Report Card” is going to start giving grades for Milwaukee Public Schools.
Milwaukee was named Thursday as one of seven urban school districts that will join the testing program of the National Assessment of Education Progress. NAEP is the closest thing to a nationwide testing program at levels below college admission tests. The government-funded organization that runs NAEP has trade-marked the “Nation’s Report Card” label for the program.
NAEP results released last week showed that Wisconsin eighth-graders were doing a bit better than the nation in writing skills, but that among African-Americans students, Wisconsin had the lowest scores in the United States and the second-widest gap between white and black kids in the nation.
There were no results for Milwaukee specifically in that round of testing, or in earlier tests that showed huge gaps in Wisconsin between white and black students in reading and math.
The National Assessment of Educational Progress (NAEP) released its 2007 eighth-grade writing scores today. These scores have particular significance to Texas because we are engaged in an intense battle over the rewrite of the English / Language Arts / Reading standards.
One side, the Coalition made up of eleven organizations with ties to NCTE and other national organizations, has joined up with the bilingual organizations to impede progress toward changing the way our state teaches students how to read, write, and speak English.
By looking at the NAEP writing results below, it is obvious that Texas needs to change the status quo. Anyone can see that the way English is being taught right now is simply not working.
Those of us who want change are strongly advocating that students need to be taught explicit grammar, spelling, punctuation, and capitalization so that they will have a strong foundation upon which to build good writing skills.
In the new ELAR standards, our side wants to have a separate strand for oral and written conventions so that these skills will be emphasized among our Texas students.
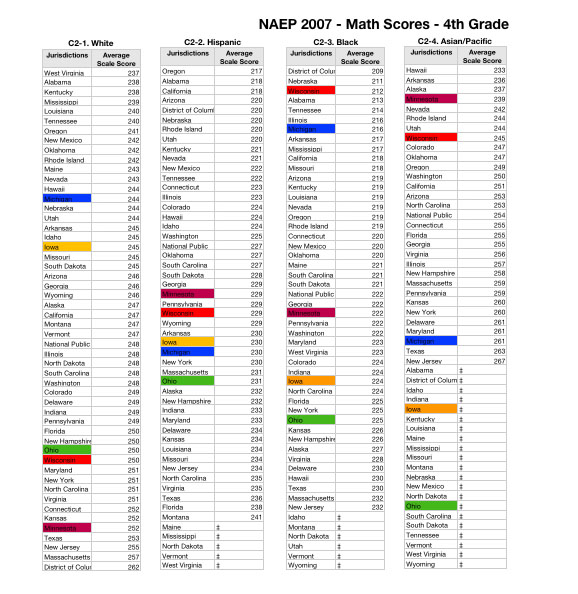
The NAEP 2007 reports leave me without real understanding of the results, and charts included in the reports do not help. Looking at the state and ethnic data in a slightly different but very simple way, information that seemed to be lacking in the official reports stand out.
For the first steps, we’ll look at only the 4th grade math scores by state.
The following is the state (jurisdiction) data by ethnic groups which I will use throughout. I’ve highlighted several of our neighboring states: Wisconsin in red, Michigan in blue, Iowa in yellow, Ohio in green, Minnesota in lavendar.
Using a simple 2-level stem and leaf plot shows a general skewed normal (bell curve) distribution for each ethnic group. Scores of the states mentioned above are in a larger font, with Wisconsin further in red. The stem portion of this chart consists of the first two digits of a state’s score (with a – or =), and the leaves are the final digit. A stem ending with – will have final digits of 0-4, a stem ending with = are for scores ending with 5-9.
The Hispanic score seems bi-modal, with the White distribution showing a slight tail on the high side, Blacks and Asian distribution showing low end tails. Asian scores show a definite tendency to score on the high end of states scores, while white scores are definitely skewed to the low end. What can be seen here also, but subtly, is there does not seem to be an overlap of the aggregated state scores for whites and blacks. For Blacks in Wisconsin generally, the chart visually represents the quality of education Wisconsin they are receiving here — very poor.
Of course, this says nothing about how well individual students did on the test — aggregation hides most information that is necessary to make data-driven decisions.
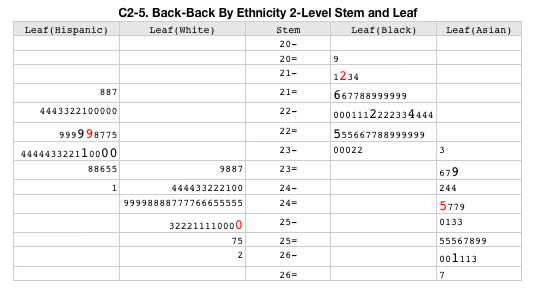
We need to spread out this chart’s distributions to detect other interesting facts.
In this 5-level stem and leaf chart, the stem values end with the symbols -, t, f, s, =, where the – bin is for scores ending with 0 or 1, t for 2 and 3, f for 4 and 5, s for 6 and 7, = for 8 and 9.
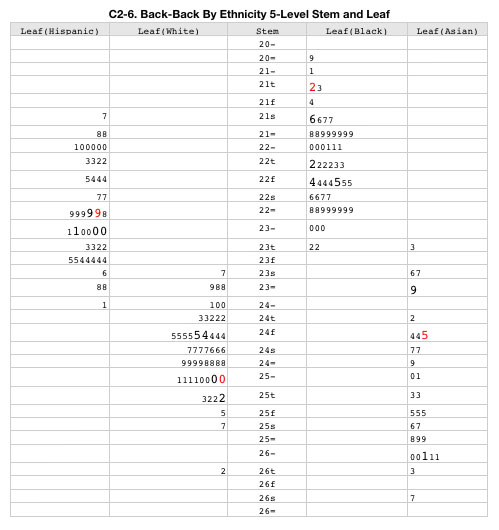
Now we can see most definitely that the distributions for blacks and whites do not overlap, that Wisconsin Black scores are way out in the tail of the distribution. Looking at the extremes of these distributions show surprising results (at least to me). Notice that DC whites score at the top and might be statistical outliers, while DC Blacks are at the opposite end and also may be statistical outliers, and the NJ Asians are at the top, but unlikely to be outliers due to the wide spread of their state average scores. (Outliers are points that are numerically distant from the main distribution).
The DC results by ethnicity for whites was surprising. Looking only at the state scores without separating by ethnicity, the distribution of points look like:
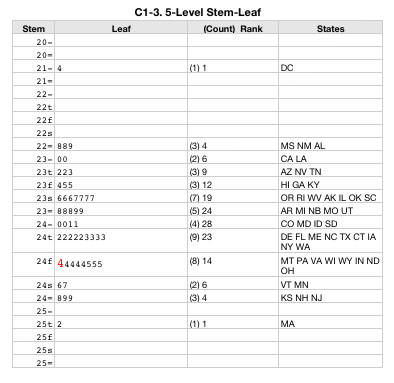
A separate calculation shows that indeed, DC is an outlier when ethnicity is ignored and is only 2 points away from being an extreme outlier. (The outlier cut-score is 224 and the extreme outlier cut-score is 212, DC score is 214).
Going back to the disaggregation by ethnicity the summary calculations are
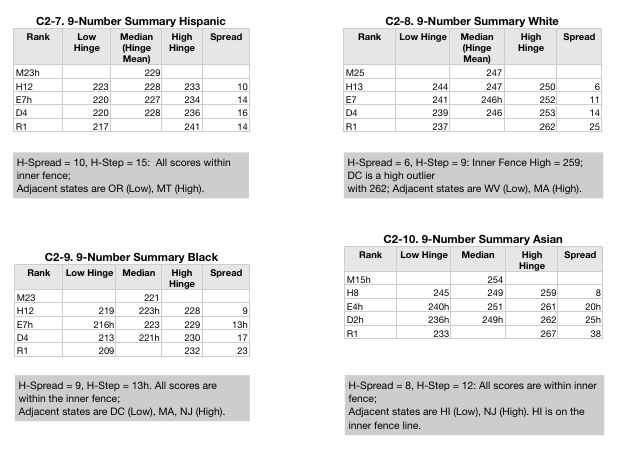
The 9-Number Summaries are used to calculate outliers, and determine drift in the distributions. Each row of the summary table is a kind of percentile. Line M is the median, H represents the low and high 25%, E is the low and high 12.5%, D is the 6.25% cut point, and R represents the range lowest and highest values. (The numbers following these letter designations are the score rank at these cut points).
With a score of 212, Wisconsin Blacks score in the lower 6% of the states (D4 is 213) but this score does not make it an outlier, but that is hardly a badge of honor given how poorly all states are doing. Wisconsin Hispanics score at the median of all Hispanics with a score of 229, and Wisconsin Asians score on the cusp of the lower 25% of all Asians at 245, and Wisconsin whites score on the cusp of the upper 25% of all whites at 250.
The drift calculations (in the Median column) do not show distribution drift, but outlier calculations do show that DC whites are high-end outliers. (A little preview of the NAEP 8th grade math: NAEP numbers show that there was not enough whites in DC public schools by 8th grade to be measured — in our nation’s capital, the public schools are fully segregated?)
Surprisingly, Hawaii (HI) in the Asian category is on the cusp of being an outlier at the low end with a state score of 233.
The HI score was surprising to me since it has a very large Asian/Pacific Islander population, and I expected this ethic group to have the political power to ensure schools would function for them. However, further reading indicates that whites are the upper class and have the power, followed by people of Chinese descent. The rest, native Hawaiians, Japanese, and other Pacific Islander groups are at the bottom of the power and wealth hierarchy. Without a better ethnic categorization, the NAEP test will not show the likely educational imbalance among franchised and disenfranchised.
Continuing with the Asian/Pacific Islander category, I was surprised to see NJ as the top state. At 267, NJ is not an outlier (the cut point is 271), but it is close. An improvement of 1/3 grade level (assuming 12 points separates one grade from the next), would bring them to high-end outlier status.
Looking at the scores for Wisconsin Blacks, it’s quite clear that Wisconsin (Milwaukee schools primarily?) are doing very poorly for Blacks. It’s not just a matter of how the scores rank among states, but how Wisconsin fits within the distribution of all states. The data above shows not only low rank but Wisconsin Blacks are educated with far below the efforts of other states, represented by the main body of the distribution.
THE release this week of national test scores in reading and math was an embarrassment for the state Department of Education. Scores nationally and in many individual states showed modest gains from 2005 to 2007, but New York did not – even though the Education Department had trumpeted “gains” on its tests just weeks earlier.
The federally sponsored National Assessment of Educational Progress (NAEP) is known in the education world as the gold standard of testing. In 2002, Congress authorized NAEP testing in every state to serve as a check of the states’ own claims about their progress. (Congress rightly worried that individual states would dumb-down tests that they themselves develop and administer.)
Just a few months ago, the state Education Department celebrated large gains for eighth-grade students in both reading and math. In May and June, The New York Times ran front-page stories heralding major improvements in the state test scores for eighth-graders: “Eighth Graders Show Big Gain in Reading Test” and “City Students Lead Big Rise on Math Tests.”
In grade 8, the Education Department reported, the share of students meeting state reading standards jumped from 49.3 percent to 57 percent – a remarkable single-year rise, especially in a grade where academic performance had stagnated for several years. Similarly, the portion of eighth-graders meeting state math standards jumped from 53.9 percent to 58.8 percent.
These are very impressive gains. Unfortunately, they all failed to show up in the NAEP results (a fact the Times mentioned not on its front page but at the end of a story on page A20).
The 2007 NAEP results have just been released. There are many interesting results one can learn by looking at this data. In addition to the very serious racial gap in Wisconsin which has been commented on by The Educational Trust [Grade 4 Math NAEP Analysis | 80K PDF ] [Grade 8 Math NAEP Analysis | 80K PDF] and the Wisconsin Department of Public Instruction [172K PDF], there are strong indications of other problems in mathematics education in Wisconsin. Consider the following data comparing results for whites and blacks in Ohio and Wisconsin from the first year NAEP results were given by states and the 2007 results. As background, 12 points on NAEP is generally thought to be about the change from one year to the next on a given test. This is not a good estimate when looking over 15 to 17 years, since part of the rise in the test score likely came from changes made in textbooks and in what teachers teach because of the change in the NAEP Framework in the early 1990s.
For example, in Trends in Mathematics and Science Study, TIMSS, fourth grade math was tested in 1995 and 2003, and the results were flat while the NAEP results went up enough to allow statisticians to conclude the increase was statistically significant.
I assume that some of the rise in NAEP over this period is because students are learning more about the topics covered in NAEP, but that this is not the only
reason for the rise in NAEP scores.
The data below is comparison data between the results in two states at two different years, so the point estimate for a year of schooling seems to be a reasonable guideline. If so, Wisconsin has lost about a year to Ohio. Something needs to be done about this.
| NAEP Fourth Grade Mathematics | |||
| Whites | 1992 | 2007 | |
| Wisconsin | 233 | 250 | |
| Ohio | 222 | 250 | Ohio gained 11 points on Wisconsin |
| Blacks | 1992 | 2007 | |
| Wisconsin | 195 | 212 | |
| Ohio | 194 | 225 | Ohio gained 14 points on Wisconsin |
| NAEP Eighth Grade Mathematics | |||
| Whites | 1990 | 2007 | |
| Wisconsin | 279 | 292 | |
| Ohio | 268 | 291 | Ohio gained 10 points on Wisconsin |
| Blacks | 1990 | 2007 | |
| Wisconsin | 236 | 247 | |
| Ohio | 233 | 258 | Ohio gained 14 points on Wisconsin |
The Nation’s Report Card via Ed Week:
The proportion of high school students completing a solid core curriculum has nearly doubled since 1990, and students are doing better in their classes than their predecessors did.
But that good news is tempered by other findings in two federal reports released here today. The performance of the nation’s high school seniors on national tests has declined in reading over the past decade, and students are lackluster in mathematics. A third of high school graduates in 2005 did not complete a standard curriculum, which includes four credits of English and three credits each of social studies, math, and science.
The 12th grade reading and math results on the National Assessment of Educational Progress are based on a nationally representative sample of 21,000 seniors at 900 public and private schools who took the tests between January and March of 2005. The report on their performance was accompanied by the latest NAEP transcript study, which analyzes the coursetaking patterns and achievement of high school graduates.
Two-thirds of the 26,000 graduates who were followed for the transcript study also participated in the 2005 NAEP math and science assessments.
No Improvement in Reading
On the reading test, 12th graders’ average score has declined significantly since the first time the test was given in 1992. The test-takers averaged 286 points on a 500-point scale, a 6-point decline over 13 years, but statistically the same score as in 2002. Achievement levels in reading have also declined since 1992; 80 percent of the students tested that year scored at the “basic” level or better, but only 73 percent did so on the 2005 test, the same proportion as in 2002. In addition, the gap in scores between members of minority groups and higher-scoring white students has not narrowed significantly.
In math, the scores are not comparable with those from previous tests since the 2005 test was based on a new framework. Students scored, on average, 150 points on a 300-point scale. Just 61 percent of the 12th graders demonstrated at least basic command of the subject, with 23 percent considered “proficient” and 2 percent “advanced.”
Among 2005 high school graduates, 68 percent completed at least a standard curriculum, while 41 percent took a more challenging course load, and 10 percent took more-rigorous classes. In 1990, just 40 percent of graduates completed at least a standard curriculum, and 36 percent took additional courses, while 5 percent took what was deemed a rigorous course load.
he board that sets policy for the National Assessment of Educational Progress has revised the blueprint for the 12th grade mathematics version of the influential exam, in an attempt to make the test better reflect the skills that students need for college and highly skilled jobs.
The changes, approved Aug. 4, are expected to make the math test more challenging in some areas, through the addition of more-complex algebraic concepts, trigonometry, and a stronger emphasis on mathematical reasoning and problem-solving, officials associated with the board say. Those revisions could also shape individual states’ math standards, which are often influenced by the content of the NAEP frameworks.
The National Assessment Governing Board, the independent entity that directs NAEP, unanimously agreed to make the changes at its quarterly meeting here. The board has spent about two years on the project.
“What we’re doing here is not unique to NAEP. It is what society is demanding,” said Sharif M. Shakrani, a professor of psychometric testing at Michigan State University in East Lansing, who consulted on changes to the framework. “We need to judge what students know and where they are weak.”
Mike Antonucci on the recent Education Department report comparing private and public school math and reading scores:
If I read the wonderfully titled report Comparing Private Schools and Public Schools Using Hierarchical Linear Modeling correctly, there is virtually no difference between the math and reading test scores of public and private school students when corrected for various characteristics of students, teachers and schools.
This is bad news for private schools (and when the same results exist for charters, for them as well). If you are going to sell yourself as the superior alternative to traditional public schools, you have to produce results. Reading and math scores on the NAEP tests are excellent measures of academic results, though — as my friends at NEA and AFT always tell me — not the only measures.
National Education Association President Reg Weaver was correct when he told the New York Times that had the results been different, “there would have been press conferences and glowing statements about private schools.”
Where Reg went wrong, however, was when he said that the results showed public schools were “doing an outstanding job.” Standardized test scores are the measures used by the bad guys — you know, people like me — to evaluate schools. What about all the measures the unions claim are important?
Private schools spend about two-thirds what public schools spend.
A reform effort launched by Charlotte-Mecklenburg in the late 1990s focused on shifting more district funds to low-performing schools from schools that were doing better — a move that has lately created some backlash. The district also reduced class sizes in those schools and offered to pay graduate-school tuition for teachers who agreed to work in those schools for at least two years. The district also required all of its elementary schools to adhere to a strict, phonics-based reading program.
And it brought more learning-disabled students back into mainstream classrooms and paired up teachers who had been teaching them separately. Now, “you have a great combination of teachers who are very, very versed in reading and teachers who are very, very versed in additional learning strategies,” says Frances Haithcock, the district’s interim superintendent.
2005 National and State Mathematics and Reading Assessments for grades 4 and 8 are now available.
Robert Tomsho takes a look at the reading results:
Observers say boosting reading scores isn’t likely to get any easier, given the rapidly changing demographics in the nation’s schools where, for many students, English is a second language. Indeed, English was a second language for 10% of the fourth graders who took the NAEP reading test this year, up from 3% in 1992.
The lack of progress may also reflect divisions in the philosophy of how reading should be taught. Educators and political partisans have waged a long and sometimes bitter battle over how to handle the subject, as conservatives championing basic phonics-based teaching have clashed with liberal backers of “whole language,” which revolves around making English instruction exciting by reading stories.
Beginning sometime after 2000, there was growing concern that many students had difficulty with reading. When comparing reading scores on the National Assessment of Educational Progress (NAEP) among states, Massachusetts stood out. Suddenly, that state’s reading and math scores jumped.
Massachusetts’ scores (shown in yellow in the graph below) started the late 1990s looking similar to Wisconsin’s, but then enjoyed a substantial jump. By contrast, Wisconsin scores (shown in gray) were largely flat or decreasing and were eventually joined by the average national scores.
What accounted for the jump in Massachusetts’ scores? That state decided to replace whole language (currently called “balanced literacy”) with a program that was based on research into the science of learning to read. Children learning to read were taught to sound out the parts of unknown words (called phonemes) and then combine these parts to sound out the whole word.
To enforce this change, the state designed a test for aspiring teachers to assess their knowledge of the research on the process of learning to read.
As the next graph shows, Milwaukee Public Schools made little or no progress during the last two decades. Scores were also flat during this period, indicating that many of its students were struggling with reading. They also trailed the average scores for big cities in the nation.
——
Legislation and Reading: The Wisconsin Experience 2004-
“Well, it’s kind of too bad that we’ve got the smartest people at our universities, and yet we have to create a law to tell them how to teach.”
The data clearly indicate that being able to read is not a requirement for graduation at (Madison) East, especially if you are black or Hispanic”
My Question to Wisconsin Governor Tony Evers on Teacher Mulligans and our Disastrous Reading Results
2017: West High Reading Interventionist Teacher’s Remarks to the School Board on Madison’s Disastrous Reading Results
Madison’s taxpayer supported K-12 school district, despite spending far more than most, has long tolerated disastrous reading results.
“An emphasis on adult employment”
Wisconsin Public Policy Forum Madison School District Report[PDF]
WEAC: $1.57 million for Four Wisconsin Senators
Friday Afternoon Veto: Governor Evers Rejects AB446/SB454; an effort to address our long term, disastrous reading results
Booked, but can’t read (Madison): functional literacy, National citizenship and the new face of Dred Scott in the age of mass incarceration.
When A Stands for Average: Students at the UW-Madison School of Education Receive Sky-High Grades. How Smart is That?
With low reading proficiency scores across the state, USA TODAY NETWORK-Wisconsin is exploring the causes and consequences of low literacy. This article is part of the By the Book series, which examines reading curriculum, instructional methods and solutions in K-12 education to answer the questions: Why do so many Wisconsin kids struggle to read, and what can be done about it?
To read other stories in the series, click here.
Wisconsin’s Joint Committee on Finance approved Monday a list of four reading curricula schools can adopt to be in compliance with the state’s new reading law, Act 20. The curricula approved are those recommended by the state’s Early Literacy Curriculum Council, a nine-member council created to specifically evaluate K-3 reading curriculums for their compliance with Act 20.
The four curricula approved are:
Act 20, signed into law last summer, requires curriculum to be backed by the “science of reading”: a decades-old body of research that explains how the brain learns to read. It includes an emphasis on phonics, which teaches students the sounds letters make and how those sounds combine in predictable patterns to form words.
The law’s changes are aimed at improving reading proficiency in the state, which has been low for years. Fewer than half of students at the state’s five largest school districts are considered proficient in reading, according to state exam scores since 2018.
Part of the law’s revamping of reading instruction requires schools to use specific instructional methods that are systemic and explicit by next school year. This instruction must include fluency, phonological awareness, phonemic awareness, phonics, oral language development, vocabulary, writing, comprehension and building background knowledge.
Earlier: Legislation and Literacy: Wisconsin Early Reading Curriculum Selection
——
Legislation and Reading: The Wisconsin Experience 2004-
Underly and our long term disastrous reading results….
WEAC: $1.57 million for Four Wisconsin Senators
Legislation and Reading: The Wisconsin Experience 2004-
“Well, it’s kind of too bad that we’ve got the smartest people at our universities, and yet we have to create a law to tell them how to teach.”
The data clearly indicate that being able to read is not a requirement for graduation at (Madison) East, especially if you are black or Hispanic”
My Question to Wisconsin Governor Tony Evers on Teacher Mulligans and our Disastrous Reading Results
2017: West High Reading Interventionist Teacher’s Remarks to the School Board on Madison’s Disastrous Reading Results
Madison’s taxpayer supported K-12 school district, despite spending far more than most, has long tolerated disastrous reading results.
“An emphasis on adult employment”
Wisconsin Public Policy Forum Madison School District Report[PDF]
WEAC: $1.57 million for Four Wisconsin Senators
Friday Afternoon Veto: Governor Evers Rejects AB446/SB454; an effort to address our long term, disastrous reading results
Booked, but can’t read (Madison): functional literacy, National citizenship and the new face of Dred Scott in the age of mass incarceration.
When A Stands for Average: Students at the UW-Madison School of Education Receive Sky-High Grades. How Smart is That?
Aaron Garth Smith, Christian Barnard And Jordan Campbell
Public education is grappling with an unprecedented set of challenges in the wake of the COVID-19 pandemic. For starters, nationwide public school enrollment is down by over 1.2 million students compared with pre-pandemic levels, including losses exceeding 5% in New York, Oregon, and Mississippi.
Research suggests that families are increasingly choosing homeschooling or private schools, with demographic factors—such as drops in school-age populations—also contributing to enrollment declines. Because states generally tie funding to student counts, this could have substantial effects on school district budgets.
Students also fell behind during COVID-19, with 2022 National Assessment of Educational Progress results showing historic losses for 4th and 8th graders in both reading and math.
—-
- There isn’t a consistent relationship between education funding growth and student outcomes across states.
For example, New York had a substantial increase in per-student funding between 2002 and 2020—ranking first in the nation at 70.2% growth.
Despite the increased spending, New York’s NAEP scores were largely flat during that period, including declines in both 4th and 8th grade reading scores.
As MPS asks taxpayers for $252 million in April, I asked (taxpayer funded Milwaukee K-12) Superintendent Keith Posley about national testing data (NAEP) that show Milwaukee 4th graders have been scoring worse than the average big city district for more than a decade (deeper dive).
(His response):
“We have made things happen for children.”
This particular program — a satellite system in GEO — is classified, but we know from an earnings call that Northrop Grumman did a $2 billion reduction “related to the termination”
That’s right, more than $2 billion for a single satellite.
The school district is planning to hit up taxpayers for $1 billion — one Billion with a capital B dollars — in referenda over the next 20 years to go carbon neutral.
MMSD can’t teach or keep young Javon safe but it’s going to replace that Swedish girl’s perpetual scowl with a Mona Lisa smile.
US Debt Clock 24 February 2024:
Debt per citizen: $101,978. Debt per taxpayer: $265,178
Over the last 4 years alone, total US debt is officially up $11 trillion and counting. At the current rate, we will see $40 trillion in US debt by 2026 and that assumes a “soft landing.”
The Madison Literary Club hopes to host a substantive fall event featuring Wisconsin 2024 US Senate candidates discussing the current debt situation, how we arrived here and what should be done about it.
debt is money owed (learn more).
Debt has many uses, from very useful to wasteful. Infrastructure such as roads, sewers, water systems and our current home ownership system is built on hopefully the wise use of debt – often secured, that is collateralized by an asset such as a home (mortgage). It can also be a way to quickly waste funds and generate fee income for the financial food chain.
Finally, I’ve heard a number of complaints over the years from the farming community about bailout policies and agriculture crises over the years. Of course, farm subsidies, particularly toward large organizations and interests, are part of the mix as well.
As MPS (Milwaukee Public Schools) asks taxpayers for $252 million in April, I asked Supt. Keith Posley about national testing data (NAEP) that show Milwaukee 4th graders have been scoring worse than the average big city district for more than a decade.
—-
and:
For reference, 10 points is about the equivalent for one year’s worth of learning. In 2022, Milwaukee was 20 points lower than the average big city district in 4th grade reading and math results. The gap has worsened over the last decade:
——
Plus:
When the media reports that spending in MPS has “fallen far behind inflation,” they are cherry-picking one year of data to make the claim: pre-Great Recession. Real $ over time has largely kept up with inflation, and districts saved billions with Act 10.
More:
This is an interesting outtake from @CBS58’s Milwaukee Public Schools referendum story!
In contrast, here is Miami’s former superintendent in 2015, post-recession, in the midst of making Miami America’s best big district, closing gaps, spending $7,500 less per child than MPS.
Legislation and Reading: The Wisconsin Experience 2004-
Underly and our long term disastrous reading results….
WEAC: $1.57 million for Four Wisconsin Senators
Legislation and Reading: The Wisconsin Experience 2004-
“Well, it’s kind of too bad that we’ve got the smartest people at our universities, and yet we have to create a law to tell them how to teach.”
The data clearly indicate that being able to read is not a requirement for graduation at (Madison) East, especially if you are black or Hispanic”
My Question to Wisconsin Governor Tony Evers on Teacher Mulligans and our Disastrous Reading Results
2017: West High Reading Interventionist Teacher’s Remarks to the School Board on Madison’s Disastrous Reading Results
Madison’s taxpayer supported K-12 school district, despite spending far more than most, has long tolerated disastrous reading results.
“An emphasis on adult employment”
Wisconsin Public Policy Forum Madison School District Report[PDF]
WEAC: $1.57 million for Four Wisconsin Senators
Friday Afternoon Veto: Governor Evers Rejects AB446/SB454; an effort to address our long term, disastrous reading results
Booked, but can’t read (Madison): functional literacy, National citizenship and the new face of Dred Scott in the age of mass incarceration.
When A Stands for Average: Students at the UW-Madison School of Education Receive Sky-High Grades. How Smart is That?
Why is it that only 15 percent of public school leaders say they’re “extremely concerned” about student absences, according to a recent Education Department survey?
This question gnawed at me as I wrote my Feb. 12, 2024 column about how chronic absenteeism remains stubbornly high in elementary, middle and high schools. Defined as missing at least 10 percent of the school year, or 18 out of 180 days, chronic absenteeism doubled from about 15 percent of students before the pandemic to about 30 percent in the 2021-22 school year. Attendance has failed to snap back and recovered only a bit during the 2022-23 year, according to data from 38 states and the District of Columbia collected by FutureED, a think tank based at Georgetown University. More than one out four students remain chronically absent.
By any measure, this level of absenteeism is alarming. It’s why test scores are sliding and why schools are struggling to help students catch up from pandemic learning losses. Mass absenteeism also affects students who are attending school because teachers cannot keep pace with the lessons they’re supposed to teach when so many classmates have missed core concepts.
Why don’t more principals understand the crisis that is happening inside their school buildings?
More.The program was the first in the nation to provide public money for tuition at religious schools, and by 2000, virtually all Cleveland voucher recipients were using them at a religious private school (mostly Catholic) rather than secular ones. In 2002, the U.S. Supreme Court narrowly rejected a challenge to the Cleveland vouchers; the court ruled that because the vouchers could be used for religious or nonreligious schools, they did not violate the constitutional prohibition against a state favoring religion. In the years that followed, vouchers spread to more districts around the state, taking on the name EdChoice. Initially, they were targeted at families in other districts deemed to be failing, but a decade ago, the state legislature — whose Republican majorities are buttressed by highly gerrymandered districts — made them available to lower-income students across the state.
Then came last year’s big expansion, eliminating income limits and raising the value of the vouchers. It offers major benefits even to many solidly middle-class families: A family of four at 451% of the poverty level, or $135,300 in household income, will receive $5,200 per year for a K-8 student and $7,050 per year for a high school student.
In the 2022-23 school year, before the expansion, EdChoice cost $354 million, on top of the $46 million for the Cleveland program, according to the state education department. That was already more than quadruple what EdChoice had cost a decade earlier.
——
Ohio per student K-12 per student $pending.
NAEP results.
Johnson, Alison H., McGee, Josh, B., Wolf, Patrick J., May, Jay F., Maloney, Larry, D.
Based on CREDO’s findings, we estimate that charter school students across nine cities perform 2.4 points (0.06 standard deviations, or SD) higher on the eighth grade reading NAEP exam and 1.3 points higher (0.03 SD) on the math exam, compared to matched TPS students.
0.18 SD in reading and eight points or 0.19 SD in math (103 percent increase for both), and San Antonio, with an additional four points or 0.11 SD in reading (25 percent) and five points or
0.12 SD in math (23 percent).
Likewise, when students are struggling, failing to turn in work or at risk of falling behind, teachers should tell them. It’s kinder — and fairer — for educators to set clear expectations and hold students to them.
Many schools have started to take the opposite approach. Perhaps in the mistaken belief that it’s gentler to give struggling students second and third chances, schools across the country are essentially withholding honest feedback from kids (and parents) through no-zero grading policies or by passing students along even though they haven’t mastered the content.
These trends started before the pandemic but have accelerated since then. And they’ve created
a growing disconnect between subjective evaluations like grades and objective data like attendance and achievement. Student grades and graduation rates are rising to new highs, while attendance and academic performance are hitting modern lows.
Most recently, the testing company ACT announced that average scores were lower this year than at any point since 1991. The declines were particularly notable for Native Hawaiian, Pacific Islander and Latino students.
America’s educational institutions used to adhere to objective standards of excellence. Students and faculty members had to strive and were rewarded (or not) according to their performance. What their background might be or where their ancestors lived didn’t matter.
That was true until a corrosive idea called “disparate impact” began taking hold in the country some 50 years ago. What that meant was that objective standards were objectionable if they resulted in poorer performance by certain racial groups. The obsession with disparate impact was kick-started by the Supreme Court’s 1971 Griggs v. Duke Power decision and has been growing in destructive force ever since.
In her latest book, When Race Trumps Merit: How the Pursuit of Equity Sacrifices Excellence, Destroys Beauty, and Threatens Lives, Heather Mac Donald surveys the landscape and sees profound changes in crucial institutions: our schools and colleges, law-enforcement, medicine, and the fine arts. Everywhere, merit is being eroded due to the acceptance among “progressive” elites of what Mac Donald calls the bias fallacy—namely, that any underrepresentation or outcome disparities for blacks and Hispanics must be caused by bias against them.
Mac Donald sees profound changes in crucial institutions: colleges, law-enforcement, medicine, and the fine arts.FacebookTwitterEmailPrintMac Donald rebuts that notion, writing, “The underrepresentation of blacks in many professions is the result of the unequal distribution of skills, not of bias. Sixty-six percent of black twelfth-graders nationally were ‘below basic’ in math skills in 2019, as measured by the National Assessment of Educational Progress (NAEP) exam.” Without good math skills, many opportunities are foreclosed, no matter your race. Bias is a facile but utterly mistaken explanation.
Arthur Jones II, Tal Axelrod, and Jay O’Brien
Learning to read isn’t fair.
It comes naturally for some students. But for others it’s a frustrating, agonizing process that, if left unaddressed, can cause long-standing academic problems.
Ask D’Mekeus Cook Jr., a fourth grader from Louisiana, who was reading at a kindergarten level when he started second grade two years ago. Or Journey, another fourth grader from Ohio, who said when she comes across an unfamiliar word it makes her feel “sad.” They have both struggled to read — and they’re not alone.
A combination of under-funded schools, educator shortages, inadequate teacher preparation and months of lost learning due to pandemic school closures have caused a resurgence of concern about kids’ reading ability. But Department of Education data reviewed by ABC News show this reading problem has persisted in America for decades.
According to the Education Department’s National Assessment of Educational Progress (NAEP), also known as “The Nation’s Report Card,” roughly one-third of American fourth graders read at or below what’s considered the basic level. This has been the case since 1992.
Scores slightly increase as students get older, but not by much. In eighth grade, about one-fourth of students do not read at what’s considered the basic achievement level. That percentage stays about the same for high schoolers.
“Well, it’s kind of too bad that we’ve got the smartest people at our universities, and yet we have to create a law to tell them how to teach.”
The data clearly indicate that being able to read is not a requirement for graduation at (Madison) East, especially if you are black or Hispanic”
My Question to Wisconsin Governor Tony Evers on Teacher Mulligans and our Disastrous Reading Results
2017: West High Reading Interventionist Teacher’s Remarks to the School Board on Madison’s Disastrous Reading Results
Madison’s taxpayer supported K-12 school district, despite spending far more than most, has long tolerated disastrous reading results.
“An emphasis on adult employment”
Wisconsin Public Policy Forum Madison School District Report[PDF]
WEAC: $1.57 million for Four Wisconsin Senators
Friday Afternoon Veto: Governor Evers Rejects AB446/SB454; an effort to address our long term, disastrous reading results
Booked, but can’t read (Madison): functional literacy, National citizenship and the new face of Dred Scott in the age of mass incarceration.
When A Stands for Average: Students at the UW-Madison School of Education Receive Sky-High Grades. How Smart is That?
In the long-running reading wars, proponents of phonics have won.
States across the country, both liberal and conservative, are passing laws designed to change the way students are taught to read in a way that is more aligned with the science of reading.
States, schools of education, districts, and — ultimately, the hope is — teachers, are placing a greater emphasis on phonics. Meanwhile, the “three-cueing” method, which encourages students to guess words based on context, has been marginalized. It’s been a striking and swift change.
But there has been much less attention paid to another critical component of reading: background knowledge. A significant body of research suggests students are better able to comprehend what they read when they start with some understanding of the topic they’re reading about. This has led some academics, educators, and journalists to call for intentional efforts to build young children’s knowledge in important areas like science and social studies. Some school districts and teachers have begun integrating this into reading instruction.
Yet new state reading laws have almost entirely omitted attention to this issue, according to a recent review. In other words, building background knowledge is an idea supported by science that has not fully caught on to the science of reading movement. That suggests that while new reading laws might have real benefits, they may fall short of their potential to improve how children are taught to read.
“It’s an underutilized component,” said Dan Trujillo, an administrator and former teacher in the San Marcos Unified School District in California. “There’s a lot of research about that: The more a reader brings into a text, the more advanced their comprehension will be.”
As public schools across Florida get ready to open, parents have greater choices and control than ever for their children. This state policy providing parents more and better educational choices started over 20 years ago and continues today. The focus on student achievement, as opposed to adult interests, has launched Florida students to the top of class.
According to U.S. News & World Report, Florida ranks No. 1 nationally this year for education, with higher education, in particular, top-ranked. The state recently earned its highest-ever NAEP rankings for grades 4 and 8, with top-five scores in key categories — all along with the continuation of two decades of narrowing “achievement gaps” for minority, low-income and disabled students.
While high-profile national political leaders take issue with a couple words in Florida’s new 216-page Black history curriculum, Florida continues to make learning and achievements gains on behalf of all students, particularly students of color. Florida is one of only a few states committed to teaching Black history as an expressed part of the required curriculum.
Former State Superintendent of Education Dr. Carey Wright rebuts a recent column in the L.A. Times claiming Mississippi “gamed its national reading test scores.”
Like educators in Mississippi and across the nation, I was shocked by the deeply cynical column in the Los Angeles Times about Mississippi’s well documented achievements in education over the past decade.
While the author acknowledges Mississippi’s historic, and sustained, gains in fourth-grade reading, he attempts to negate this achievement with a critique of unrelated social and health policies in the state.
Mississippi’s achievements in fourth-grade reading include student scores on the National Assessment of Educational Progress (NAEP) rising from the bottom nationally to ranking to 21st in the nation. In addition, Mississippi students living in poverty scored higher than their peers nationally. This achievement holds steady across all the state’s major racial and ethnic groups: Black, white and Hispanic students from low-income homes in Mississippi achieved higher scores than their peers nationally.
The author takes issue with the fact that some political leaders and journalists call these achievements the “Mississippi Miracle” because the state has more work to do to improve educational outcomes for all students.
Educators do not call these achievements a “miracle” because we know Mississippi’s progress in education is the result of strong policies, the effective implementation of a comprehensive statewide strategy and years of hard work from the state to the classroom level. We also know Mississippi has more work to do to improve student achievement in all grades, especially among Black and Hispanic students and students living in poverty. Though every state struggles to close achievement gaps, particularly among racial groups, Mississippi ranks No. 2 in the nation for closing the fourth-grade reading achievement gap between students in low-income families and their wealthier peers.
“Well, it’s kind of too bad that we’ve got the smartest people at our universities, and yet we have to create a law to tell them how to teach.”
The data clearly indicate that being able to read is not a requirement for graduation at (Madison) East, especially if you are black or Hispanic”
My Question to Wisconsin Governor Tony Evers on Teacher Mulligans and our Disastrous Reading Results
2017: West High Reading Interventionist Teacher’s Remarks to the School Board on Madison’s Disastrous Reading Results
Madison’s taxpayer supported K-12 school district, despite spending far more than most, has long tolerated disastrous reading results.
“An emphasis on adult employment”
Wisconsin Public Policy Forum Madison School District Report[PDF]
WEAC: $1.57 million for Four Wisconsin Senators
Friday Afternoon Veto: Governor Evers Rejects AB446/SB454; an effort to address our long term, disastrous reading results
Booked, but can’t read (Madison): functional literacy, National citizenship and the new face of Dred Scott in the age of mass incarceration.
When A Stands for Average: Students at the UW-Madison School of Education Receive Sky-High Grades. How Smart is That?
“If you ask, ‘Who’s the most likely to take this republic down?’ It would be the teachers’ unions, and the filth that they’re teaching our kids, and the fact that they don’t know math and reading or writing,” Pompeo said of teachers unions and the state of education in the U.S.
Weingarten went on to say she was “very offended” that he called what teachers teach “filth,” stating that those who are trying to create a more inclusive society are unfairly called pedophiles or groomers.
“Every time somebody attempts to, and teachers attempt to, or society attempts to, create a more inclusive society, those who are trying to do that are called pedophiles or groomers or teaching filth,” Weingarten said. “It’s trying to scare people and that’s part of this leveraging of what has happened in terms of COVID for political advantage.”
Roberts pointed to scores from the National Assessment of Education Progress (NAEP) that show U.S. schools have seen the largest average score decline in reading since 1990 and the first average score decline in math since 1989, as evidence that children in the American education system are falling behind.
In response, Weingarten admitted that the scores went down because of COVID and that she was wrong when she said there was no learning loss, but claimed that Los Angeles Unified School District, which stayed closed longer than any other school district in the country, fared better than schools in the state of Florida.
Yet the complacency of most Americans regarding the performance of our K–12 system has long been noted, as have the many structural, institutional, and contractual obstacles to changing that system in ways that might actually alter performance. This dates back at least to 1983’s Nation at Risk report. One reform effort after another gets opposed, diluted, or repealed—or turns out to be sorely incomplete because, for example, it fails to address the school-and-classroom implementation changes that are also essential if it’s to succeed.
Covid-related learning losses and what (if anything) to do about them are the latest example. Despite being flush with federal “recovery” dollars, most places aren’t doing much or doing “more of the same” or using the “lite” version or making it optional. They’re proving unable or unwilling to agree to actions that would truly alter behavior.
As the MacGillis piece makes clear, we shouldn’t dismiss this failure as mere structural rigidities or lack of leadership, although those definitely play roles almost everywhere. But the Richmond example is one of visionary leadership and what appear to be workable plans to retool the school year in ways that would facilitate recovery, especially among students who would get additional learning time, while also tackling such enduring problems as “summer learning loss” and kids getting into trouble due to endless weeks of no school.
What killed the year-round plan in Richmond (save for a tiny pilot version that finally slipped through, affecting just two of the districts’ fifty-four schools and potentially one thousand out of 22,000 pupils) was a witch’s brew of complacency, timidity, resignation, incomprehension, union resistance, and school board politics, plus a soupcon of condescension or obviousness among elites to the true circumstances of disadvantaged families.
Related: Harrison Bergeron:
https://www.teachingbyscience.com/sor-laws
This article continues on with our series on what percentage of students can reach grade level, as most typically defined by either the 30th percentile on a norm referenced assessment or the basic benchmark on the NAEP test. In previous articles we showed that 97.5% of students could achieve grade level standards if three conditions were met:
Emily Hanford notes the “surge in legislative activity” amidst our long term, disastrous reading results [link].
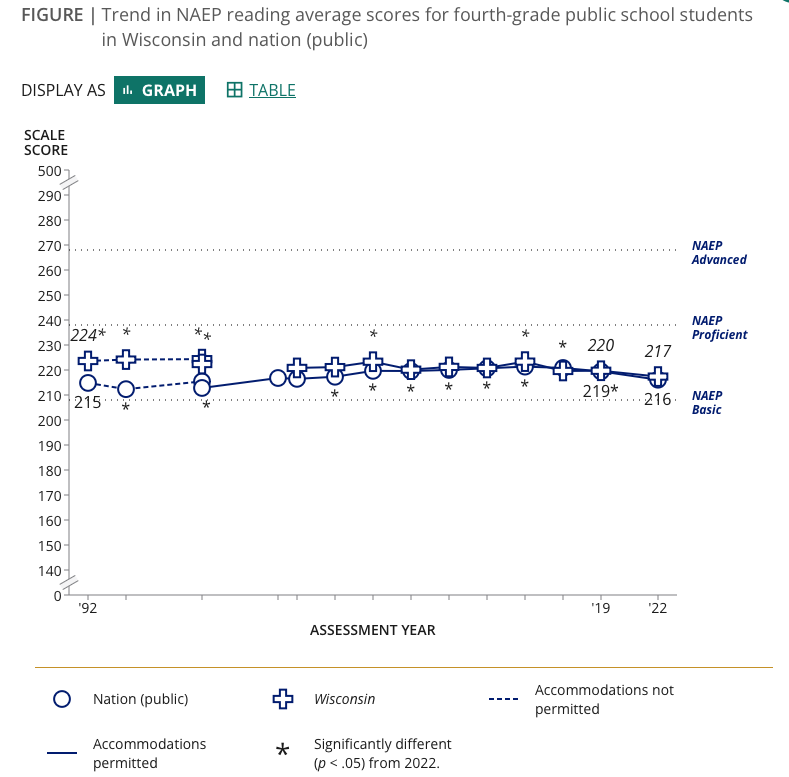
via NAEP 4th grade results 1992-2022.
Longtime SIS readers may recall a few of these articles, bookmarking our times, so to speak:
2004: [Link]
“In 2003, 80% of Wisconsin fourth graders scored proficient or advanced on the WCKE in reading. However, in the same year only 33% of Wisconsin fourth graders reached the proficient or advanced level in reading on the NAEP.”
2005: [Link]
“According to Mr. Rainwater, the place to look for evidence of a closing achievement gap is the comparison of the percentage of African American third graders who score at the lowest level of performance on statewide tests and the percentage of other racial groups scoring at that level. He says that, after accounting for income differences, there is no gap associated with race at the lowest level of achievement in reading.”
2008: “Schools should not rely on only WKCE data to gauge progress of individual students or to determine effectiveness of programs or curriculum”
2010: When A Stands for Average: Students at the UW-Madison School of Education Receive Sky-High Grades. How Smart is That?
2010: WEAC $1.57M !! for four state senators.
2011: A Capitol Conversation:
1. How teachers are taught. In Wisconsin as in much of the US, prospective teachers are not exposed to modern research on how children develop, learn, and think. Instead, they are immersed in the views of educational theorists such as Lev Vygotsky (d. 1934) and John Dewey (d. 1952). Talented, highly motivated prospective teachers are socialized into beliefs about children that are not informed by the past 50 years of basic research in cognitive science and cognitive neuroscience.
Wisconsin adopted MTEL for elementary reading teachers only. Our version is known as the Foundations of Reading Test…
2013: Alan Borsuk:
The Massachusetts test is about to become the Wisconsin test, a step that advocates see as important to increasing the quality of reading instruction statewide and, in the long term, raising the overall reading abilities of Wisconsin students. As for those who aren’t advocates (including some who are professors in schools of education), they are going along, sometimes with a more dubious attitude to what this will prove.
2017: Foundations of Reading Test Results…
May 2013 – August 2014 (Test didn’t start until January 2014, and it was the lower cut score): 2150 pass out of 2766 first time takers = 78% passage rate .xls file
September 2014 – August 2015 (higher cut score took effect 9/14): 2173/3278 = 66%
September 2015 – August 2016: 1966/2999 = 66%
September 2016 – YTD 2017: 1680/2479 = 68%
2017 [3 minute transcript]:
2018: Wisconsin DPI efforts to weaken the Foundations of Reading Test for elementary teachers.
Also, 2018: “We set a high bar for achievement,” DPI spokesman Tom McCarthy said.
Still 2018: Alan Borsuk:
But consider a couple other things that happened in Massachusetts: Despite opposition, state officials stuck to the requirement. Teacher training programs adjusted curriculum and the percentage of students passing the test rose.
More 2018: “The data clearly indicate that being able to read is not a requirement for graduation at (Madison) East, especially if you are black or Hispanic”
2019: My Question to Wisconsin Governor Tony Evers on Teacher Mulligans and our Disastrous Reading Results.
2019, continued – Alan Borsuk:
The latest report on reading was really bad. here are some possible solutions. Mississippi got a lot of attention when the NAEP scores were released. It was the only state where fourth grade reading scores improved. Mississippi is implementing a strong requirement that teachers be well-trained in reading instruction. Massachusetts did that in the 1990s and it paid off in the following decade.
2020: Booked, but can’t read (Madison): functional literacy, National citizenship and the new face of Dred Scott in the age of mass incarceration
2021: Wisconsin DPI Superintendent Jill Underly:
All right. Um, as far as the Foundations of Reading (FORT) test is concerned, I would support eliminating it. And I’ll tell you why. I believe it’s an unnecessary hoop. Um, it makes it difficult and much harder for people to become teachers, particularly when we are already struggling. Right. With recruiting and retaining teachers.
2021: Wisconsin Governor Evers vetoes AB446 and SB454 (Friday afternoon):
The bill would mandate school boards and independent charter schools to assess the early literacy skill of pupils in four-year-old kindergarten to second grade using repeated screening assessments throughout the year and to create a personal reading plan for each pupil in five-year-old kindergarten to second grade who is identified as at-risk. It would also mandate the Department of Public Instruction establish and maintain lists of approved fundamental skills screening assessments, universal screening assessments, and diagnostic assessments on its Internet site based on alignment with model academic standards in reading and language arts, and a mandatory minimum sensitivity rate and specificity rate.
2023: Wisconsin Legislative hearing on our long term, disastrous reading results: “Well, it’s kind of too bad that we’ve got the smartest people at our universities, and yet we have to create a law to tell them how to teach.”
2023: Further attempts to kill our only teacher content knowledge requirement: elementary reading “!”. Corrinne Hess:
“Only 54 percent of first-time Teacher test takers passed for the 2020-21 school year. That’s down from 66 percent in 2014-15”
2024: Ongoing Wisconsin Literacy Legislation Litigation…. Governor Evers’ partial veto – (mind the Governor’s mulligans)
It’s a cliché that Kymyona Burk heard a little too often: “Thank God for Mississippi.”
As the state’s literacy director, she knew politicians in other states would say it when their reading test scores were down — because at least they weren’t ranked as low as Mississippi. Or Louisiana. Or Alabama.
Lately, the way people talk about those states has started to change. Instead of looking down on the Gulf South, they’re seeing it as a model.
Mississippi went from being ranked the second-worst state in 2013 for fourth-grade reading to 21st in 2022. Louisiana and Alabama, meanwhile, were among only three states to see modest gains in fourth-grade reading during the pandemic, which saw massive learning setbacksin most other states.
The turnaround in these three states has grabbed the attention of educators nationally, showing rapid progress is possible anywhere, even in areas that have struggled for decades with poverty and dismal literacy rates. The states have passed laws adopting similar reforms that emphasize phonics and early screenings for struggling kids.
“In this region, we have decided to go big,” said Burk, now a senior policy fellow at ExcelinEd, a national advocacy group.
These Deep South states were not the first to pass major literacy laws; in fact, much of Mississippi’s legislation was based on a 2002 law in Florida that saw the Sunshine State achieve some of the country’s highest reading scores. The states also still have far to go to make sure every child can read.
"Alabama ranked 49th in NAEP reading scores for low-income fourth-graders; in 2022, it ranked 27th. Amid the pandemic that saw most states lose ground, Louisiana soared from 42nd to 11th. Mississippi ranks second-highest in the country, after Florida." https://t.co/qRBWSNo2pQ
— Emily Hanford (@ehanford) May 17, 2023
“Well, it’s kind of too bad that we’ve got the smartest people at our universities, and yet we have to create a law to tell them how to teach.”
The data clearly indicate that being able to read is not a requirement for graduation at (Madison) East, especially if you are black or Hispanic”
My Question to Wisconsin Governor Tony Evers on Teacher Mulligans and our Disastrous Reading Results
2017: West High Reading Interventionist Teacher’s Remarks to the School Board on Madison’s Disastrous Reading Results
Madison’s taxpayer supported K-12 school district, despite spending far more than most, has long tolerated disastrous reading results.
“An emphasis on adult employment”
Wisconsin Public Policy Forum Madison School District Report[PDF]
WEAC: $1.57 million for Four Wisconsin Senators
Friday Afternoon Veto: Governor Evers Rejects AB446/SB454; an effort to address our long term, disastrous reading results
Booked, but can’t read (Madison): functional literacy, National citizenship and the new face of Dred Scott in the age of mass incarceration.
When A Stands for Average: Students at the UW-Madison School of Education Receive Sky-High Grades. How Smart is That?
Providing further proof that U.S. children suffered significant learning loss when schools were closed during the COVID-19 pandemic, the National Assessment Governing Board released a report Wednesday that showed test scores measuring achievement in U.S. history and civics fell significantly between 2018 and 2022.
The tests, part of the National Assessment of Educational Progress (NAEP), commonly known as the “nation’s report card,” were given to thousands of eighth-grade students across the country. Scores on the U.S. history assessment were the lowest recorded since 1994, while the scores on the civics test fell for the first time ever.
Only 13% of students tested in U.S. history were considered proficient, meaning that they had substantially mastered the material expected of them. That was 1 percentage point lower than in 2018. Another 46% tested at the NAEP “basic” level, meaning they had partial mastery of the material, down 4 percentage points. The remaining 40% of students tested did not meet the bar for basic knowledge, an increase of 6 percentage points.
In civics, 20% of students tested qualified as proficient, and 48% had basic knowledge of the material — both down 1 percentage point from 2018. Another 31% failed to demonstrate even basic knowledge, an increase by 4 percentage points over 2018.
In related news, new NAEP data on history and civics out today, it’s not good news. Some of the data suggest our social divides are getting worse with students furthest from opportunity more impacted.
Secretary of Education Miguel Cardona made the following statement:
“The latest data from the National Assessment of Educational Progress further affirms the profound impact the pandemic had on student learning in subjects beyond math and reading. It tells us that now is not the time for politicians to try to extract double-digit cuts to education funding, nor is it the time to limit what students learn in U.S. history and civics classes. We need to provide every student with rich opportunities to learn about America’s history and understand the U.S. Constitution and how our system of government works. Banning history books and censoring educators from teaching these important subjects does our students a disservice and will move America in the wrong direction.”
This stirred up a little tempest on Twitter. People are doing gymnastics to try to argue this isn’t a politicized response. NAEP expert Tom Loveless thinks it’s a sign of coming attractions with the new timing on NAEP releases. I hope he’s wrong but he’s probably right. Marty West says stop worrying, they’re on it.
“As bad as the pandemic was for student learning,” some education fads will make it worse, writes Greg Richmond, superintendent of schools for the Archdiocese of Chicago.
Across the country, schools are moving away from homework, grades, attendance and academic honors, he writes. “Numerous public school districts now prohibit teachers from giving students a score of less than 50% on homework,” even if the student does nothing or turns in plagiarized work.
Parents who want a traditional education — grades and all — can turn to Catholic schools, Richmond writes. “As measured in last year’s National Assessment of Educational Progress, Catholic schools’ eighth-grade reading scores increased during the pandemic, while public school scores declined,” he writes.
“If Catholic schools were a state, they would be the highest performing in the nation on all four NAEP tests,” Kathleen Porter-Magee, superintendent of Partnership Schools, a network of Catholic schools in New York and Ohio, tweeted in October.
Many parents want a safe, orderly school that respects their role in raising their children.
Math scores are way down: The Education Recovery Scorecard estimates students lost half a year. But Boaler believes it doesn’t matter. It’s “quite clear” the students gained “knowledge and insights about the world, health challenges, global upheaval, exponential growth, technology, and ways to help their families and navigate complex social situations,” she writes.
This is not clear to me at all. If anything, it’s quite clear that many lost the ability to navigate complex — or even simple — social situations, and I’m dubious about their knowledge and insights too. Screen time soared. That doesn’t mean they’re masters of technology. Physical and mental health declined.
Learning math matters, responds Fordham’s Nathaniel Grossman. Two decades of growth was “wiped out in just three years,” NAEP scores revealed. If we don’t do something about learning loss, this generation could be locked out of high-paying STEM careers, he writes. “One Stanford economist estimates that it’ll reduce the lifetime earnings of students by $70,000 and cause a $28 trillion hit to the American economy.”
Literacy is essential to developing self-worth and becoming successful in all aspects of life including family, education, work, and community service. Varied levels of awareness, understanding, and action have contributed to long-standing myths about reading and growing challenges that impact every Wisconsinite.
Educational attainment is a barrier to self-sustaining wages for dropouts and unprepared graduates creating an economic burden for themselves and taxpayers. The average lifetime costs to taxpayers resulting from schooling failure are approximately $90,000 per dropout and $30,000 per unprepared graduate (Education Consumers Foundation, 2022).
In 2021-2022:
37% of WI students in grades 3-8 scored proficient or advanced on the Wisconsin Forward Exam for English Language Arts (WISEdash, 2022).35 % of WI students in grade 11 scored proficient or advanced on the ACT exam for English Language Arts (WISEdash, 2022).
WI had the widest achievement gap between African American and white students in the nation (IES and NAEP, 2022).
At long last, and only after a great deal of public outcry, Gov. Murphy’s Department of Education finally released the full dataset from last spring’s state tests. This means that we now know the district-level results and community leaders, school administrators and parents know where and how much remediation is needed — and there is a lot of remediation needed. Why it took until December to do so remains unanswered, but Murphy’s desire to bury the horrible results offers a highly believable explanation. A new study shows that New Jersey and its children will suffer the devastating consequences far into the future.
Recall that Murphy allowed for extended school closures in many of New Jersey’s largest school districts, including Newark, Jersey City and Montclair, just as the teachers unions wanted. Now that the test results are out, we know that New Jersey students — particularly minority students — suffered immense learning losses because of these extended closures. And new research indicates that unless these losses are remediated swiftly and decisively, they will negatively affect these students for the rest of their lives.
A recent study by Stanford economist Eric Hanushek, “The Economic Costs of the Pandemic,” looked the National Assessment of Educational Progress (NAEP – known as “the nation’s report card”) and determined that in 8th-grade math, New Jersey students “had greater learning losses than the nation as a whole.” The chart below shows just how much greater.
Just realized the link between @ehanford‘s Sold a Story podcast and NAEP scores. People have been wondering why reading scores didn’t drop as much as math scores after school closures. Answer: kids aren’t taught to read at school, so closed schools didn’t matter. QED.
— Eileen (@EileenChollet) November 28, 2022
This week’s NAEP data show how important reopening was for learning. Today, the divergence between Catholic schools and public ones is so great that if all U.S. Catholic schools were a state, their 1.6 million students would rank first in the nation across the NAEP reading and math tests for fourth and eighth graders.
How willing are people, including education leaders and politicians, to tackle the needs of kids? The generally predictable reactions to the NAEP scores don’t provide encouragement.
The huge disruptions in schooling nationwide are become matters more for unhappy memories than present concerns. And it appears that many aspects of education are returning to the way they used to be. That’s good in some ways — and worrisome in others. There were big needs before COVID. There are big needs now. Is there much willingness to address them urgently and honestly?
Governor Youngkin declared it “catastrophic” and proceeded to blame his predecessors.
It should be pointed out that the Northam administration and the “mainstream media” had begun sounding alarms several years ago. The Richmond Times-Dispatch, much criticized on this blog, declared in 2018 that “Virginia’s failing grade on reading SOLs must not be tolerated.” The administration began to take steps after the release of the 2019 NAEP scores to address the problem. James Lane, then Superintendent of Public Instruction, expressed his dismay over the widening gap in the reading scores and declared the Department of Education (DOE) would examine the methods used by divisions in which students had scored well with an eye to determining whether those methods could be replicated in other divisions. He also scheduled a statewide literacy summit in early 2020 in Charlottesville to address the problem. Then the COVID-19 pandemic hit and whatever was decided at that summit took a back seat to the efforts just to keep schools operating at some level during the crisis. As the pandemic eased and schools re-opened to in-person instruction, it was recently pointed out on this blog that the Northam administration’s outgoing budget “prioritized reading initiatives for 1st, 2nd and 3rd graders.”
What has Governor Youngkin proposed? For months, his administration has advocated increasing accreditation standards and the SOL “cut scores.” He reiterated those goals in the wake of the NAEP scores. The top priority listed in the Governor’s news release was “Raise the Floor and the Ceiling” and the fourth priority was “Hold Ourselves and Our Schools Accountable.” Those goals were also expressed by Secretary of Education Aimee Guidera, as reported by Jim Bacon on this blog.

Tell parents the unpleasant truth about learning loss, writes Andrew Rotherham in a story on the state NAEP scores in the The 74. “The disaster and inequity of pandemic policies is now in clear focus,” he writes. Despite a few outliers — Department of Defense and Catholic schools — “it’s an across-the-board disaster for the United States.”
“Students already furthest from success in school were most impacted,” he writes. “Thirty-eight percent of eighth-graders are at a level in mathematics that leaves them functionally unprepared to fend for themselves in the world, let alone pursue success in various college and career opportunities.”
The data clearly indicate that being able to read is not a requirement for graduation at (Madison) East, especially if you are black or Hispanic”
My Question to Wisconsin Governor Tony Evers on Teacher Mulligans and our Disastrous Reading Results
2017: West High Reading Interventionist Teacher’s Remarks to the School Board on Madison’s Disastrous Reading Results
Madison’s taxpayer supported K-12 school district, despite spending far more than most, has long tolerated disastrous reading results.
“An emphasis on adult employment”
Wisconsin Public Policy Forum Madison School District Report[PDF]
WEAC: $1.57 million for Four Wisconsin Senators
Friday Afternoon Veto: Governor Evers Rejects AB446/SB454; an effort to address our long term, disastrous reading results
Booked, but can’t read (Madison): functional literacy, National citizenship and the new face of Dred Scott in the age of mass incarceration.
No When A Stands for Average: Students at the UW-Madison School of Education Receive Sky-High Grades. How Smart is That?
Recently, results from the National Assessment for Educational Progress (NAEP) have caused shockwaves around the country. At least partially-related to teachers’ union-led shutdowns that kept schools closed well past when it was reasonable to do so,[i] decades of progress in scores were erased over the course of three years.[ii]
Despite declining scores across the board, the Wisconsin Department of Public Instruction (DPI) attempted to paint a relatively rosy picture of the results for the state. Claiming that elementary students had “bucked the trend,” a DPI press release[iii] pointed to evidence that Wisconsin students still ranked above the national average. On the surface, this information appeared to be true—Wisconsin 4th graders tied for 18th in reading and 8th graders tied for 9th. But a look below the surface reveals that Wisconsin families should be far more concerned than these rankings suggest.
Among the key takeaways from the report include:
States like Florida and Mississippi that have implemented significant education reform show positive results for student achievement. States that have implemented extensive school-choice programs and stringent reading requirements rank higher when fair comparisons are made.
That said, the results for reading presented here show clearly that Wisconsin cannot afford to rely on its demographics to keep the state near the top in terms of education. While Wisconsin receives much deserved scrutiny for its persistent racial achievement gap, this analysis shows that problems are more widespread. Given the demographic characteristics of the state, Wisconsin should rank significantly higher on the NAEP than it does.
There are a number of policy solutions to this issue. The implementation of school choice for all families would guarantee that no student is left out in the cold when it comes to educational choices regardless of their ZIP code or family income. Such a proposal would also provide needed competition to the public-school sector, and encourage improvement. But proposals for the improvement of public schools must be considered as well. As mentioned earlier, the fact that the state of Mississippi rises nearly to the top in the gap between predicted and actual performance is yet another signal that reading reforms in the state have been effective. Policymakers in Wisconsin ought to give these options another examination in the next legislative session.
The data clearly indicate that being able to read is not a requirement for graduation at (Madison) East, especially if you are black or Hispanic”
My Question to Wisconsin Governor Tony Evers on Teacher Mulligans and our Disastrous Reading Results
2017: West High Reading Interventionist Teacher’s Remarks to the School Board on Madison’s Disastrous Reading Results
Madison’s taxpayer supported K-12 school district, despite spending far more than most, has long tolerated disastrous reading results.
“An emphasis on adult employment”
Wisconsin Public Policy Forum Madison School District Report[PDF]
WEAC: $1.57 million for Four Wisconsin Senators
Friday Afternoon Veto: Governor Evers Rejects AB446/SB454; an effort to address our long term, disastrous reading results
Booked, but can’t read (Madison): functional literacy, National citizenship and the new face of Dred Scott in the age of mass incarceration.
No When A Stands for Average: Students at the UW-Madison School of Education Receive Sky-High Grades. How Smart is That?
In reading, Wisconsin eighth graders saw their average score drop by five points compared to a three-point drop for the nation. Wisconsin students hadn’t had an average score this low in NAEP data going back to 1998.
The data clearly indicate that being able to read is not a requirement for graduation at (Madison) East, especially if you are black or Hispanic”
My Question to Wisconsin Governor Tony Evers on Teacher Mulligans and our Disastrous Reading Results
2017: West High Reading Interventionist Teacher’s Remarks to the School Board on Madison’s Disastrous Reading Results
Madison’s taxpayer supported K-12 school district, despite spending far more than most, has long tolerated disastrous reading results.
“An emphasis on adult employment”
Wisconsin Public Policy Forum Madison School District Report[PDF]
WEAC: $1.57 million for Four Wisconsin Senators
Friday Afternoon Veto: Governor Evers Rejects AB446/SB454; an effort to address our long term, disastrous reading results
Booked, but can’t read (Madison): functional literacy, National citizenship and the new face of Dred Scott in the age of mass incarceration.
No When A Stands for Average: Students at the UW-Madison School of Education Receive Sky-High Grades. How Smart is That?
Will Flanders and Dylan Palmer:
How does Wisconsin stack up against other states in K-12 education? An eye-popping list from U.S. News and World Report ranked the Badger State K-12 system as the 8th best in the country.i But this rosy picture contradicts other key indicators that Wisconsin students are falling behind. So what’s going on? To get a clear look at public education in the Badger Sate requires a dive into the details.
Key Takeaways
• The academic proficiency data used by U.S. News & World Report to rank Wisconsin 8th is from the 2018-19 school year. Notably, this school year featured a transition in the governor’s mansion and was a full year before the COVID-19 pandemic wreaked havoc on Wisconsin schools.
• A sophisticated analysis of Wisconsin’s academic proficiency from 2018-19 puts Wisconsin in the middle of the pack. An Urban Institute analysis that controls for demographic factors finds Wisconsin falls out of the top ten in both math and reading on the NAEP scores.
• Academic proficiency has fallen significantly in Wisconsin since the COVID-19 pandemic arrived in 2020. Forward Exam scores fell by about 4 percentage points in reading and 5 percentage points in math.
• Chronic absenteeism in Wisconsin schools reached new heights in the most recent school year. The share of students not regularly showing up for class rose to 16% in 2020-21 school year—the highest in five years.
The data clearly indicate that being able to read is not a requirement for graduation at (Madison) East, especially if you are black or Hispanic”
My Question to Wisconsin Governor Tony Evers on Teacher Mulligans and our Disastrous Reading Results
2017: West High Reading Interventionist Teacher’s Remarks to the School Board on Madison’s Disastrous Reading Results
Madison’s taxpayer supported K-12 school district, despite spending far more than most, has long tolerated disastrous reading results.
“An emphasis on adult employment”
Wisconsin Public Policy Forum Madison School District Report[PDF]
WEAC: $1.57 million for Four Wisconsin Senators
Friday Afternoon Veto: Governor Evers Rejects AB446/SB454; an effort to address our long term, disastrous reading results
Booked, but can’t read (Madison): functional literacy, National citizenship and the new face of Dred Scott in the age of mass incarceration.
No When A Stands for Average: Students at the UW-Madison School of Education Receive Sky-High Grades. How Smart is That?
The U.S. has a choice: Give up on a generation or confront this challenge head-on. Some adults find it easier to give up. They won’t say it out loud; they’ll simply lower expectations. Or they’ll explain away the drop in scores, blaming the pandemic when scores had already begun to decline before Covid hit. Rather than raise the bar, they’ll dodge accountability, allowing today’s low math and reading scores to become tomorrow’s ceiling. That is unacceptable.
We can move forward rather than back. Doing so is a priority if the U.S. is to be a competitive nation in a competitive world. It also is a human necessity, as every student has God-given potential and deserves a great education.
The solutions are simple. There are math and reading policies every state should immediately enact and there are ways parents can contribute. Start with a call to all parents, guardians and families—those who know their children best. You were called on to step up when Covid kept kids at home. Now you are needed again to help close those learning gaps. Any trusted adult in a child’s life—parent, grandparent, uncle, aunt, whoever—should lean into this moment. Help students recover lost learning by reading for 20 minutes a day. That can be a parent reading to a child, a child reading to a parent or children reading to themselves. In addition, research has found that 30 minutes a week of extra math work can help students who are struggling or behind. If you aren’t up to writing math equations for your kids, seek out free, high-quality online math tools.
Lawmakers must step up, too. One way to help parents is eliminating the barriers students face in accessing a better education. This year, Arizona became a national model by creating a universal education savings account program with flexible, portable and customizable funding. That kind of legislation is transformative for student learning.
Early literacy is the foundation for long-term reading success. To ensure every child can read by the third grade and be ready to succeed in life, policy makers must ensure that all educators are trained in phonics and the science of reading—an evidence-based approach to teach the understanding of sounds, decoding, fluency, vocabulary and comprehension. This may require changing teacher-prep programs in colleges of education as well as installing literacy coaches in every elementary and middle school.
Indeed, 32 percent of Mississippi students hit literacy targets in 2019, up from 27 percent in 2017 and just 17 percent in 1998, according to the National Assessment of Educational Progress.
Despite the successes so far, Ms. Wright — who retired from education this year — believes there are plenty of challenges left to be tackled “to make things better for the children of Mississippi.”
“Each year we tweak our methods, but the goals always remain the same,” said Ms. Wright, who feels that the state’s math programs are particularly ripe for an overhaul.
Here are some of the actions that helped pull Mississippi up the reading ranks.
The most crucial element of Mississippi’s testing turnaround was the establishment of the Literacy-Based Promotion Act in 2013, which required third-grade students to demonstrate basic reading proficiency levels to progress onto fourth grade.
Championed by the Republican State Senator Gray Tollison and signed into law by former Republican Gov. Phil Bryant, the act not only set clear standards and expectations (“a critical model of accountability,” Ms. Wright said), it also set off a range of policies and legislation — such as provisions for new charter schools — to support students, districts and, most critically, teachers in achieving its aims.
Among the most notable was the Early Learning Collaborative Act, which funds specialized collaborative pre-K programs. Rachel Canter, executive director of Mississippi First, said it encourages partnerships between school districts and Head Start, along with private schools or child care, which could then trigger state funding to run pre-K programs for 4-year-olds.
The data clearly indicate that being able to read is not a requirement for graduation at (Madison) East, especially if you are black or Hispanic”
My Question to Wisconsin Governor Tony Evers on Teacher Mulligans and our Disastrous Reading Results
2017: West High Reading Interventionist Teacher’s Remarks to the School Board on Madison’s Disastrous Reading Results
Madison’s taxpayer supported K-12 school district, despite spending far more than most, has long tolerated disastrous reading results.
“An emphasis on adult employment”
Wisconsin Public Policy Forum Madison School District Report[PDF]
WEAC: $1.57 million for Four Wisconsin Senators
Friday Afternoon Veto: Governor Evers Rejects AB446/SB454; an effort to address our long term, disastrous reading results
Booked, but can’t read (Madison): functional literacy, National citizenship and the new face of Dred Scott in the age of mass incarceration.
No When A Stands for Average: Students at the UW-Madison School of Education Receive Sky-High Grades. How Smart is That?
Related: The Milwaukee County Pension Scandal that lead to Scott Walker’s election to county Executive and later the Governor’s office.
You’d think this would be cause for reflection by our education elites, but no such luck. Media headlines blamed “the pandemic,” as if Covid-19 ran America’s school districts and decided to force students to sit at home in front of screens for more than a year. Educators—as they call themselves—did that.
National Center for Education Statistics Commissioner Peggy Carr had a grab-bag of excuses for the tragic learning loss: “School shootings, violence, and classroom disruptions are up, as are teacher and staff vacancies, absenteeism, cyberbullying, and students’ use of mental health services. This information provides some important context for the results we’re seeing from the long-term trend assessment.”
She missed the “classroom disruptions” of not being able to go to class at all.
American Federation of Teachers chief Randi Weingarten, who pushed shutdowns as long as she possibly could before parents revolted, tried to forget this ever happened with her statement on Twitter: “Thankfully after two years of disruption from a pandemic that killed more than 1 mil Americans, schools are already working on helping kids recover and thrive. This is a year to accelerate learning by rebuilding relationships, focusing on the basics.” But she and her union were the chief disrupters.
You’d think this would be cause for reflection by our education elites, but no such luck. Media headlines blamed “the pandemic,” as if Covid-19 ran America’s school districts and decided to force students to sit at home in front of screens for more than a year. Educators—as they call themselves—did that.
National Center for Education Statistics Commissioner Peggy Carr had a grab-bag of excuses for the tragic learning loss: “School shootings, violence, and classroom disruptions are up, as are teacher and staff vacancies, absenteeism, cyberbullying, and students’ use of mental health services. This information provides some important context for the results we’re seeing from the long-term trend assessment.”
She missed the “classroom disruptions” of not being able to go to class at all.
How does Wisconsin stack up against other states in K-12 education? An eye-popping list from U.S. News and World Report ranked the Badger State K-12 system as the 8th best in the country.i But this rosy picture contradicts other key indicators that Wisconsin students are falling behind. So what’s going on? To get a clear look at public education in the Badger Sate requires a dive into the details.
Key Takeaways
• The academic proficiency data used by U.S. News & World Report to rank Wisconsin 8th is from the 2018-19 school year. Notably, this school year featured a transition in the governor’s mansion and was a full year before the COVID-19 pandemic wreaked havoc on Wisconsin schools.
• A sophisticated analysis of Wisconsin’s academic proficiency from 2018-19 puts Wisconsin in the middle of the pack. An Urban Institute analysis that controls for demographic factors finds Wisconsin falls out of the top ten in both math and reading on the NAEP scores.
• Academic proficiency has fallen significantly in Wisconsin since the COVID-19 pandemic arrived in 2020. Forward Exam scores fell by about 4 percentage points in reading and 5 percentage points in math.
• Chronic absenteeism in Wisconsin schools reached new heights in the most recent school year. The share of students not regularly showing up for class rose to 16% in 2020-21 school year—the highest in five years.
The Recent U.S. News & World Report Rankings
The core claim in question, that Wisconsin is ranked 8th for Pre-K-12 public education, refers to Wisconsin’s placement in the U.S. New & World Report Pre-K-12 rankings for 2022.ii In the previous ranking released in 2018, Wisconsin’s schools were ranked 16th , meaning the state shot up 10 places. While this would doubtless be encouraging news if it were credible, there is recent to question where Wisconsin sits on the list.
The biggest issue with the rankings is in the use of raw scores on the National Assessment for Educational Progress (NAEP). As a national norm-referenced test, the NAEP is arguably the best tool for making interstate comparisons, but one must be careful when simply using the raw numbers, which U.S. News does for eighth grade reading and math. On these metrics, Wisconsin is ranked 6th and 4th respectively. Just as in WILL’s Apples to Apples report,iii where we note that demographic factors must be taken into account in determining how well a school is doing, they must also be taken into account when ranking state performance. Unfortunately, factors like poverty, race, and English Language Learner status (ELL) matter in school performance. Low and minority students, on average, perform worse on exams for any number of reasons. These factors must be controlled for to make serious comparisons.
Fortunately, the Urban Institute has such a ranking.iv After controlling for age, race, disability status, family income and ELL, Wisconsin falls to 14th from 4th in math and from 6th to 21st in reading. The Urban Institute also provides a chart of the overall trend in ranking for each state. The unadjusted ranking is in yellow, while the demographically-adjusted ranking is in blue. The chart shows that there isn’t much of a discernible trend in performance—if anything, it’s the opposite of improvement.
The status quo solution for public school education has been to simply provide more money, which research has found bears little relationship to student performance. In order for Wisconsin school districts to actually be some of the best in the nation, Wisconsin needs to sever the connection to the preferred policies of teacher unions and the public-school establishment, who fight competition from every alternative option. Instead, Wisconsin education policies must empower parents to make the best choice for their son or daughter, which may include a traditional public school.
Wisconsin needs robust alternative options that enable every student in the state to attend the school that best meets their needs. This includes opening up private-school choice to middle- class families who can’t afford private-school options, and a more open charter school sector that ensures public-school options exist in every corner of the state. Achieving these goals won’t be easy, but the information here shows that the state can ill afford complacency when it comes to education policy.
The data clearly indicate that being able to read is not a requirement for graduation at (Madison) East, especially if you are black or Hispanic”
2017: West High Reading Interventionist Teacher’s Remarks to the School Board on Madison’s Disastrous Reading Results
Madison’s taxpayer supported K-12 school district, despite spending far more than most, has long tolerated disastrous reading results.
My Question to Wisconsin Governor Tony Evers on Teacher Mulligans and our Disastrous Reading Results
“An emphasis on adult employment”
Wisconsin Public Policy Forum Madison School District Report[PDF]
WEAC: $1.57 million for Four Wisconsin Senators
Friday Afternoon Veto: Governor Evers Rejects AB446/SB454; an effort to address our long term, disastrous reading results
Booked, but can’t read (Madison): functional literacy, National citizenship and the new face of Dred Scott in the age of mass incarceration.
No When A Stands for Average: Students at the UW-Madison School of Education Receive Sky-High Grades. How Smart is That?
I am overstating, but not by much. A significant number of American students are reading fluently and with understanding and are well on their way to becoming literate adults. But they are a minority. As of 2019, according to the National Association of Education Progress (NAEP), sometimes called the Nation’s Report Card, 35 percent of fourth-graders were reading at or above proficiency levels; that means, to spell it out, that a strong majority—65 percent, to be exact—were less than proficient. In fact, 34 percent were reading, if you can call it that, below a basic level, barely able to decipher material suitable for kids their age. Eighth-graders don’t do much better. Only 34 percent of them are proficient; 27 percent were below-basic readers. Worse, those eighth-grade numbers represent a decline from 2017 for 31 states.
As is always the case in our crazy-quilt, multiracial, multicultural country, the picture varies, depending on which kids you’re looking at. If you categorize by states, the lowest scores can be found in Alabama and New Mexico, with just 21 percent of eighth-graders reading proficiently. The best thing to say about these results is that they make the highest-scoring state—Massachusetts, with 47 percent of students proficient—look like a success story rather than the mediocrity it is.
The findings that should really push antiracist educators to rethink their pedagogical assumptions are those for the nation’s black schoolchildren. Nationwide, 52 percent of black children read below basic in fourth grade. (Hispanics, at 45 percent, and Native Americans, at 50 percent, do almost as badly, but I’ll concentrate here on black students, since antiracism clearly centers on the plight of African-Americans.) The numbers in the nation’s majority-black cities are so low that they flirt with zero. In Baltimore, where 80 percent of the student body is black, 61 percent of these students are below basic; only 9 percent of fourth-graders and 10 percent of eighth-graders are reading proficiently. (The few white fourth-graders attending Charm City’s public schools score 36 points higher than their black classmates.) Detroit, the American city with the highest percentage of black residents, has the nation’s lowest fourth-grade reading scores; only 5 percent of Detroit fourth-graders scored at or above proficient. (Cleveland’s schools, also majority black, are only a few points ahead.)
In April 2020, the Sixth Circuit Court of Appeals ruled in favor of former students suing Detroit schools for not providing an adequate education. The suit cited poor facilities and inadequate textbooks, but below-basic literacy skills were the primary academic complaint. One of the plaintiffs was a former Detroit public school student who went on to community college and ended up on academic probation, in need of a reading tutor. His story is typical enough as to be barely worth mentioning—except for the fact that he graduated at the top of his public high school class. And as if this isn’t bad enough, the numbers appear likely to get worse, with the impact of Covid-19 disruptions.
The data clearly indicate that being able to read is not a requirement for graduation at (Madison) East, especially if you are black or Hispanic”
2017: West High Reading Interventionist Teacher’s Remarks to the School Board on Madison’s Disastrous Reading Results
Madison’s taxpayer supported K-12 school district, despite spending far more than most, has long tolerated disastrous reading results.
My Question to Wisconsin Governor Tony Evers on Teacher Mulligans and our Disastrous Reading Results
“An emphasis on adult employment”
Wisconsin Public Policy Forum Madison School District Report[PDF]
WEAC: $1.57 million for Four Wisconsin Senators
Friday Afternoon Veto: Governor Evers Rejects AB446/SB454; an effort to address our long term, disastrous reading results
Booked, but can’t read (Madison): functional literacy, National citizenship and the new face of Dred Scott in the age of mass incarceration.
No When A Stands for Average: Students at the UW-Madison School of Education Receive Sky-High Grades. How Smart is That?

schoolinfosystem.org
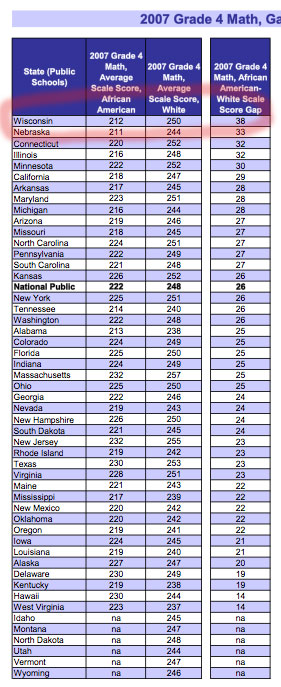
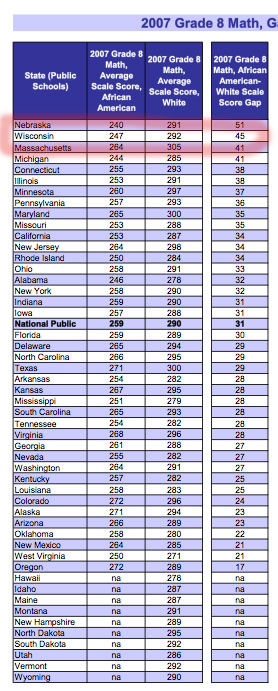