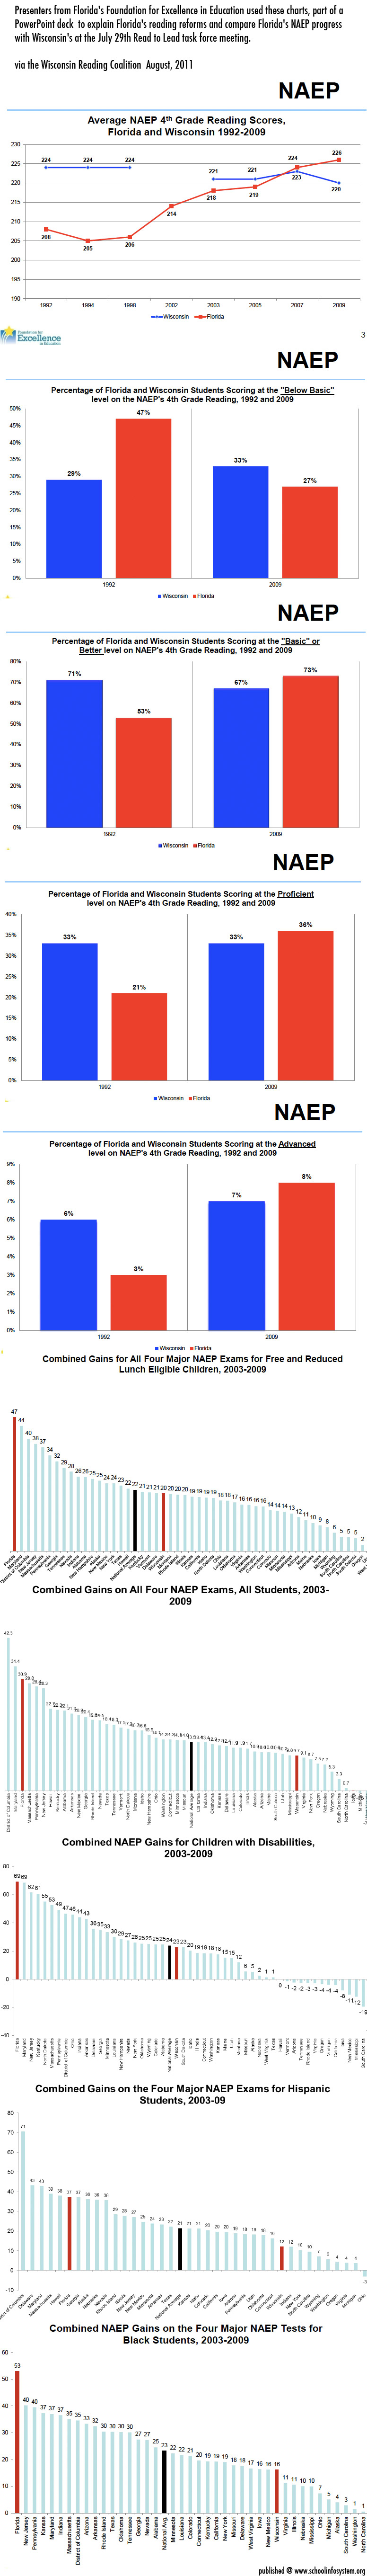
Wisconsin Reading Coalition, via a kind email:
The results of the 2013 National Assessment of Educational Progress (NAEP) were released today. For Wisconsin, the news on reading is much the same as it was two years ago at the last NAEP administration. 33.6% of our 4th graders reached the proficient level. Massachusetts again scored at the top, with 50.4% of its 4th graders proficient.
Wisconsin students who are Asian, black, and white, as well as students who are not eligible for a free and reduced lunch, all posted scores that are significantly lower than the national averages for those groups of students. We had no 4th grade sub-groups that scored significantly above the national average for their group.
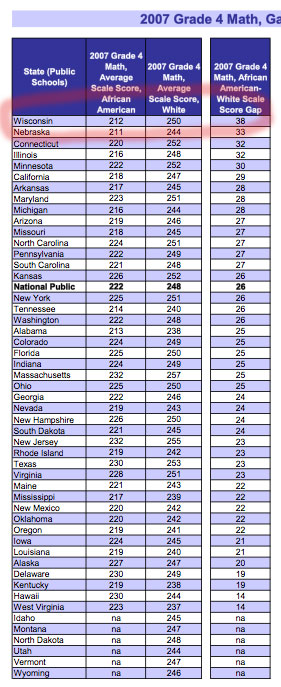
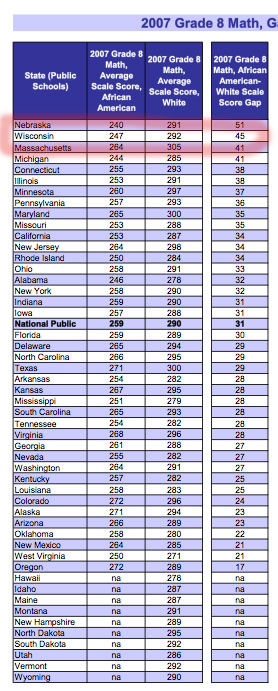
Wisconsin’s black 8th graders had the lowest scores in the nation, falling below Mississippi and Alabama. Wisconsin’s black 4th graders had the second lowest scores in the nation, and at both 4th and 8th grade, Wisconsin had the largest gap between white and black students.
As we examine the data more fully, we will have more specifics.
Stephanie Banchero:
Fourth- and eighth-graders across the country made modest advances in national math and reading exams this year, according to data released Thursday, but proficiency rates remained stubbornly below 50% on every test.
Amid the sluggish progress nationwide, a few areas notched drastic improvements on the 2013 National Assessment of Educational Progress exams, with Tennessee and Washington, D.C., –as well as schools on military bases–the only ones achieving statistically significant gains on all tests.
Washington gained a cumulative 23 points since 2011, while Tennessee posted a 22-point jump–both compared with a 4-point national gain. The exams are scored on a 0-500 scale.
Officials in Tennessee and Washington attributed the gains to tougher classroom math and reading standards, improved teacher development and overhauling teacher evaluations.
State posts widest achievement gap in ‘the nation’s report card’ by Lydia Mulvany:
Steven Dykstra, a founding member of the Wisconsin Reading Coalition, a grassroots group devoted to reforming reading instruction, said the state needs to start imitating reforms in other states by training teachers more effectively. In the past, Wisconsin students ranked as high as third in the nation in reading.
“This isn’t a surprise. The last time we did well in reading was when everyone sucked at reading,” Dykstra said. “When some states started doing better, they very quickly left us behind.”
“Left behind” is precisely what the data shows is happening to Wisconsin’s black students:
Eighth graders, reading: 9% were judged proficient; 55% rated below basic, the most of any state.
Fourth graders, reading: 11% were proficient; 65% scored below basic, again the most of any state.
Eighth graders, math: 8% were proficient; 62% rated below basic, better than only three states.
Fourth graders, math: 25% were proficient; 30% scored below basic, again with only three states performing worse.
Henry Krankendonk, a retired Milwaukee Public Schools math curriculum planner and NAEP board member, said Wisconsin’s failure to narrow the disparity — which has existed for decades — is a challenge for Milwaukee in particular, because it has the highest concentration of minority students. Krankendonk said the problem has long been weak standards for what students should know, and he was hopeful that the recent adoption of new standards more in line with NAEP, called Common Core State Standards, would help.
Meanwhile, St. Norbert College Education Professor Steve Correia emphasized how well (!) Reading Recovery is working while discussing Wisconsin’s NAEP results on WPR. [5.6mb mp3 audio]
Related: Madison’s long term disastrous reading results.
Much more on NAEP over time, here.