Grade inflation continues unabated at the University of Wisconsin-Madison.
The average GPA for undergraduate students at Wisconsin’s flagship university increased to 3.48 in the recently completed fall semester — up from 3.28 just 10 years ago and close to the 3.5 midpoint between an A and B average, according to reports available from the Office of the Registrar.
Massachusetts undertook sweeping education reforms in 1993 that linked funding increases to comprehensive reforms, ranging from curriculum and accountability changes to a new three-part teacher licensure test whose pass rate was initially just 41 percent.
Today, Massachussetts has the highest performing public schools in the country. Can we do that here?
Time flies. My 2019 question to Governor Evers (Former Wisconsin Department of Public Instruction Superintendent).
The Massachusetts test is about to become the Wisconsin test, a step that advocates see as important to increasing the quality of reading instruction statewide and, in the long term, raising the overall reading abilities of Wisconsin students. As for those who aren’t advocates (including some who are professors in schools of education), they are going along, sometimes with a more dubious attitude to what this will prove.
As authorities investigate allegations that an East High School staff member fed dog food to a student, state Rep. Shelia Stubbs and other community leaders called on the Madison school district to expedite its review and release more information.
At the state Capitol Friday alongside Stubbs and others, Debra Hawkes said the staff member fed her 15-year-old son, Jaden, a can of wet dog food Feb. 13. Hawkes said her son is autistic and non-verbal.
Hawkes learned about the incident the following week and went to the high school several times asking for more information before meeting with the principal, she said.
“I should have got some answers by now. I should feel a little bit more comfort,” Hawkes said. “I do by the grace of God, but as far as Madison East High School, they didn’t give me nothing.”
Stubbs, who represents part of Madison’s east side in the state Legislature, said she was at “a complete loss of words” when she heard from Hawkes. The school district has given Hawkes the “bare minimum information,” Stubbs said.
“This is shameful, and this is unacceptable,” Hawkes said. “As a former special ed teacher, I’m appalled that this incident took place, and that families and students are suffering from mistreatment from staff and do not get the response that is necessary — and that is immediately.”
8,897 (!) Madison 4k to 3rd grade students scored lower than 75% of the students in the national comparison group during the 2024-2025 school year.
Madison taxpayers have long supported far above average (now > $26,000 per student) K-12 tax & spending practices. This, despite long term, disastrous reading results.
As it turns out, the Johnson administration wants to keep the cash-strapped city from having to make payments on these bonds for another three years. The extra amount the city is borrowing would go largely toward making interest payments on the debt through 2029.
In describing the arrangement to us, Fitch actually used the dreaded municipal-bond financing term, “scoop and toss.” As in the frowned-upon practice of refinancing existing debt and extending it into the future, thereby raising the total cost of whatever costs that initial debt was covering in the first place — a method Chicago mayors largely have eschewed since Richard M. Daley retired.
We show that large language models can be used to perform at-scale deanonymization. With full Internet access, our agent can re-identify Hacker News users and Anthropic Interviewer participants at high precision, given pseudonymous online profiles and conversations alone, matching what would take hours for a dedicated human investigator. We then design attacks for the closed-world setting.
Given two databases of pseudonymous individuals, each containing unstructured text written by or about that individual, we implement a scalable attack pipeline that uses LLMs to: (1) extract identity-relevant features, (2) search for candidate matches via semantic embeddings, and (3) reason over top candidates to verify matches and reduce false positives. Compared to prior deanonymization work (e.g., on the Netflix prize) that required structured data or manual feature engineering, our approach works directly on raw user content across arbitrary platforms.
More: And right on schedule: there goes pseudonymity on the Internet.
“There’s over 40 schools facility-wise that could possibly be closed,” Miles said. “If we did it just by the numbers, just by the data, but we’re not doing that.”
Parents and community members said they felt blindsided by the sudden announcement — a frustration many repeated during the meeting Thursday.
A 2023 study of 19 teacher preparation programs in Massachusetts underscored the need for this requirement. That study, conducted by the National Council on Teacher Quality, gave grades of D or F to 15 of those 19 programs for their literacy training, while only 3 received an A or better. Several of the state’s largest teacher preparation programs, including at Boston University, Lesley University, and UMass Boston, were among the programs receiving failing or close-to-failing grades. (A number of teacher preparation programs refused to provide data to the council. And for a new report due in June, UMass Amherst claimed that its reading curricula was proprietary information, a view that was sharply questioned by the Commonwealth’s supervisor of public records, documents show.)
8,897 (!) Madison 4k to 3rd grade students scored lower than 75% of the students in the national comparison group during the 2024-2025 school year.
Madison taxpayers have long supported far above average (now > $26,000 per student) K-12 tax & spending practices. This, despite long term, disastrous reading results.
The country’s most ambitious high-schoolers now have one more thing to fret over: crafting their “summer story.”
Overachieving teenagers have long pursued a smorgasbord of résumé-polishing summer activities. But a range of impressive summer pursuits is no longer enough, some college advisers say. Students now feel pressure to specialize—as early as their freshman summer—in interests they want to pursue in college.
The idea, college advisers say, is to assemble a list of summer pursuits that show increasing mastery in a distinct specialty. That “narrative” can help students stand out in a sea of all-rounders, they say.
So many students now have high GPAs and strong test scores that the competition has extended to the summer, said Lisa Bain Carlton, a college counselor in Austin, Texas.
“A significant differentiator is: What have you done outside the classroom? And what does it tell us about what you’re going to do at our college?” Bain Carlton said. Summer activities have always played a role in college admissions, but now “it’s like a train that’s taken off and gotten faster and faster and faster,” she said.
FIRE data shows one-third of Americans have no confidence in U.S. colleges and universities
Americans’ confidence in U.S. colleges and universities remains near historic lows. Although some have suggested that public opinion about higher education may be stabilizing or rising, our latest survey finds little evidence of meaningful recovery.Subscribe
In our latest poll, conducted in partnership with NORC at the University of Chicago, less than a third of Americans say they have “a great deal” or “quite a lot” of confidence in U.S. colleges and universities. That’s statistically indistinguishable from 2024 and 2025 levels. At the same time, almost the same proportion report having “very little” or no confidence at all.
These results stand in stark contrast to public opinion a decade ago. In 2015, 57% of Americans told Gallup they had a great deal, or quite a lot, of confidence in higher education, while just 10% expressed very little confidence. By 2018, these figures were starting to slip, with high confidence decreasing and low confidence increasing. Since then, the decline has accelerated. Compared to 2015, the share of Americans expressing high confidence has fallen by 26 percentage points, while the share expressing very little confidence has nearly tripled.
The DEI practices at America’s colleges and universities have been justly criticized for being anti-meritorious, unconstitutional, racist, and costly. However, a recent lawsuit against UCLA’s medical school suggests that its discriminatory admissions policies could potentially have negative public-health consequences, as well.
That’s quite an indictment against what has long been regarded as a premier medical school.
The Department of Justice argues that UCLA uses a “systemically racist” approach to med-school admissions.Last May, the groups Do No Harm and Students for Fair Admissions, as well as an unsuccessful white applicant, sued UCLA’s medical school, arguing that “various UCLA officials [had engaged] in intentional discrimination on the basis of race and ethnicity in the admissions process.” They have now been joined by the U.S. Department of Justice, which argues that the school uses a “systemically racist” approach in admissions, favoring Hispanic and black applicants over white and Asian ones. The government’s brief declares this to be a matter of public importance and seeks relief for future applicants who shouldn’t be forced to compete in a race-based system that may prejudice them.
The plaintiffs insist that UCLA must base admissions on individual ability and not on membership in some favored group.
Terence Tao, the legendary mathematician, explains the promise of generative AI.
Wong: What improvements are you hoping or expecting to see from generative-AI models in the next year or two?
Tao: There’s a middle ground where we want to encourage responsible AI use and discourage irresponsible AI use. It is a delicate line to tread. But we’ve done it before. Mathematicians routinely use computers to do numerical work, and there was a lot of backlash initially when computer-assisted proofs first came out, because how can you trust computer code? But we’ve figured that out over 20 or 30 years. Unfortunately, the timelines are much more compressed now. So we have to figure out our standards within a few years. And our community does not move that fast, normally.
One very basic thing that would help the math community: When an AI gives you an answer to a question, usually it does not give you any good indication of how confident it is in this answer, or it will always say, I’m completely certain that this is true. Humans do this. Whether they are confident in something or whether they are not is very important information, and it’s okay to tentatively propose something which you’re not sure about, but it’s important to flag that you’re uncertain about it. But AI tools do not rate their own confidence accurately. And this lowers their usefulness. We would appreciate more honest AIs.
The scale of the scheme is almost unfathomable; according to its latest investor reports, Amazon earned $426 billion of revenue in its 2025 North America online shopping business, which is about $3000 for every household in America. As Stacy Mitchell noted, prices for third party goods on the online platform, roughly 60% of its total sales, have been going up at 7% a year, more than twice the rate of inflation. And because this scheme impacts goods sold off of Amazon’s website as well, there’s a reasonable chance that it has had an impact on price levels overall in America. With a similar Pepsi-Walmart alleged conspiracy revealed earlier this year, it’s becoming increasingly clear that consolidation and price-fixing are linked to inflation.
How exactly does the scheme work? Long-standing readers of BIG may remember a piece in 2021 titled “Amazon Prime is an Economy-Distorting Lie” in which I laid out what’s happening. At the time, the D.C. Attorney General, a lawyer named Karl Racine, sued Amazon for prohibiting vendors that sold on its website from offering discounts outside of Amazon. Such anti-discounting provisions raise prices for consumers, and prevent new platforms from emerging to challenge Amazon.
The key leverage point for Amazon is the scale of its Prime program, which has 200 million members nationwide. As Scott Galloway noted a few years ago, more U.S. households belong to Prime than decorate a Christmas tree or go to church.
Who were Joe Haker’s students? They were what’s become known as “ghost students”: fraudsters, typically international, that apply for colleges under false or stolen identities while never intending to attend or gain a degree. The digital applications are often made easier by AI. The fraudsters portray themselves as in need of significant financial aid, wait for that aid to be disbursed, and then pocket the extra funds. They can also steal and sell student technology resources.
Fraudsters usually target fully online programs and community colleges, as it is easier for false students to slip by undetected. Mark Grant, with the Minnesota State College Faculty, said yesterday that some poor-quality work submitted by foreign ghost students is unfortunately indistinguishable with the legitimate work of some struggling students, making fraud discernment difficult for professors.
The enrollment fraud working group presented a recommendations report yesterday to the committee. Craig Munson, chief information security officer for Minnesota State, testified that the working group had created an Enrollment Fraud User Guide for Minnesota’s state colleges and universities. The User Guide, focused on cybersecurity and technical recommendations, was designed to be used by all 33 Minnesota state colleges and universities.
The working group recommended that the legislative committee expand the collaboration between higher education and the legislature by formalizing the fraud group as a standing committee and mandating a yearly fraud report to the legislature. They also recommended that fraud awareness training be provided to students and faculty members, that institutions be required to adopt the suggestions made in the Enrollment Fraud User Guide, that continued attempts at collaboration be made between the state and federal government, and that equity impact assessments take place before implementing any safeguards.
But had he not leaned into the AI transition, he might have had to lay off more people, slowly, and over time, as faster competitors went after his market share.
Just this week, Richard Axel, a Nobel laureate Columbia professor, and Lawrence Summers, the decorated economist and former Harvard president, stepped down from positions at their institutions because of their Epstein ties.
Axel said Tuesday that he would resign as co-director of Columbia’s Mind Brain Behavior Institute, calling his association with Epstein “a serious error in judgment.” Summers, meanwhile, said Wednesday that he would end his tenure as a Harvard professor at the end of the academic year. In November, he took leave from teaching duties, apologized and said he was “deeply ashamed” after the release of a batch of emails in which he asked Epstein for advice on “getting horizontal” with a woman he was pursuing.
Last week, Bard College retained a law firm to review President Leon Botstein’s ties to Epstein after the latest emails released by the Justice Department showed what appeared to be a warm personal relationship—even years after Epstein pleaded guilty in 2008 to charges of solicitation of prostitution and procurement of minors to engage in prostitution.
In a statement earlier this month, Botstein said Epstein wasn’t a friend and that his dealings with him were “only for the sole purpose of soliciting donations for the College.”
Minneapolis Public Schools (MPS) has announced changes to its Revenue Recognition practices; the move follows the dismissals of 3 senior finance ppl (incl CFO & Controller) in Dec & an increase to the deficit projection for next SY. Many indicator lights blinking red, but I want to unpack the RR piece. 1/
In March 2020, life shut down, and many couples found themselves with a little extra time on their hands. Some of them welcomed a new member of the family nine months later, and those COVID babies are now getting old enough for kindergarten—and the geography of American family life has been indelibly changed in the meantime.
Highlights
Compared to their 2019 population levels, the 20 states that voted for former vice-President Kamala Harris in 2024 saw a decline in people in their 20s and kids under 10. Post This
States with cheaper housing tend to have better luck attracting or keeping parents of young kids. The majority of these states are politically red. Post This
For states that want to remain attractive to families, it’s vital to focus on the fundamentals of good governance—affordable housing, solid job growth, and the political center rather than either extreme. Post This
As the Institute for Family Studies has highlighted, red states have higher birth rates than blue states. Red states also have seen higher rates of in-migration from other states than blue states in the years following the pandemic. There is clearly an increasing correlation between a state’s partisan valence and rates of family formation. We are seeing a kind of “big sort” of American families, which can help us predict where children will and won’t be seen and heard through the next decade.
In many ways, what happened with math instruction in the United States mirrors better-known problems with how our children have been taught to read.
As outlined in the deeply reported Sold a Story podcast, American reading instruction shifted from teaching phonics and reading fundamentals through rote practice to a more “vibes-based” approach centered on sight words and “balanced literacy” delivered in cozy classroom book corners. We chose to believe that exposing kids to good books would be enough to teach them to read and to love reading. It didn’t work.
Our trouble with math education is similar. This story hasn’t been as deeply reported yet, but it follows the same cultural trajectory. It even has a similar antihero, Jo Boaler, a professor of education at Stanford University, is seen by some in education as a ”beacon of hope.” But her critics allege that she “made bold assertions with scant evidence” which they feared would “water down math and actually undermine her goal of a more equitable education system.”
Boaler wrote a book called Math-ish that aims to help students find “joy, understanding and diversity in mathematics.” Influential in developing the pedagogical shifts that informed Common Core standards—and even in how teachers are trained to teach mathin states, like Texas, that haven’t adopted Common Core—Boaler aimed to help students experience math instruction more “broadly, inclusively, and with a greater sense of wonder and play.”
That certainly sounds more delightful than a worksheet—even akin to the reading corners with twinkle lights and beanbag chairs. But seasoned math teachers told me they see it as a dereliction of duty. (The local educators I interviewed weren’t allowed to speak on record per school district policy.)
Chicago’s credit rating was downgraded by two agencies today, a rebuke that lands squarely in the middle of an ongoing budget fight between Mayor Brandon Johnson and the City Council.
The downgrade reflects mounting concern about the city’s reliance on borrowing and one-time revenue — and serves as a “wake-up call,” said one municipal finance expert, that political infighting is compounding Chicago’s long-standing structural deficit.
Despite the warning, Johnson and the City Council coalition that passed a budget over his objections sought to shift the blame to the other, a clear sign the 2027 budget process will be just as combustible as last year.
While the Council increased the city’s advance pension payment to shore up its four beleaguered retirement systems, it also kept $449 million in borrowing for operating costs that had been included in Johnson’s proposal.
The agency also downgraded the city’s outstanding bonds, from AAA to AA+, tied to the Sales Tax Securitization Corporation, a vehicle created by former Mayor Rahm Emanuel to separate the city’s sales tax revenue from the general fund in order to borrow at lower rates. The city has increasingly relied on the STSC for new bond issuances.
KBRA, another credit rating agency, also downgraded the city’s general obligation bonds and assigned a BBB+ rating, just above non-investment grade status, to the upcoming sales.
New documents — made public for the first time — show in greater detail how Epstein tried, and often succeeded, in influencing almost every level of the criminal justice system that threatened to disrupt his sex trafficking and money laundering empire.
Epstein’s efforts to corrupt the justice system is important because, had some of these figures rigorously investigated and monitored Epstein, he may not have been able to continue to sexually abuse women and girls for another decade.
This story is based on a Miami Herald review of thousands of documents released by the Justice Department, court records and interviews with key people involved in the Epstein case.
The documents — released in response to the Epstein Files Transparency Act passed by Congress last year — reveal how Epstein wooed state and federal prosecutors, assistant district attorneys, sheriff’s deputies, probation officers, federal marshals and customs and border patrol officers.
In addition to its tension with underlying constitutional principle, this is almost certainly a counterproductive response to populist challenges. Bollinger’s response to collapsing trust is to insist that citizens and their direct or indirect representatives are entitled to only a nominal role in the direction of institutions that claim to act in their interest and spend money derived from taxes they pay. Rather than defusing the issue, he vindicates suspicion that academics believe they are philosopher kings.
Bollinger is also wrong to suggest that the status of a “branch” of government confers independence from the other branches. At one point he suggests that university presidents called before congressional committees should conduct themselves in a manner comparable to Supreme Court justices, who generally refuse to comment on their rulings in particular cases. Bollinger does not mention that Supreme Court justices are nominated by elected presidents, confirmed by elected senators, and subject to removal if their conduct is found outrageous. Judges are permitted a high level of discretion because they have been chosen and assessed by members of other branches, and because their personal conduct and institutional budgets are subject to external judgment. Bollinger is presumably not encouraging similar constraints on faculty members and administrators, which would go beyond even the oversight exercised by state governments over public universities.
What Bollinger really seems to have in mind for the academy is not a component of republican government at all. His discussion of “the university’s role as the fifth branch of the nation” evokes the medieval idea that the political community is divided into distinct “estates” that cooperate for certain purposes but are primarily accountable to their own members. Given the medieval origins of the university, it’s not surprising that there’s an affinity between the concepts. Still, a conception of the academy as an autonomous estate or guild is hard to square with a Constitution authorized by an undivided “we, the people.”
The government’s January 2025 Current Population Survey (CPS) shows the foreign-born or immigrant population (legal and illegal together) hit 53.3 million and 15.8 percent of the total U.S. population in January 2025 — both new record highs. The January CPS is the first government survey to be adjusted to better reflect the recent surge in illegal immigrants. Unlike border statistics, the CPS measures the number of immigrants in the country, which is what actually determines their impact on society. Without adjusting for those missed by the survey, we estimate illegal immigrants accounted for 5.4 million or two-thirds of the 8.3 million growth in the foreign-born population since President Biden took office in January 2021. America has entered uncharted territory on immigration, with significant implications for taxpayers, the labor market, and our ability to assimilate so many people.
Highlights from the January 2025 data include:
At 15.8 percent of the total U.S. population, the foreign-born share is higher now than at the prior peaks reached in 1890 and 1910. No U.S. government survey or census has ever shown such a large foreign-born population.
——-
Meanwhile, foreign-born employment has been written UP by about 800,000 since Nov 2024 and now stands only about 100,000 less than on Liberation Day (rather than 670,000 loss).
Wisconsin homeowners face one of the heaviest property tax burdens in the country, according to a new report from WalletHub.
The personal finance website compared property tax rates in all 50 states and the District of Columbia by using U.S. Census Bureau data, which it said shows the average U.S. household pays $3,119 a year in property taxes on their home.
“Some states charge no property taxes at all, while others charge an arm and a leg,” said Chip Lupo, a WalletHub analyst. “Americans who are considering moving and want to maximize the amount of money they take home should take into account property tax rates, in addition to other financial factors like the overall cost of living, when deciding on a city.”More: Journal Sentinel, experts answer data center questions at town hall
In Wisconsin, lawmakers have been trying to make a deal to lower surging property taxes. Assembly Speaker Robin Vos, a Republican, said Feb. 20 that it’s “very likely” lawmakers will return to pass a tax relief package in special session.
Gov. Tony Evers, a Democrat, said during his Feb. 17 State of the State addressthat he wouldn’t accept an earlier proposal from Republicans because it didn’t include a key demand: routing hundreds of millions in funding for a revenue stream for schools known as general school aids, which would also lower property tax rates.
8,897 (!) Madison 4k to 3rd grade students scored lower than 75% of the students in the national comparison group during the 2024-2025 school year.
Madison taxpayers have long supported far above average (now > $26,000 per student) K-12 tax & spending practices. This, despite long term, disastrous reading results.
The FBI subpoenaed records of phone calls made by Kash Patel and Susie Wiles, now the FBI director and White House Chief of Staff, when they were both private citizens in 2022 and 2023 during the federal probe of Donald Trump, Patel told Reuters on Wednesday.
Reuters is the first to report on the FBI’s actions that took place during the Biden administration, largely when Special Counsel Jack Smith was investigating whether Trump had interfered with the 2020 election and had hidden classified documents at Mar-a-Lago, according to Patel. Smith was appointed to take over that probe in November 2022.
New York State leads the nation in education spending—more than $33,000 per-pupil, 91 percent above the national K-12 average. Yet according to a recent survey, most parents don’t know how much the state is shelling out.
50CAN, an education-advocacy group, recently released the second edition of its report on the “State of Educational Opportunity in America.” The report contains the results of the group’s survey of 23,000 parents across 50 states.
One question, which did not make the final report, asked parents to estimate how much is spent on each student in their state. New York’s results were shocking: Forty percent of the 415 respondents were “not sure,” while 29 percent guessed “less than $5,000.” Only 1 percent guessed the range (“$35,000 to under $40,000”) that accurately characterized last year’s per-pupil average ($36,293).
Why such a drastic underestimate? One possible explanation is the combination of declining student enrollment and a lack of clear academic improvements. Schools keep shrinking, and student performance hasn’t budged—so how could the state be leading the country in education spending?
“This disconnect between what’s spent and what people think is spent is longstanding in [New York]. The teachers’ unions and others have a self-interest in that narrative, so they can always ask for more and always blame the results on ‘scarce resources,’” Derrell Bradford, president of 50CAN, told me. “The truth is, after the pandemic, there are fewer students and more money in the system than there has ever been. It’s a shame kids aren’t getting the benefits while parents are kept in the dark about it.”
New York State has led the nation in per-pupil spending for 19 consecutive years. And no other large urban district spends nearly as much per student as New York City. In fiscal year 2022, for example, Gotham spent$38,163 per pupil, compared with $23,314 in second-place Los Angeles.
BREAKING: I’m suing the Trump Administration to challenge their illegal overhaul of the @CDCgov’s long-standing recommendations for children’s vaccinations.
A man takes a train from London to the coast. He’s visiting a town called Wulfleet. It’s small and old, the kind of place with a pub that’s been pouring pints since the Battle of Bosworth Field. He’s going to write about it for his blog. He’s excited.
He arrives, he checks in. He walks to the cute B&B he’d picked out online. And he writes it all up like any good travel blogger would: in that breezy LiveJournal style from 25 years ago, perhaps, in his case, trying a little too hard.
But as his post goes on, his language gets older. A hundred years older with each jump. The spelling changes. The grammar changes. Words you know are replaced by unfamiliar words, and his attitude gets older too, as the blogger’s voice is replaced by that of a Georgian diarist, an Elizabethan pamphleteer, a medieval chronicler.
The Las Vegas Metropolitan Police Department (LVMPD) quietly entered an agreement in 2023 with Flock Security, an automated license plate reader company that uses cameras to collect vehicle information and cross-reference it with police databases.
But unlike many of the other police departments around the country that use the cameras in their police work, Metro funds the project with donor money funneled into a private foundation. It’s an arrangement that allows Metro to avoid soliciting public comment on the surveillance technology, which critics worry could be co-opted to track undocumented immigrants, political dissidents and abortion seekers, among others.
“It’s a short circuit of the democratic process,” Jay Stanley, a Washington D.C.-based lawyer for the American Civil Liberties Union (ACLU) who works on how technology can infringe on individual privacy and civil liberties, said in an interview with The Nevada Independent.
36 years of geopolitical intelligence preserved and structured for analysis. Every country, every field, every edition — parsed from the original CIA publications into a searchable, queryable archive.
If you are wondering if this is in addition to the $500 million that the Los Angeles Unified School District borrowed less than a year ago to settle sexual misconduct claims, the answer is yes, the $250 million is in addition to the $500 million.
Experts say this will end up costing taxpayers more than $1 billion.
——-
200 Wisconsin teacher sexual misconduct, grooming cases shielded from public.
“Lowering standards, eliminating standardized tests, inflating grades… We’re not building better students, we’re just disguising mediocrity. Real education demands honesty.”
More than 8% of incoming students at UC San Diego need remedial math classes — despite having passed calculus or statistics in high school. That should worry us a lot.
I am grateful to Michael S. Roth for taking the time to read my work, and for sharing his views on what I’ve written. I have admired much of his recent writing on higher education, particularly his eloquent criticism of the threats posed to academic freedom by the Trump administration. He is right that the government’s efforts to influence American universities in a more favorable ideological direction by withholding federal dollars is a form of soft “extortion.” I am surprised, then, that he is not troubled by the Mellon Foundation’s efforts to exert political pressure on American colleges and universities by offering badly needed humanities grants in exchange for ideological conformity.
I am surprised, too, that Roth is more distressed by what he takes to be my mocking tone than he is by what is detailed in my reporting: that scholars, desperate for funding, have had to politically contort their work in a bid to keep their research afloat, and that the many grant administrators I spoke with, some of whom have worked with Mellon for decades, described near uniform concern about Alexander’s leadership and its deleterious effect on the humanities and their own institutions.
As for the comparison Roth draws between myself, a left-leaning black writer whom he disagrees with on matters of educational policy, and the late Republican Senator Jesse Helms, a notorious anti-black segregationist, I’ll simply note: The Mellon Foundation provided Wesleyan $1 million for “interdisciplinary leadership training” in “antiracism practices” in 2020. I do not believe in these sorts of initiatives myself, but since Roth does, perhaps if any of that money is left over, he can use it on a racial sensitivity consultant.
For lots of young people, career paths feel like conveyor belts—the next test, the next application, the next college—without a pause to ask what they really want to do with their lives. After Gurley went to college, he landed a job at a famous tech company. A dream job, right? But he was bored, so he took a chance and leapt into the unknown, eventually finding his place in the world of venture capital.
We recently surveyed 24,000 parents around the United States. One question we asked is on a lot of parents’ minds: how difficult is parenting? Many parents feel stressed or burdened by raising kids and would like to make it easier: 7.4% of parents in our survey say parenting is “very hard,” and 36.5% say it is “fairly hard.” We wondered if our data could point to ways in which parents could lighten their own load—both because we think parents could use a break, and because parents who describe parenting as easier are likelier to say they will have more children. Controlling for the number of kids, 48% of those who say parenting is very easy intend more children, vs. 38% of those who say parenting is fairly easy, 35% of those who say parenting is fairly hard, and 33% of those who say parenting is very hard. When parenting is too hard, fewer children are born.
Highlights
Parenting feels easier when parents feel their partners and the surrounding community are more supportive, per new IFS survey. Post This
Parental-enforced rules are associated with better relationships with kids, both in the parent’s own assessment and in the assessments of the teens we surveyed. Post This
For dads, parenting feels hardest when kids are under 2, and easiest when kids are 9 to 11. For moms, parenting tends to feel easiest when kids are under 2, and hardest when kids are 4 to 7. Post This
And here’s what Pearson is alleged to have done according to a criminal complaint as part of formal charges brought against her last week. She and a friend, Brandi Grayson, were out together just before Christmas. At about 11 PM they parked in a loading zone behind a theatre. When a security guard asked them to move they refused and verbally abused the guard. Grayson, who was driving, moved the car toward the guard in a way that he felt was threatening.
The theatre manager came out and again asked them to move the vehicle. They refused and in fact drove over some cones placed to mark off the no parking area. At one point Grayson called the manager a “Karen” and a “fat, white (expletive).”
It’s important to pause here and point out that back in 2020 during the incident Skidmore was apparently falsely accused of, Mayor Satya Rhodes-Conway issued a statement saying in part, “No words of gender-based violence should ever be uttered by anyone, period, No profanity should be used towards members of the body and no such language, verbally or otherwise, should be used against anyone in our community.” And yet, the Mayor has had nothing to say about the incident involving Grayson.
8,897 (!) Madison 4k to 3rd grade students scored lower than 75% of the students in the national comparison group during the 2024-2025 school year.
Madison taxpayers have long supported far above average (now > $26,000 per student) K-12 tax & spending practices. This, despite long term, disastrous reading results.
In the $94 billion North American ed-tech market of 2026, Curriculum Associates stands as a dominant pillar. Founded in 1969, the firm operated for decades as a sleepy, also-ran textbook publisher before pivoting to the nascent e-learning market in the late aughts. Today, the company is a private-equity-backed juggernaut with more than 2,700 employees and $750 million in annual revenue — derived overwhelmingly from America’s taxpayer-funded public schools.
Curriculum Associates’ flagship product is i-Ready. First launched in 2011, it has evolved into two tightly intertwined screen-based products. i-Ready Inform is the diagnostic half: standardized “adaptive” tests given three times per subject annually. The other half is i-Ready Learning, which translates each student’s i-Ready Inform scores into algorithmically generated lessons called “My Path.” This takes the form of gamified multiple-choice math and English questions delivered by infantile cartoon characters with names like “Yoop Yooply” and “Snargg.”
“Gamified multiple-choice math and English questions [are] delivered by infantile cartoon characters with names like Yoop Yooply and Snargg.”
Taylor worked for Planned Parenthood as a lawyer before she became a judge.
“[Taylor] played a central role in advancing reproductive health and rights by shaping landmark legal and policy strategies to protect and expand access to contraception and family planning. She built and defended Wisconsin Medicaid’s family planning program, developed successful court and legislative strategies to secure contraceptive equity and prevent prescription denials, and helped elect pro-Planned Parenthood leaders statewide,” Planned Parenthood said in a statement.
Planned Parenthood added that they have a vested interest in Taylor’s election.
Federal authorities raided the home and office of Los Angeles Unified School District Supt. Alberto Carvalho on Wednesday morning, the FBI confirmed.
Law enforcement sources, who requested anonymity because they were not authorized to speak publicly, told The Times that the federal investigation specifically involves Carvalho. However, the precise motivation for the searches at his San Pedro home and LAUSD headquarters was not immediately clear.
FBI agents also searched a residence in Southwest Ranches, a town in Broward County, Fla., in connection with the investigation and have since cleared the scene, according to an FBI spokesman in Miami. Sources told The Times that the property is associated with Carvalho.
The FBI declined to share more information, citing the fact that the affidavits have been sealed by the court. Sources familiar with the probe said that the focus was Carvalho as opposed to the LAUSD, and that it would fall under the broad category of financial issues.
On the evening of Jan. 15, 26 undergrads gathered for dinner in a common room at the University of North Carolina at Chapel Hill to debate the fairness of college admissions post-affirmative action. The ground rules were clear: Nothing they said would leave the room. Nobody would be shouted down. No one would get ratted out on social media as “problematic.”
The students went at it with gusto. First-years from Hungary and Turkey lamented the systems in their home countries, where admissions are based purely on standardized tests rather than their interests or extracurriculars. A Black student from in-state criticized admissions based on test scores and GPAs for different reasons; given sharp disparities in secondary schools and family resources, some kids were already at a disadvantage. A couple of students praised the end of affirmative action, which they described as inherently unjust. The dinner officially wrapped up after an hour, but rather than dash out, most students stuck around, continuing the discussion in small clusters.
“A lot of us have memories from college of late-night conversations debating every topic under the sun, and a lot of students have felt as though that’s missing,” UNC’s chancellor, Lee Roberts, said in an interview. Students today, he explained, are looking for “the chance to debate a topic without debating whether you’ve somehow said the wrong thing.”
All this was taking place at CivComm, a residential hall affiliated with a program at UNC called the School of Civic Life and Leadership (SCiLL). The school, which opened in 2023, is part of a larger nationwide civic-thought movement, led by a mix of political conservatives, academic traditionalists and liberals alarmed by progressive overreach. The goal is to push back on what proponents see as an academic culture that has lost sight of the purpose of a liberal arts education—and to do so from within the university. On many campuses, they’ve encountered strong resistance.
The next day, the American Medical Association — which has long approved of such procedures — announced that “in the absence of clear evidence, the A.M.A. agrees with A.S.P.S. that surgical interventions in minors should be generally deferred to adulthood.”
Gov. Gretchen Whitmer’s 2027 budgetproposes the fewest number of state government jobs she has asked the Legislature to fund in four years, despite a request for nearly 1,000 new health department workers to cope with new federal mandates.
Whitmer’s slimmed-down state workforce request suggests that House Speaker Matt Hall’s 2025 war on thousands of funded but unfilled positions in Michigan government is having an impact beyond the 2026 budget, approved last October. That budget funded 1,788 fewer “full-time equivalent” (FTE) positions in state government than were approved for 2025, and 2,670 fewer than Whitmer initially requested for 2026, records from the State Budget Office show.
English has hundreds of thousands of compound phrases that name things—not just describe them. “Boiling water” isn’t “water that happens to be boiling.” It’s a hazard, a cooking stage, a state of matter. Yet traditional dictionaries skip almost all of them, because they contain spaces. Merriam-Webster and Oxford cover about 3%.
I got interested in this because I make word games—and wanted to understand which phrases have enough weight to count as vocabulary, and why dictionaries trained us to think they don’t.
Here’s a slider. Look at expressions at different familiarity levels. Gold words are missing from traditional dictionaries:
Crowd-sourced Wiktionary has 16 times more headwords than Merriam-Webster’s already hefty tabletop book. Yet even Wiktionary leaves gaps.
Just a brief announcement that I have been working with Quanta Books to publish a short book in popular mathematics entitled “Six Math Essentials“, which will cover six of the fundamental concepts in mathematics — numbers, algebra, geometry, probability, analysis, and dynamics — and how they connect with our real-world intuition, the history of math and science, and to modern practice of mathematics, both in theory and in applications. The scheduled publication date is Oct 27, but it is currently available for preorder.
Exactly ten years ago, during an Israel-Hamas war that seemed major at the time but seems minor now, I published two essays describing my time reporting on Israel for the Associated Press. “Is there anything left to say about Israel and Gaza? Newspapers this summer have been full of little else,” I wrote at the time. “Television viewers see heaps of rub…
“This is a constitutional challenge to the deficiency of the state public finance system for our schools,” said Jeff Mandell, president of Law Forward, the firm representing the plaintiffs. “Despite heroic efforts that have held our schools together for as long as they’ve made it under this deficient funding, it’s not enough. These folks are not magicians.”
The complaint also alleges lawmakers are breaking the law by using taxpayer dollars to pay for private voucher schools while not meeting their constitutional obligation to fund public schools.
……
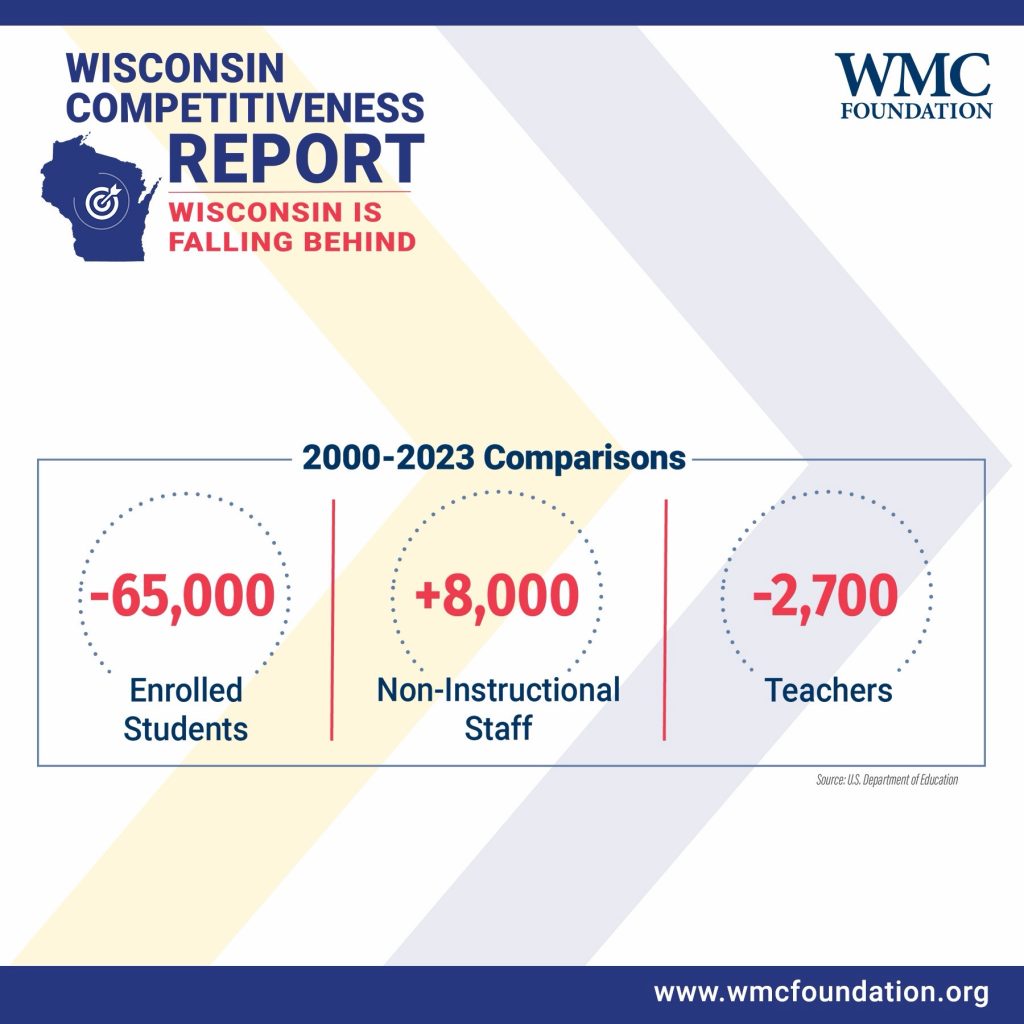
In the 1999–2000 school year, public schools were funded mostly by the state, 53.7 percent. Local tax dollars funded 41.6 percent and 4.7 percent came from the federal government, according to the complaint.
By 2023–24, the most recent year of available data, that mix had shifted to 45 percent state, 43 percent local, and 12 percent federal.
Wisconsin Teachers Unions File Lawsuit to Raise Taxes for “Education.”
Between Evers’s 400-year veto and this new Teachers Union Tax, no one is going to be able to afford a home in Wisconsin. Will Wisconsin courts allow it?
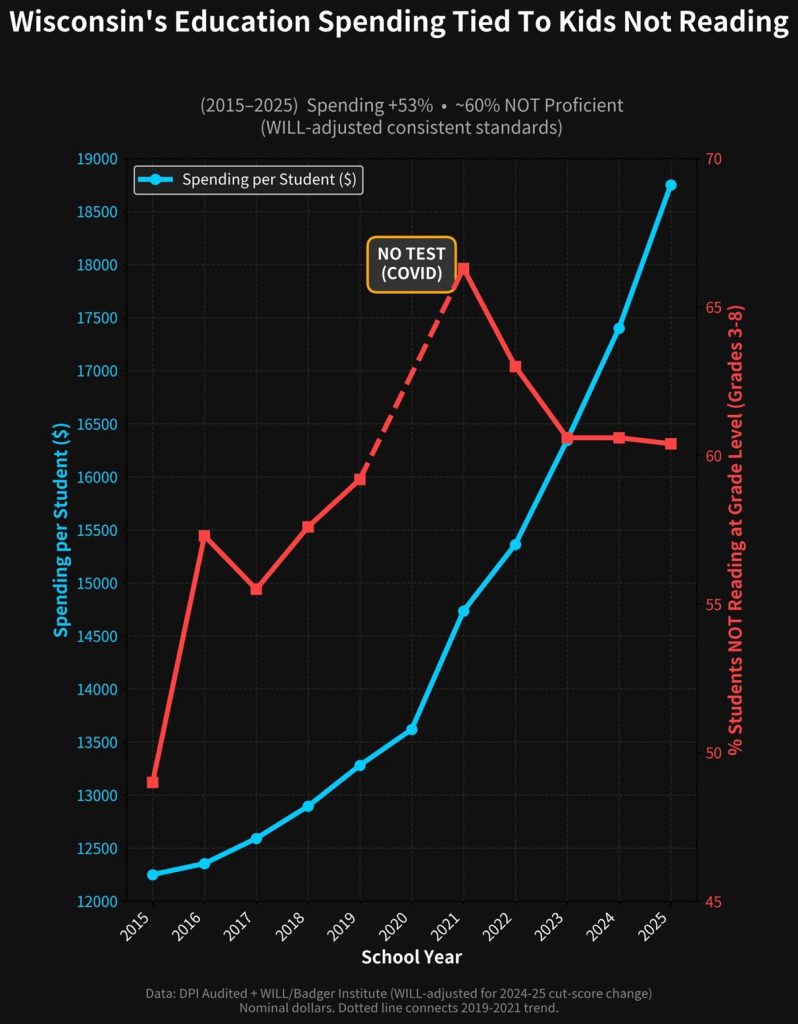
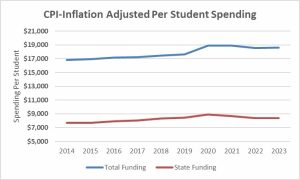
This lawsuit is based on a faulty premise. Adjusted for inflation, the state is spending MORE on public schools than a decade ago ($7,693 in ’14 versus $8,361 today). Overall spending has jumped even more to $18,592 per student from $16,820 (1/3).
Decisions about how to fund schools and in what amount are for the legislature and governor, not the courts. Besides being based on false premises, this is nothing less an attack on our constitution and democracy. All on behalf of powerful special interests. Shame.
Ironic for Superintendent Underly to write that public schools promise democracy when the lawsuit filed yesterday effectively asks the judicial branch to do the job of the legislature.
8,897 (!) Madison 4k to 3rd grade students scored lower than 75% of the students in the national comparison group during the 2024-2025 school year.
Madison taxpayers have long supported far above average (now > $26,000 per student) K-12 tax & spending practices. This, despite long term, disastrous reading results.
The School Board approved a $4.9 million purchase of new math curriculum for kindergarten through eighth grade Monday after a task force concluded some of the district’s current instructional materials are “outdated.”
School district administrators say the curriculum from Arizona-based Illustrative Mathematics checked many of their boxes after a thorough selection process, and a nonprofit that reviews instructional materials gives it strong ratings.
However, Illustrative’s curriculum has promptedbacklash in New York public schools in recent years, becoming tangled in “math wars” debates about the best way to approach teaching the subject.
The Madison Metropolitan School District declined to comment on the curriculum or the criticisms of Illustrative before the School Board voted to approve it Monday.
The proposal followed a recommendation from the district’s Math Task Force to replace elementary and middle schools’ math instructional materials in November. Some of the curriculum in middle schools hasn’t fully met national standards for what students should learn at their grade level, requiring schools to fill in the gaps with other materials, the task force found.
AI is dramatically better than it was a year ago. New models have emerged that are not just incrementally improved but fundamentally more capable.
That part is clear. What hasn’t changed requires a longer conversation.
What Has Not Changed
Direct Instruction Remains Critical for Improving Student Outcomes
Direct Instruction in the Engelmann tradition remains the most effective method of teaching we have — not because the evidence is beyond dispute, but because it follows the discipline of engineering: analyze, design, field-test, evaluate, revise — the same cycle that produces reliable software, bridges, and aircraft. Engelmann did not start with ideology and then try to make kids fit it. He started with a logical analysis of the stimuli and the kids’ behavior — their responses, their performance, their errors — and kept iterating until they learned. Cognitive science and the broader science of learning have spent more than 50 years confirming what this process produced, through both direct and indirectresearch. Whether by analog or by digital, by script or by screen, we must teach students effectively and efficiently, using principles of learning science and instructional design.
Most Schools Lack a Coherent Curriculum
However, most schools don’t even have an articulated, sequenced, cumulative curriculum. What they have is at most a patchwork, or something that lives in the head of individual teachers. It leads to teaching that is built on sand — it is almost irrelevant whether a teacher teaches explicitly or not when what is taught is random slop that was Googled or generated by AI the night before. And it all just keeps moving. A student who failed to master a prerequisite skill three months ago has no mechanism to recover, because the curriculum doesn’t build or circle back. There is also zero transparency — as a parent or a consultant, trying to find out what is being taught in a given grade for a given subject is like going on a scavenger hunt, where at every turn you’re told to just trust the process. This isn’t for kids. This is because the adults can’t get their act together.
8,897 (!) Madison 4k to 3rd grade students scored lower than 75% of the students in the national comparison group during the 2024-2025 school year.
Madison taxpayers have long supported far above average (now > $26,000 per student) K-12 tax & spending practices. This, despite long term, disastrous reading results.
A majority of Vermont’s students are “well below” math and English language arts proficiency goals, while the state’s public education system “is not yet consistently delivering strong and sustained outcomes for all students.”
That’s according to the Vermont State Report Card, the Vermont Agency of Education’s annual assessment of student and school performance. Released on Thursday, the report found that a majority of Vermont’s students during the 2024-25 school year were “not yet meeting grade-level academic standards.”
Meanwhile, more than half of Vermont schools fell below performance expectations too, and saw either stagnant or declining student performance, according to the report.
Erin Davis, the Agency of Education’s chief academic officer, said in a press release that the results “are a clear signal that our current student outcomes are not where they need to be.”
“It is our collective responsibility to confront these challenges head-on and ensure every Vermont student receives the high-quality education they deserve,” Davis said.
Alarmed by her daughter’s desperation and frustration, Coleman started looking beyond the report cards, which had consistently shown adequate progress. What she found surprised her. In eighth grade, she learned, her daughter couldn’t read an analog clock. She didn’t understand basic fractions or how to turn them into percentages. She didn’t know her multiplication tables. Middle school math was getting more difficult, but she didn’t have the foundational skills necessary to do harder computations. Her struggles would only get worse.
A group of middle school Midland Independent School District (MISD) teachers, who didn’t speak on the record due to district policy, told me they are not surprised: They see the same thing every day. (I reached out to the district for comment but did not receive a statement before publication.)
One teacher said many middle school students arrive in her classroom unable to understand the difference between multiplication and division. Other students don’t understand a number line or positive and negative numbers. Many have no fluency in basic math skills, yet they’ve continually been passed to higher grades.
Judge John D. Hyland denied 3 motions: vacate, recuse, and set over. He actually stated in his opinion: “The Court finds no grounds to disqualify or recuse itself.”
Here’s the 34 page Report by forensic expert Natalie Schilling, Ph.D., demonstrating the egregious ghostwriting of ex-Judge Frank Remington, passed off as the work of Judge Hyland. Read it and you be the Judge!
Judge John D. Hyland admitted in chambers that he had not even finished reading the briefs when his law clerk, Andrew Remington, delivered a finished draft decision. Andrew’s father, a former Dane County judge, Frank Remington, Jr., is the individual the evidence points to as the author. Father and son live together.
“Right now, we only rate 18 out of 435 races as toss ups, which means that less than 5% of Americans will truly be deciding who’s in control of the House,” David Wasserman, senior elections analyst for the Cook Political Report, told NPR.
This disparity in the voting power of Americans in congressional races has been a worsening problem for several election cycles.
Unite America Institute, which tracks what it refers to as the “primary problem” and advocates for election reforms, calculated that in 2024, just 7% voters elected 87% of U.S. House races.
Voters have self-sorted themselves geographically, and technology in recent years has allowed lawmakers to more effectively carve up congressional districts that give one party an advantage over another.
Nick Troiano, executive director of Unite America, said the mid-decade redistricting prompted by Trump last year has further reduced the number of competitive seats. His organization says 32 states currently don’t have a single competitive congressional race.
Nearly three-quarters of Wisconsin’s teacher workforce is female, data from the Department of Public Instruction show — a proportion that has increased over time.
The figures count the number of teachers in the DPI’s publicly accessible All Staff Report, labeled by sex. This includes teachers at traditional public schools as well as district and independent charter schools but does not include teachers at private institutions.
In 1994-95, the earliest school year for which data are available, the public teacher workforce was about 67.6 percent female. Over time, that level has increased, stabilizing around three-quarters. In 2025, 74.8 percent of teachers were women.
One can glean much from these titles and their authors’ backgrounds. First, you don’t find words like those from the MLA titles Hillard highlights—e.g., “goofing,” “radical,” “politics,” or the like. This isn’t due to selection bias on our part. The titles cited here make up about 25 percent of last year’s program, and we invite readers to review this and all archived programs. The academic backgrounds of the presenters are important to the point. The philosophy participants have made a huge time investment in their educations and careers, not only to have (or to soon have) Ph.Ds. in philosophy but, in many cases, especially among our more junior presenters, to have also earned master’s degrees in a brain science. This means that they have not just gotten textbook knowledge but have gained experience in neuroscience research labs. And our neuroscientist presenters have developed a willingness to engage with philosophers, some having done so for many years.
Our participants spend their professional lives exploring how classical philosophical questions about the mind might fruitfully be addressed by neuroscience findings.In short, our participants have training and interest across two fields, one a humanities discipline and the other a STEM. They did not invest this kind of time and energy to talk about “Transcending Embodied Gender Norms” (one of Hillard’s MLA examples). Instead, they spend their professional lives exploring how classical philosophical questions about the mind might fruitfully be addressed by neuroscience findings; they’re thinking hard about the brain sciences’ methodologies and technologies; and they’re exploring how philosophy’s rigor can lead to better neuroscience experiments and analyses. And so are the participating neuroscientists, shoulder to shoulder with the philosophers.
No one would benefit more from school choice than minority communities in Mississippi. While the state has impressively raised educational standards in recent years, black and Hispanic kids are still more likely to attend the lowest-performing schools. More than half of black families in the state backed universal school choice in 2024. But neither Democrats nor Republicans have listened to the will of the people.
Something in the Magnolia state needs to change. Maybe it will happen in the 2027 elections when every member of both houses of the Mississippi Legislature runs for re-election. About three-quarters of GOP primary voters in Mississippi backed the school-choice bill that just failed, according to a recent poll from the American Federation for Children. They may want to rally around new leaders who will actually fight for families and freedom. That’s what Texas voters did in 2024, and now that state has universal school choice, too.
Nothing would help more than attention from Mr. Trump. He should call on Mississippi Republicans to reverse their foolish decision. Even better, he could tell them to get with the program or make room for leaders who will. That message could be the spark that lights a thousand pro-school-choice primary challengers worthy of a presidential endorsement.
David J. Farber, a gregarious professor of computer networks who was sometimes called the “grandfather of the internet” because of the ultimately groundbreaking students he trained, died on Feb. 7 in Tokyo. He was 91.
His son Emanuel said the apparent cause was heart failure. Professor Farber had been teaching at Keio University in Tokyo since 2018.
When Professor Farber started his career in the mid-1950s, at Bell Laboratories, computers were practically islands unto themselves. If they communicated at all, they talked by means of a Teletype or punch card reader down the hall.
Since then, thanks in part to his work, the realms of communication and computation merged into that one powerful glue for society that is the internet; The New York Times once described him as “an early architect” of it.
They will have to push back against a core constituency within the Democratic Party that often makes government deliver less and cost more: unions representing teachers, police officers and transit workers.
Democrats have long accepted inefficiencies as the price of support from public sector unions, and this may seem the worst time to demand better. Confronted with the president’s cruelty and lawlessness, the unions have been inspiring: defending wrongly fired workers, fighting federal overreach and organizing against ICE brutality.
But it’s precisely because of increasing authoritarianism that Democratic governors and mayors need to show the public that they can deliver. With the president weaponizing budget cuts against blue states, there is little room for error. Democrats need a new bargain with public sector unions — one that respects their voices and livelihoods but puts public services first.
Begin with the cost of government. Blue-state and blue-city voters pay higher taxes. More than half of city and local government expenditures (and 20 percent of state expenditures) are paid out to employees. These blue states and cities oftenalsopay state and local government workers more than similar jobs pay in red jurisdictions, even after adjusting for the cost of living.
Much of this gap is tied up in pension benefits. Workers generally valuehigherwages today more than retirement guarantees in the future. But pensions are attractive to politicians who pass future costs to future taxpayers. And it is the job of unions to fight for the largest benefits they can.
———
“The new [Chicago pension] law will cost the city $60 million next year — more than enough money to cover the city’s summer job program — before ballooning to $11 billion over three decades. Because of Illinois’s Constitution, the commitments cannot be reversed.”
Complex system insulates districts that agree to raise taxes the fastest
You might be paying higher school property taxes this year because of a referendum to exceed a school district’s revenue cap — one that you did not get a vote on in a district your kids do not attend.
That’s because of the structure of Wisconsin’s school levy tax credit, under which property owners in some school districts have seen their school levy tax credits shrink to subsidize additional spending in other districts where they have no vote and no representation.
Knuth then enumerated his motivations, as a computer scientist, to read the history of science. First, reading history helped him to understand the process of discovery. Second, understanding the difficulty and false starts experienced by brilliant historical scientists in making discoveries that specialists now find obvious helped him to see what made concepts challenging to students and thus to become a “much better writer and teacher.” Third, appreciating the historical contribution of non-Western scientists helped in “celebrating the contributions of many cultures.” Fourth, history is the craft of telling stories, which is “the best way to teach, to explain something.” Fifth, the biographies of scientists teach tactics for a successful and rewarding career. Sixth, history teaches how human experience has changed over time. As humans we should care about that.
Knuth also identified some special contributions to the history of science that professionally trained historians are uniquely well placed to make. We are good at “smoking out” primary sources and putting historical activities in the context of broader timelines. He also appreciates our ability to translate papers written in languages that he cannot himself read. He finds attempts at historical analysis “probably the least interesting” aspects of our papers but appreciates lengthy quotations from primary sources.
Asked point-blank why the US dominates tech while Europe stagnates, the Senator pivoted to healthcare and homelessness. The honest answer would destroy his worldview.
Stanford Economics researcher Sid Gundapaneni (@MacroscopeEcon on X) asked Bernie Sanders a simple question: “What institutional or economic features explain this difference?” between US and European tech innovation. Europe has produced zero of the world’s ten largest frontier tech firms. America dominates.
Bernie’s response was textbook evasion.
He never answered the question. He couldn’t. Because the honest answer would require admitting that European-style redistribution correlates with zero frontier tech companies.
As high school approached, Cancelleri decided that wasn’t enough. He paid about $20,000 for his son, a straight-A student, to repeat a grade at a private middle school sports academy.
“The draw to it [was] just giving him a little bit of extra time to develop and mature,” said Cancelleri, whose 15-year-old son, Carter, has grown about 3 inches since August and hopes to be a strong competitor next year as a high school freshman.
Sixty other boys are repeating a grade at the same academy, The Togethership, where coursework includes throwing mechanics, game film review and nutrition along with traditional subjects such as Algebra and English.
He said Gen Z is the first generation in modern history to score lower on standardized tests than the previous one.
While skills measured by these tests, like literacy and numeracy, aren’t always indicative of intelligence, they are a reflection of cognitive capability, which Horvath said has been on the decline over the last decade or so.
Citing Program for International Student Assessmentdata taken from 15-year-olds across the world and other standardized tests, Horvath noted not only dipping test scores, but also a stark correlation in scores and time spent on computers in school, such that more screen time was related to worse scores. He blamed students having unfettered access to technology that atrophied rather than bolstered learning capabilities. The introduction of the iPhone in 2007 also didn’t help.
“This is not a debate about rejecting technology,” Horvath wrote. “It is a question of aligning educational tools with how human learning actually works. Evidence indicates that indiscriminate digital expansion has weakened learning environments rather than strengthened them.”
8,897 (!) Madison 4k to 3rd grade students scored lower than 75% of the students in the national comparison group during the 2024-2025 school year.
Madison taxpayers have long supported far above average (now > $26,000 per student) K-12 tax & spending practices. This, despite long term, disastrous reading results.
An upstate New York high school teacher was allegedly sidelined after she agreed to advise a Turning Point USA chapter on campus.
Jennifer Fasulo, a Spanish teacher at Charles W. Baker High School in Baldwinsville, a Syracuse suburb, was placed on a paid leave of absence on Jan. 30, just weeks after she offered to help students establish a Club America, the high school division of the Charlie Kirk co-founded conservative group, her supporters say.
“The district can confirm that a staff member has been placed on paid administrative leave while a matter is under review. We are following established administrative and legal procedures, and we are unable to comment further or share additional details at this time,” the Baldwinsville Central School informed parents in a Feb. 10 letter.
“We need to go in a socialist direction” to build what he praises elsewhere as a socialist “intellectual apparatus” like the ones in Cuba and China, because that’s where he says you get the “real state power necessary to fully educate the people.”
which occurred in the third century B.C.E. This conflict was part of the series of wars between Rome and Carthage, an ancient city in modern-day Tunisia.
Study co-author Agustín López Jiménez, an expert at the archaeology company Arqueobética, which excavated the site, told El Pais that researchers found the elephant foot bone beneath some collapsed adobe walls dating to around the third century B.C.E. According to the study, the same area revealed 12 three-pound stone balls, which were “unquestionably artillery projectiles for lithoboloi,” a kind of catapult.
The Second Punic War began after Hannibal attacked Saguntum, a city on the Iberian Peninsula that had allied with Rome. When Carthage refused to withdraw, Rome declared war in 218 B.C.E.
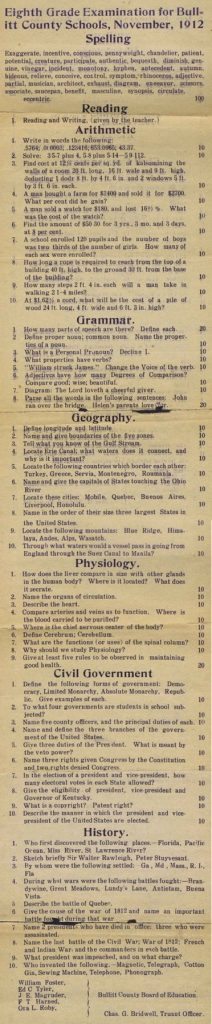
The three top spellers advanced to the Badger State Spelling Bee on March 21, so Barnhill will be joined by Joanne Aldoori of Madinah Academy, who placed second, and third-place finisher Ignatius Fassino of St. Ambrose Academy.
Casey Barnhill found his spelling bee victory cradled between Colombia, Peru and the Pacific Ocean. The Velma B. Hamilton Middle School student took first place after correctly spelling “Ecuador.”
Barnhill was one of 41 students vying for the title of Madison’s star speller Saturday at Madison College’s Mitby Theater.
“I’m feeling good because I got second place last year,” he said. “I got out last year on definition.”
The three top spellers advanced to the Badger State Spelling Bee on March 21, so Barnhill will be joined by Joanne Aldoori of Madinah Academy, who placed second, and third-place finisher Ignatius Fassino of St. Ambrose Academy.
8,897 (!) Madison 4k to 3rd grade students scored lower than 75% of the students in the national comparison group during the 2024-2025 school year.
Madison taxpayers have long supported far above average (now > $26,000 per student) K-12 tax & spending practices. This, despite long term, disastrous reading results.
The conclusion of Justice Gorsuch’s concurrence in the tariff case:
For those who think it important for the Nation to impose more tariffs, I understand that today’s decision will be disappointing. All I can offer them is that most major decisions affecting the rights and responsibilities of the American people (including the duty to pay taxes and tariffs) are funneled through the legislative process for a reason. Yes, legislating can be hard and take time. And, yes, it can be tempting to bypass Congress when some pressing problem arises. But the deliberative nature of the legislative process was the whole point of its design. Through that process, the Nation can tap the combined wisdom of the people’s elected representatives, not just that of one faction or man. There, deliberation tempers impulse, and compromise hammers disagreements into workable solutions. And because laws must earn such broad support to survive the legislative process, they tend to endure, allowing ordinary people to plan their lives in ways they cannot when the rules shift from day to day. In all, the legislative process helps ensure each of us has a stake in the laws that govern us and in the Nation’s future. For some today, the weight of those virtues is apparent. For others, it may not seem so obvious. But if history is any guide, the tables will turn and the day will come when those disappointed by today’s result will appreciate the legislative process for the bulwark of liberty it is.
In early 2024, Jeffco Schools carved out a special “municipal interest” process enabling Lakewood and other municipalities to bypass traditional bidding to acquire shuttered schools.
Eight months earlier, an appraisal had made it clear to the school district that competitive bidding was in fact viable for the closed Emory Elementary, meaning the district could sell the property and turn a tidy profit for taxpayers within a year.
Disregarding that appraisal, the board of Colorado’s second-largest district voted last November to sell the Emory property to the city of Lakewood for $4 million — without going through a bidding process.
Shortly before that, Lakewood’s city council had approved flipping the closed school to The Action Center, a social and homeless-services nonprofit, for just $1 million, while retaining seven acres of the 17-acre property as open space for the city.
In this paper, we provide systematic evidence in support of the long-standing hypothesis that taxation was an important driver of the French Revolution. We first document that areas with heavier taxes experienced more riots between 1750 and 1789 and voiced more complaints against taxation in the cahiers de doléances of 1789. After showing that these effects are driven by indirect taxes, we exploit sharp spatial differences in the salt tax and the traites—the two principal indirect levies—to implement a regression discontinuity design (RDD).We find that unrest was higher on the high-tax side of the border. These effects intensified over time, peaking in the 1780s, and were stronger where fiscal disparities were larger and Enlightenment ideas more widespread. We further show that adverse weather shocks amplified unrest in high-tax municipalities. We then document that taxation fueled the spread of unrest during the Grande Peur—the wave of revolts that swept France in July 1789 and culminated in the abolition of feudal privileges. Finally, we link taxation to revolutionary politics in Paris, documenting that deputies from heavily taxed constituencies were more likely to frame the tax system as oppressive, support the Revolution, demand the abolition of the monarchy, and vote for the king’s execution.
If change is happening in the market for K-12 education, can higher ed be far behind?
The trends noted above work to the benefit of UATX. The families that have explored alternatives to public schools make up the addressable market. If you have already opted out of the normal path of education, then it is not such a leap to try UATX.
Accordingly, it is reasonable to expect UATX to achieve its aggressive growth goals for the next couple of years. While legacy universities face a declining college-age population, declining high school test scores, and obstacles to filling their classrooms with foreign students, UATX expects to enroll 125 or more students this fall, as many as in the first two years’ classes put together. This will feel like an invasion, with a large and somewhat unpredictable impact on the atmosphere and culture here.
This influx will arrive in the context of governance issues that are roiling higher education today. Thomas W. Smith writes,
Each year, Wisconsin property taxpayers contribute more than $6.5 billion in local school levies. Those dollars are commonly understood to support classrooms, teachers and student services. In reality, a large — and growing — portion is diverted to debt service, a non-negotiable financial obligation before a single classroom dollar is spent.
In fact, the debt-service share of the local levy continues to grow, not because students are receiving more, but because past borrowing decisions increasingly dictate today’s budgets. Fortunately, at least one school district is showing that a debt free future is possible.
Statewide, nearly 18% of all local school levies — about $1.18 billion each year — are used to service debt. In practical terms, almost one out of every five local school tax dollars is unavailable for instruction or student support because it has already been committed elsewhere. Unfortunately, long-term debt has become a routine feature of school finance rather than an exception.
Looking at debt on a per-student basis makes the impact clearer. Across Wisconsin, districts levy an average of $1,483 per student each year simply to service existing debt. In districts that carry any debt at all — roughly 85% of districts statewide —that figure rises to $1,550 per student, before any money is spent in a classroom.
At the same time, Wisconsin is experiencing sustained enrollment decline, and while per-pupil revenue limits may decline with enrollment, existing district debt does not shrink when enrollment falls. The obligation stays fixed, and the burden shifts. Even if no new debt is added, fewer students are left to carry the same costs.
As we’ve said before on this blog, when we covered Washington and New York, it doesn’t matter if you’re pro or anti-gun. The state should prosecute people who make illegal thing, not add useless surveillance software on every tool in every classroom, library, and garage in the state. And as you can see, these bills spread – that’s how an small group can push legislation into the entire country. First, Washington proposed theirs, then New York, now California. Once those three states pass a law, that’s 20~25% of the country by GDP/population and thus every manufacturer is forced to comply with a bad decision in order to stay in business. If you’re a maker, educator, or manufacturer anywhere in the US, even outside these states, this is a problem-problem now.
A battle over control of the Baltimore County School Board is flaring in Annapolis, where Democratic lawmakers are clashing over how many members voters should elect and how many the governor should appoint.
Some excerpts from the long discussion in Parker v. Costco Wholesale Corp., decided in November by Magistrate Judge S. Kate Vaughan (W.D. Wash.), but only recently posted on Westlaw:
The Court identified material misstatements and misrepresentations in those filings, which contained hallucinated case and record citations and legal errors consistent with unverified generative artificial intelligence (“AI”) use and ordered Counsel to show cause as to why sanctions should not issue. The Court outlines its observations before turning to Counsel’s explanations….
Review of Plaintiff’s Response to Defendant’s Motion for Summary Judgment (“MSJ Response”) indicated the filing relied on inapplicable law, misrepresented and misquoted the law and the record, and included a wide array of idiosyncratic citation errors. For brevity, the Court summarizes the most egregious examples….
[Among other things,] Counsel included hallucinated and inaccurate quotes to the record. This was particularly egregious given that he sought to demonstrate a question of material fact precluded summary judgment and attempted to do so by relying on mischaracterized evidence….
This is not a call for refinement or recalibration of immigration enforcement following months of federal occupation in Minneapolis. It is a call to name failure plainly. When ICE’s ordinary operations require protection from law rather than obedience to it, abolition is not a radical slogan but a natural conclusion. The whistle is being sounded in Minneapolis. The question before the legal profession is whether we will hear it, amplify it, and act accordingly, or rush to patch over the cracks before more bodies make structural collapse inevitable.
Here’s my core prediction: Alpha School will not be the place where we finally unveil the holy grail of education technology, where 100 percent of students can learn from a computer. Alpha School will not be the place where Engelmann’s ideas scale to reach every student. Developing curriculum is an empirical science. Designing great curriculum requires endless tinkering and testing and revision. If that testing happens at a $40,000-a-year private school, it simply will not scale to everyone. Alpha School might do great things for a slice of students. That’s cool. But let’s make sure the claims are in line with reality.1
If Alpha School is serious about being “the future of education,” the solution is simple. I’m seeing these allusions to Engelmann. Follow in his footsteps. Partner with a struggling school where outcomes are poor. Test the curriculum there. Refine and iterate with the students who are most likely to struggle. If Alpha School isn’t interested in doing that, I’m not going to pay much attention to the big claims. Go be a successful private school. Live and let live. I’ll head back to my classroom to do the best I can with boring traditional whole-class instruction.
I’ll note that there’s a section of the edtech world that is honest and straightforward that their products are designed to help the most academically capable students. I appreciate that! I know public schools struggle to challenge talented students, I see it every day. I’m happy those products exist. I respect them for being honest about who they’re designed for. If Alpha School marketed themselves that way, I wouldn’t be writing long posts about all this.
A group of 11 Wisconsin school district superintendents is urging lawmakers to increase school funding.
The superintendents want the state to use its projected $2.5 billion surplus to boost aid and provide property tax relief.
Districts have faced budget shortfalls, leading to cost-cutting, potential school closures and a reliance on voter-approved referendums.
Negotiations between Democratic Gov. Tony Evers and Republican legislative leaders over a tax relief package remain at a stalemate.
A group of Wisconsin school district leaders is pleading with lawmakers to increase school funding and provide property tax relief before this year’s legislative session ends.
The superintendents, representing 11 school districts, including Wisconsin’s five largest and six rural districts, said lawmakers should use the state’s proposed $2.5 billion surplus to boost aid to schools. They said rising costs and stagnant state support have forced districts to rely on voter-approved property tax referendums to help meet budget shortfalls.
“Wisconsin urgently needs a bipartisan compromise on school funding,” the district leaders said. “The current stalemate leaves public school districts unable to plan responsibly and pushes local communities to shoulder costs that the state should be sharing.”
Superintendents of the state’s largest districts in Milwaukee, Madison, Kenosha, Racine and Green Bay penned the open letter to lawmakers in late January. District leaders in rural Baraboo, Reedsburg, River Valley, Sauk Prairie, Weston and Wisconsin Dells released the same statement Feb. 17.
The Dane County district attorney filed misdemeanor charges of disorderly conduct and resisting an officer against Madison School Board Vice President Maia Pearson Thursday.
The charges stem from a December incident involving Pearson and Brandi Grayson, the CEO of Urban Triage, that led to their arrests. Both Pearson and Grayson have entered not guilty pleas and obtained signature bonds, court records show.
While Grayson had been arrested in December by Madison police on three counts of disorderly conduct and OWI, Grayson was only chargedThursday with disorderly conduct and resisting an officer.
Pearson and her lawyer didn’t immediately respond to requests for comment, nor did Grayson’s attorney.
In a separate pending case, Grayson is facing disorderly conduct and property damage chargesthat followed a report by a man she had previously been in a relationship with. Grayson has pleaded not guilty in that case, as well.
8,897 (!) Madison 4k to 3rd grade students scored lower than 75% of the students in the national comparison group during the 2024-2025 school year.
Madison taxpayers have long supported far above average (now > $26,000 per student) K-12 tax & spending practices. This, despite long term, disastrous reading results.
After screening bids to ensure the materials met mandatory requirements, the school district’s K8 Math Leadership team sent along four proposals for further consideration by a larger selection committee.
That committee included 40 people across 21 schools and the district’s central office, as well as School Board member Ali Muldrow and Lisa Hennessey, a University of Wisconsin-Madison teaching faculty member who serves on the board of the National Council of Teachers of Mathematics.
Following hours of meetings and evaluations in January, the committee selected Illustrative from three finalists. The cost estimates for Illustrative or the other finalists weren’t shared in materials provided at the Instruction Working Group meeting this month. District administrators previously told School Board members the price tag of math materials would be less than its most recent purchase of reading curriculum, which cost $5.6 million.
In a presentation to School Board members, district officials highlighted the curriculum’s approach to working with students of different skill levels. Madison high schools already use Illustrative materials, meaning there would be consistency if the curriculum is adopted across all grade levels.
District officials particularly emphasized Illustrative’s “problem-based” learning approach, which involves students first tackling problems in small groups and then trying it themselves with supervision before the teacher models how to solve the problem.
—-
“The commercial math-education sector is flooded with ineffective math programs and T professional development marketed as “research-based.” But that can mean almost anything, from small case studies to opinion framed as research.”
Jensen then told police that the person who made the original report in October has a stepsister who goes to Thoreau, that the stepsister had seen the photo and told her mother about it, and that the mother had reported the photo’s existence to the school.
Madison police and the Madison School District launched investigations after the staffer at Thoreau Elementary School allegedly took the photo of the then-7-year-old, developmentally disabled boy in late September.
In response to a Feb. 13 Wisconsin State Journal story about the matter, Thoreau Principal Emily Jensen sent a message to Thoreau families Thursday asserting that while the photo’s existence was reported to the school on Oct. 1, police who followed up on the matter did not share the photo with the school.
8,897 (!) Madison 4k to 3rd grade students scored lower than 75% of the students in the national comparison group during the 2024-2025 school year.
Madison taxpayers have long supported far above average (now > $26,000 per student) K-12 tax & spending practices. This, despite long term, disastrous reading results.
Some of those funds come in the form of utility bills and facilities maintenance but the vast majority – $25 million – came in direct transfers of unrestricted university funds: money that can otherwise be used anywhere at IU.
It’s the second highest year on record, after appropriating $34.3 million in 2024 to close the deficit – more than eight times the average for other Big Ten schools.
But in the 2025 fiscal year, IU athletics reported a $10 million surplus, driven mainly by media rights, ticket sales and contributions. That’s according to IU’s NCAA financial report, obtained Monday by WFIU.
None of IU’s direct support was returned to the university, per the report.
It helps that red states have gone back to basics: legislators in state capitals have enacted new rules that require teaching reading via phonics and holding failing schools accountable. Those decisions matter a great deal for classrooms. But America is made up of more than 13,000 school districts, most of which have the autonomy to set policy, too. That gives cities and towns across the country the opportunity to run small experiments to figure out how to get students to learn—and then to double down on what works.
In Birmingham, Alabama, city leaders are doing just that. This is not a place where fixes come easily. Pupils in the school district are almost all black and nine out of ten qualify for free or cut-price lunches. For years their test scores were a drag on state averages (which were already low). But a few clever policies seem to be turning things around. In the past two years the city went from having 15 “F”-rated schools to just one. A Stanford and Harvard study found that children in Birmingham are making up for maths learning lost during covid lockdowns about half a grade level faster than students in less poor districts. Kay Ivey, Alabama’s Republican governor, boasted in her state-of-the-state address last February that Alabama is no longer “just a football state” but also an “education state”.
8,897 (!) Madison 4k to 3rd grade students scored lower than 75% of the students in the national comparison group during the 2024-2025 school year.
Madison taxpayers have long supported far above average (now > $26,000 per student) K-12 tax & spending practices. This, despite long term, disastrous reading results.
Declining enrollment is a big reason behind school closures
Shaw said that while the Policy Forum has not specifically studied school closures, it has closely tracked student enrollment, which has a direct effect on funding.
Enrollment has declined at public school districts every year for more than a decade. That decline has affected a majority of Wisconsin school districts, Shaw said.
Statewide, public school enrollment in the 2014-15 school year was 870,652. By 2024-25, that had dropped to 805,881, according to the Policy Forum, a decline of almost 65,000 students – more than 7% statewide.
The main factor: a decline in the birth rate statewide.
“Statewide, public school enrollment in the 2014-15 school year was 870,652. By 2024-25, that had dropped to 805,881, according to the Policy Forum, a decline of almost 65,000 students – more than 7% statewide.”
“What if the valedictorians in America’s schools were the cool kids?” This is the question Nicholas Kristof posed in his recent column in The New York Times, imagining a culture in the U.S. where academic excellence carries the same social prestige as it does in some East Asian countries.
But in many of the environments I’ve inhabited—elite universities and professional circles in New York, San Francisco, and Washington, D.C.—the valedictorians are already the cool kids. Whether they exhibit genuine academic prowess or have learned to “game the system,” their presumed competence is the ultimate social currency. It grants them not just admiration, but often a kind of anticipatory deference based on the influence they will presumably wield in the future.
Mr. Kristof is not necessarily wrong or alone in feeling envious of the high regard that some prosperous, rapidly developing democracies, particularly in Asia, have for education. Exploring the role cultural values play in shaping national outcomes has preoccupied educators and institutional leaders for decades. And at a time when gifted programs and test-entry schools are falling out of favor in much of the U.S., his point is especially well taken.
But I worry that we have come to conflate intelligence and success with moral authority.
In America’s high-achievement settings, excellence can function as a form of psychological and social insulation: Intelligence is taken as a proxy for virtue; success as evidence of character and wisdom. Over time, this dynamic can make it harder for the most credentialed and celebrated individuals to question their own judgment or remain open to new viewpoints. It can also make it harder for others to question the behavior of those whose accomplishments appear to place them beyond reproach.
A key problem with Caplan’s trinity is that most of it is easily replaceable. Getting good grades at college does signal intelligence and conscientiousness, but these could be signaled far more easily and cheaply. It’s very easy to signal intelligence via test scores: IQ is surprisingly predictive of many other desirable cognitive traits. This need not require literal IQ tests—standardized tests like the SAT or GRE are highly correlated with intelligence. In other cases, companies use IQ-like tests (e.g. tech companies’ coding interviews). These are also significantly harder to cheat on than college courses.
Caplan acknowledges that college grades are far from the best way to signal intelligence; what he doesn’t discuss is that they’re even further from the best way to signal conscientiousness. If you asked people why they don’t just learn college material independently without paying for college, I expect that a common response would simply be “oh, I don’t have the discipline for that”. College provides external frameworks, timetables, local incentives, and social pressure for people who aren’t conscientious enough to learn without that.
Zohran Mamdani’s mayoral win in New York City was a warning of what could lie ahead in American electoral politics—especially the enthusiasm that he inspired among younger voters. Those aged 18–29 had the highest turnout of any group, at 35 percent, almost double its level in 2021. Mamdani’s democratic socialist agenda also draws support beyond New York. An Axios/Generation Lab poll conducted days before the mayoral election found that 67 percent of college students held a positive or neutral view of socialism; only 40 percent said the same about capitalism.
Support for socialism and for figures like Mamdaniprimarily comes from young people who feel priced out of the American dream—owning a home, securing a stable job, and starting a family. Many first confront the gap between expectation and reality when they enter college and take on substantial debt, a stark contrast with the youthful freedom that older Americans often associate with their own college years.
Finally, a reason to check your email.
Sign up for our free newsletter today.
On college affordability, Democrats have built brand trust: voters expect subsidies from them. The issue is salient enough that even local politicians like Mamdani, who have relatively little jurisdiction over higher-education policy, feel compelled to voice broadcommitments to boosting university subsidies.
There’s a pretty robust body of research on what happens to schools when neighborhoods gentrify, and the general finding is: not much. Or rather, not the thing you’d naively expect.
A Stanford study by F. Chris Pearman found that gentrification was actually associated with declining enrollment at neighborhood schools, with the largest drops occurring when the gentrifiers were white. In Denver, gentrifying neighborhoods saw a 23% enrollment decline between 2006 and 2016 as white families used school choice mechanisms — charters, magnets, out-of-boundary transfers — to avoid their zoned schools. A Chalkbeat analysis found that in gentrifying areas nationally, white parents enrolled their kids in schools with 19% fewer poor students and 14% fewer Black and Hispanic students than their assigned neighborhood school.
The basic dynamic is straightforward and kind of depressing: white families move in, housing prices rise, the neighborhood changes, but the schools don’t. Or they change only in the sense that lower-income families get priced out and enrollment declines.
New York City is the partial exception, where gentrifying schools saw a 40% increase in white enrollment between 2000 and 2014. But even in New York, that was concentrated in specific neighborhoods — it wasn’t a district-wide transformation.
Things slowed down. Orders weren’t coming in; they still aren’t coming in like they used to. One worker told me she can be logged on for hours without receiving an order. Customers still want the convenience, but many balked at the fees that the apps tacked on after the new law. The companies say the fees are necessary.
That pattern is consistent with a recent study by the National Bureau of Economic Research —wages were higher in the first few months and then dropped. The study also found that months later, drivers have more unpaid idle time, and drive longer distances between orders.
And how about local businesses, how has the law affected them?
I checked back with Uttam Mukherjee, co-owner of Spice Waala, that serves Indian street food on Capitol Hill, Columbia City, and Ballard. Mukherjee has expressed concerns early on. Those concerns he says have become real — he’s getting fewer orders coming through those apps because of the added fees that customers are now paying.
We show that the vast majority of low-income high achievers do not apply to any selective college. This is despite the fact that selective institutions typically cost them less, owing to generous financial aid, than the two-year and nonselective four-year institutions to which they actually apply.
Moreover, low-income high achievers have no reason to believe they will fail at selective institutions since those who do apply are admitted and graduate at high rates. We demonstrate that low-income high achievers’ application behavior differs greatly from that of their high-income counterparts with similar achievement. The latter generally follow experts’ advice to apply to several “peer,” a few “reach,” and a couple of “safety” colleges. We separate low-income high achievers into those whose application behavior is similar to that of their high-income counterparts (“achievement-typical”) and those who apply to no selective institutions (“income-typical”). We show that income-typical students are not more disadvantaged than the achievement typical students. However, in contrast to the achievement-typical students, income-typical students come from districts too small to support selective public high schools, are not in a critical mass of fellow high achievers, and are unlikely to encounter a teacher who attended a selective college.
We demonstrate that widely used policies—college admissions recruiting, campus visits, college mentoring programs—are likely to be ineffective with income-typical students. We suggest that effective policies must depend less on geographic concentration of high achievers.
We can see that the drop in vacancies predates the release of OpenAI’s large language model (LLM). Instead, the fall in job postings dovetails with a period in which the Federal Reserve pressed the brakes on the US economy by raising interest rates by 5 percentage points.
What’s more, because of the post-pandemic surge in openings and hiring, the subsequent reduction appears to reflect a normalisation.
These broad trends in hiring and central bank rate increases hold in many G7 nations during the same period.
There are non-AI drivers of labour market weakness, too. For instance, in Britain the rise in youth unemployment is, in part, linked to the Labour government’s policies, such as payroll tax increases.
I sometimes wonder about the fervor education bureaucrats have for making standardized testing optional. Then I hear stories like Aleysha’s and know exactly why they do it. Tests reveal the rot.
San Francisco paid 6-figures to education school bureaurcrats pushing “Grading for Equity” — homework doesn’t count, unlimited test retakes, lateness and absence don’t affect grades. A score of 80 can earn an A. The game is to keep grades up while learning collapses. Rubber stamp F’s into C’s, C’s into B’s, B’s into A’s.
And once you’re through the gate? Harvard doesn’t even offer remedial writing courses. There’s nowhere to catch up. The students who were passed through without learning are stranded.
8,897 (!) Madison 4k to 3rd grade students scored lower than 75% of the students in the national comparison group during the 2024-2025 school year.
Madison taxpayers have long supported far above average (now > $26,000 per student) K-12 tax & spending practices. This, despite long term, disastrous reading results.
Since 2000, for every eight students lost, public schools added one non‑instructional staff member.
More adults than ever, yet fewer kids reading and doing math at grade level. That’s not a ‘year of the kid’ – that’s decades of growing a bloated bureaucracy.
Black Hawk Middle School in Madison, Wis. is openly violating the 14th Amendment, Civil Rights Act, and years of Supreme Court precedent by offering free brunch and games today to only black students and staff members.
In September 2022, Governor Kathy Hochul signedS960, a bill limiting the size of classes in New York City public schools. The law phases in class-size limits—20 students for grades K–3; 23 students for grades 4–8; and 25 students for high school—over six years.
Fast forward to today: the implementation of the class-size law is causing predictable disruptions in Gotham. Parents and experts warned from the beginning that the law would be expensive, hard to implement, and generate, rather than reduce, inequality. Three years in, their fears remain valid.
Smaller class sizes mean more classes—and more teachers. New York City’s Independent Budget Office (IBO) estimated that the new law would cost the city between $1.6 billion and $1.9 billion annually to hire the number of additional instructors required to comply with the law. This would make the city’s public schools, already projected to spend more than $42,000 per pupil, even more inefficient.
At its founding in 1956, the AP program was not intended to be such a behemoth. Its founders viewed it as “an opportunity and a challenge to … the strongest and most ambitious boys and girls.” For the program’s first several decades, its growth reflected that purpose. In 1956, 2,199 AP exams were administered nationwide. That number increased by an average of 10,567 tests per year over the next 30 years. By the pandemic’s aftermath, growth had accelerated to an average of 325,000 additional tests administered per year, reaching 6.25 million in 2025.
Amidst this blitz, the New York Timesasked, in a 2023 article, “Why Is the College Board Pushing to Expand Advanced Placement?” The story noted that, “for the past two decades, the College Board has moved aggressively to expand the number of high school students taking Advanced Placement courses and tests—in part by pitching the program to low-income students and the schools that serve them. It is a matter of equity, they argue.”
That move was so successful that the Times said the AP program had become “something of a de facto national curriculum.” Indeed, the financial success of the AP program is matched only by its power over American classrooms.
Across the country, a quiet but important shift is underway in how courts review administrative agency decisions. Nineteen states have ended judicial deference to administrative agencies (including Kansas just this week), either through legislation or state court decisions. More are poised to follow. Bills are currently pending in states like Alabama, South Carolina, South Dakota, and West Virginia, reflecting a growing recognition that judicial deference undermines the rule of law and tilts the scales of justice too far in the government’s favor.
That momentum accelerated in 2024, when the U.S. Supreme Court overturned Chevron deference in Loper Bright Enterprises v. Raimondo. For four decades, Chevron required federal judges to defer to an agency’s interpretation of the laws it administers whenever statutory language was deemed ambiguous. Rather than weighing competing interpretations and choosing the most persuasive one, Chevron mandated that judges put a thumb on the scale for the government.
The results were predictable. Chevron led to a dramatic win rate for federal agencies—often at the expense of individuals, small businesses, and regulated entities that found themselves in the crosshairs of government enforcement. By overruling Chevron, the Court reaffirmed a basic constitutional principle: it is the judiciary’s job to say what the law is.
ButLoper Brightresolved only half the problem. While federal courts are no longer bound byChevron, many states continue to apply their own versions of judicial deference. In those states, agencies still enjoy a built-in advantage when their interpretations of state law are challenged. As a result, Americans’ rights can vary dramatically depending on whether a dispute arises under federal or state law—and depending on which state they live in.
The purpose of education is to help us live better lives.
Rebecca and Henry have asked me to write something for this blog about liberal education. What is a liberal education, they ask? Why does the “Great Books” stuff I’ve been doing as a teacher for the past few years, they ask, fit the model? My former Tulsa Honors colleague Dan Walden just came out with an essay about these topics in The Point, too. I largely agree with Dan, but with some differences of emphasis.
I think an appropriate liberal education is one that teaches us to “free solo,” intellectually speaking. The deepest, most difficult questions that arise in our lives stare us down like barren rock walls, unmarked and unscalable, pristine in a precipitous terror of sand. To live thoughtfully, reasonably, and morally is no small task, let alone to do so freely and authentically. Yet this is what our very ability to think and act seems to demand of us – at least to some of us, the way a mountain might demand to a free soloist to be climbed. Through a liberal education, free people grow in their capabilities, their powers, until few things accessible to their reason and will remain foreign to them.