Notes and Perspective on k-12 tax & $pending efficiency
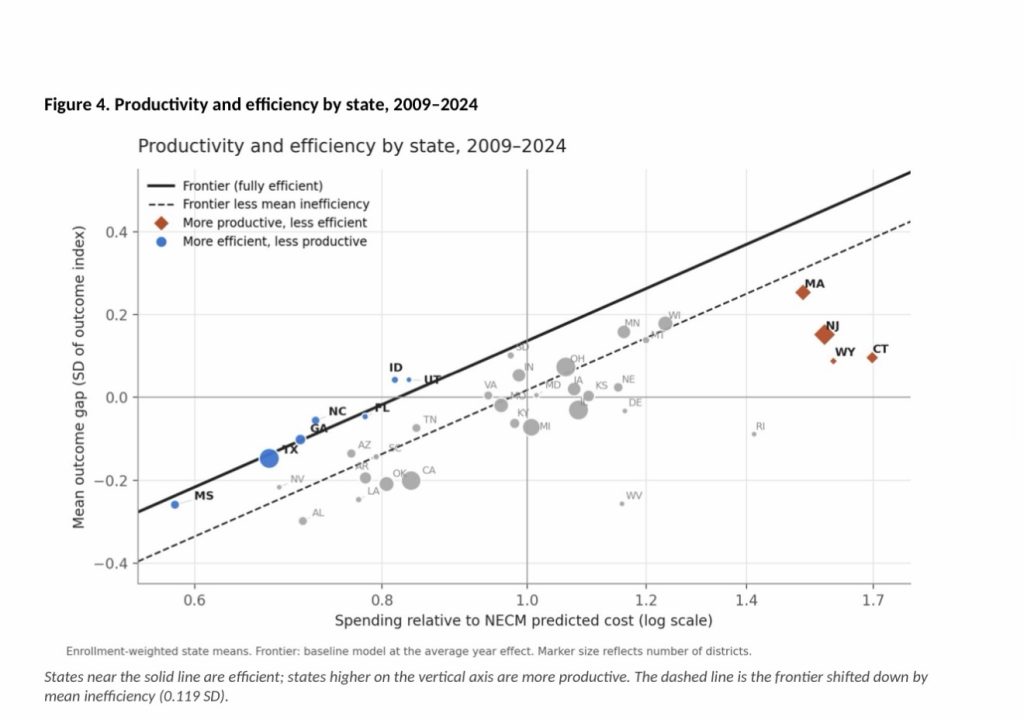
In a new brief (full PDF here), I estimate a stochastic frontier model of district efficiency using the National Education Cost Model: roughly 129,000 district-years for about 8,100 districts in 38 states, 2009–2024. The frontier is the best outcome achievable at a given level of spending relative to cost. Each district’s efficiency is its distance from that frontier, expressed as the share of its current resources a fully efficient district would need to reach the same outcomes. I estimate it with and without state fixed effects, because (more on this below) comparing test scores across states is its own can of worms.
The headline findings:
- Money matters, with diminishing returns. A 10 percent increase in resources relative to cost raises frontier outcomes by about 0.07 SD nationally, and about 0.09 SD when comparing districts within the same state. That’s not nothing. It’s a lot.
- Most districts are about equally efficient. The median district operates at about 86 percent efficiency, and nearly three-quarters of district-years fall between 80 and 90 percent. There is a long lower tail, but there’s no evidence here of a system drowning in waste.
- The tail has been growing, and it’s growing within states. The share of districts below 80 percent efficiency doubled, from 11 percent in 2011 to 22 percent in 2024, and the pattern is the same when districts are compared only with others in their own state.
- The “bloated administration” story is tiny. Within their own states, the least efficient districts are more heavily staffed across the board, with more teachers, more aides and more administrators, and they are also smaller and higher-cost. The general administration gap between the most and least efficient districts works out to something like $80–100 per pupil. Anyone promising to close achievement gaps by trimming the central office is selling something.
Florida is efficient. New Jersey is better.
Rank states by average efficiency and you get Idaho, North Carolina, Utah, Florida and Georgia at the top, with Rhode Island, West Virginia, Connecticut, Wyoming and New Jersey at the bottom. Cue the triumphant op-ed about Florida.
———-
Commentary thread:
You are using a measure of “cost” that has your conlclusions baked in as an assumption! Very sneaky.
———
“Did you know my school was bad like this when you decided to put me here?” she asked.
Madison’s district, despite an elite university pipeline, hypereducated leadership, and a shiny, new strategic plan, suffers the same frailties as Milwaukee’s: basement performance, backbreaking spending. But while Milwaukee is pulling out of its tailspin due to courageouschoices from the top, Madison is ponderously ambling to nowhere. Just ask the locals. “You need the marketing, and you need the product,” as a parent told a reporter. “I’m missing the product.”
2025-2026 Madison 4k-3rd grade Early Literacy Screener report: The bar moves faster than the kids.
Joe Gothard, Becky Kundert and Sonia Spencer Remarks on Madison’s K-12 Literacy Crisis.
2026-2027 Madison K-12 $pending continues to grow, fueled by a 9.7% (!) property tax increase. Total spending will be at least $706,000,000 for 25,003 students, or $28,236 per student.
May 2026 Madison School District Presentation: 7,095 adults for 25,003 students (3.52 students per adult!)
2024-2025 Early Literacy Screener Map.
Map: Foundations of Reading Results: 2015–2024
Where have all the students gone?
3,887 Madison 4 year old to third grade students scored lower than 75% of the students in the national comparison group.
Madison taxpayers have long supported far above average k-12 tax & $pending. This despite our long term, disastrous reading results. May, 2026: 7,095 Staff for 25,003 students; $pending > $26k per student!
Madison Schools: More $, No Accountability
The taxpayer funded Madison School District long used Reading Recovery…
The data clearly indicate that being able to read is not a requirement for graduation at (Madison) East, especially if you are black or Hispanic.
My Question to Wisconsin Governor Tony Evers on Teacher Mulligans and our Disastrous Reading Results
2017: West High Reading Interventionist Teacher’s Remarks to the School Board on Madison’s Disastrous Reading Results
Madison’s taxpayer supported K-12 school district, despite spending far more than most, has long tolerated disastrous reading results.
“An emphasis on adult employment”
Wisconsin Public Policy Forum Madison School District Report[PDF]
WEAC: $1.57 million for Four Wisconsin Senators
Friday Afternoon Veto: Governor Evers Rejects AB446/SB454; an effort to address our long term, disastrous reading results
Booked, but can’t read (Madison): functional literacy, National citizenship and the new face of Dred Scott in the age of mass incarceration.
When A Stands for Average: Students at the UW-Madison School of Education Receive Sky-High Grades. How Smart is That?
China’s PhD Glut Drives Top Graduates to High School Teaching Jobs