Search results
238 results found.
Curated Education Information
238 results found.
Mark C. Schug, Ph.D., M. Scott Niederjohn, Ph.D.:
By law public schools in Wisconsin must administer a rigid, comprehensive set of tests. In the fall of every school year students are tested in reading, math, language, science and social studies. Test results from each district and each school are posted on the Internet, passed along to the federal government to comply with No Child Left Behind requirements and are made available to parents. In an era where measurable student performance is essential, it is expected that Wisconsin’s elaborate system of testing will tell us how Wisconsin students are performing. Unfortunately the testing required by Wisconsin state law is not very good.
The purpose of state standards and state-mandated testing is to increase academic achievement. Does Wisconsin’s elaborate system of testing advance this goal? From every quarter the answer is a clear no. That is the consensus of independent, third-party evaluators. Wisconsin’s massive testing program has come under fire from the U.S. Department of Education which said that Wisconsin testing failed to adequately evaluate the content laid out in the state’s own standards. Further, a joint report issued by the independent Fordham Institute and the Northwest Evaluation Association performed a detailed evaluation of testing in every state and ranked Wisconsin 42nd in the nation. The Fordham Institute gave Wisconsin’s testing a grade of “D-minus.”
Perhaps even more troublesome is that many Wisconsin school districts find the testing system inadequate. Over 68% of Wisconsin school districts that responded to a survey said they purchase additional testing to do what the state testing is supposed to do. These districts are well ahead of the state in understanding the importance of timely, rigorous testing.
This report lays out the thirty-year history of testing in Wisconsin and the criticism of the current testing requirement. It is the first of two reports to be issued regarding Wisconsin’s testing program. The second report will show how a new approach to testing will not only meet the standards that parents, teachers and the public expect, but will also allow teachers and policy makers to use testing to actually increase the achievement of Wisconsin’s children.
But perhaps as early as the 2010-’11 school year, things will be different:
- Changes are expected in the state standards for what students are supposed to learn in various grades and subjects. The primary goal of the WKCE is to measure how well students overall are doing in meeting those standards. But Mike Thompson, executive assistant to the state superintendent of public instruction, said new standards for English language arts and math should be ready by the end of this year.
As the policy institute studies note, the existing standards have been criticized in several national studies for being among the weakest in the U.S.- The tests themselves will be altered in keeping with the new standards. Just how is not known, and one key component won’t be clear until perhaps sometime in 2010, the No Child Left Behind Act could be revised. What goes into the new education law will have a big impact on testing in every state.
- The way tests are given will change. There is wide agreement that the wave of the future is to do tests online, which would greatly speed up the process of scoring tests and making the results known. The lag of five months or more now before WKCE scores are released aggravates all involved.
The policy institute studies called for online testing, and the DPI’s Thompson agrees it is coming. Delays have largely been due to practical questions of how to give that many tests on computers in Wisconsin schools and the whole matter of dealing with the data involved.
- Also changing will be the way performance is judged.
Now, Wisconsin and most states measure which category of proficiency each student falls into, based on their answers. Reaching the level labeled “proficient” is the central goal.
Much more on the WKCE here.
The most recent research from the U.S. Department of Education shows that American 15-year-olds are behind their International counterparts when it comes to problem solving and math literacy.
The report showed the U.S. ranks 24th out of 29 nations.
But a math program, gaining in popularity, is trying to change that.
The program is called Everyday Math.
Lori Rusch is a fourth grade teacher at Middleton’s Elm Lawn Elementary. This year she teaches an advanced math class.
On Monday, students in Rusch’s class were mastering fractions and percentages.
But her students began learning fractions and percentages in first grade.
“We’ve been incredibly successful with it,” said Middleton’s curriculum director George Marvoulis. “Our students on all of our comparative assessments like WKCE, Explorer Plan, ACT, our students score higher in math than any other subject area so we’ve been very pleased.”
According to Marvoulis, Middleton was one of the first school districts in the nation to use the Everyday Math program in 1994.
“The concept is kind of a toolbox of different tools they can use to solve a problem,” explained Marvoulis.
Related: Math Forum and Clusty Search on Everyday Math.
Across Wisconsin, educators like Hensgen are part of a growing chorus to reassess the way the state assesses students. Currently, teachers and districts wait five months for WKCE results, so they have little time to react to the findings and adjust their curriculum. The tests eat into a week of class time and are based on standards that, critics say, are too low to give parents and teachers a clear picture of how students measure up globally.
“It’s widely agreed that the WKCE is a really lousy test that measures lame standards,” said Phil McDade, a departing member of the Monona Grove School Board. “The bigger issue to me in Wisconsin is that there’s a sense of self-satisfaction with our school districts, that we’re doing fine, that we’re Lake Wobegon, that everybody here’s above average.”
The Department of Public Instruction commissioned a state task force on the issue last fall and is reviewing the group’s recommendations, said Michael Thompson, executive assistant to the state superintendent of schools. The state’s current testing contract lasts at least another two years.
Alan Borsuk has more.
“Schools should not rely on only WKCE data to gauge progress of individual students or to determine effectiveness of programs or curriculum”
The ACT Explore test was mentioned in Gayle Worland’s article.
To: comment@madison.k12.wi.us
Cc: askey@math.wisc.edu
There are a number of points in the Summary of Administrative Response to MMSD Mathematics Task Force Recommendations which should be made. As a mathematician, let me just comment on comments on Recommendation 11. There are other comments which could be made, but I have a limited amount of time at present.
The first question I have is in the first paragraph. “One aspect of the balanced approach is represented in the four block approach to structuring mathematics lessons. The four blocks include Problem Solving, Number Work, Fluency and Maintenance and Inspecting Equations.” There is a missing comma, since it is not clear whether Maintenance goes with the previous word or the last two. However, in either case, “Inspecting Equations” is a strange phrase to use. I am not sure what it means, and when a mathematician who has read extensively in school mathematics does not understand a phrase, something is wrong. You might ask Brian Sniff, who seems to have written this report based on one comment he made at the Monday meeting, what he means by this.
In the next paragraph, there are the following statements about the math program used in MMSD. “The new edition [of Connected Math Project] includes a greater emphasis on practice problems similar to those in traditional middle and high school textbooks. The new edition still remains focused on problem-centered instruction that promotes deep conceptual understanding.” First, I dislike inflated language. It usually is an illustration of a lack of knowledge. We cannot hope for “deep conceptual understanding”, in school mathematics, and Connected Math falls far short of what we want students to learn and understand in many ways. There are many examples which could be given and a few are mentioned in a letter I sent to the chair of a committee which gave an award to two of the developers of Connected Mathematics Project. Much of my letter to Phil Daro is given below.
The final paragraph for Recommendation 11 deals with high school mathematics. When asked about the state standards, Brian Sniff remarked that they were being rewritten, but that the changes seem to be minimal. He is on the high school rewrite committee, and I hope he is incorrect about the changes since significant changes should be made. We now have a serious report from the National Mathematics Advisory Panel which was asked to report on algebra. In addition to comments on what is needed to prepare students for algebra, which should have an impact on both elementary and middle school mathematics, there is a good description of what algebra in high school should contain. Some of the books used in MMSD do not have the needed algebra. In addition, the National Council of Teachers of Mathematics has published Curriculum Focal Points for grades PK-8 which should be used for further details in these grades. Neither of these reports was mentioned in the response you were sent.
It’s Thursday afternoon at Madison’s Nuestro Mundo Elementary School and teacher Christina Amberson, “Maestra Cristina” to her kindergarten students, speaks in rapid-fire Spanish. If you didn’t know better, you would assume Spanish was Amberson’s native language. But her impeccable Spanish is a product of many years of studying and teaching abroad in a number of Spanish-speaking countries.
Children respond only in Spanish. The only time they speak English is when English-speaking children are sitting together at tables. If Amberson overhears, she reminds them to use their Spanish.
Amberson’s kindergartners — a nearly even mix of native Spanish speakers and native English speakers — seem more confident with their language than a typical student in a high school or college Spanish class.
Everything posted on the dual-language immersion school’s bulletin boards or blackboards is in Spanish except for a little section of photos and articles about “El Presidente Barack Obama.”
It is ironic that WKCE results are used in this way, given the Wisconsin DPI’s statement: “Schools should not rely on only WKCE data to gauge progress of individual students or to determine effectiveness of programs or curriculum”. Much more on the WKCE here. The Madison School District is using WKCE data for “Value Added Assessment“.
This year marks the ninth year of public reporting on the Board of Education Priorities for reading and mathematics achievement and school attendance. The data present a clear picture of District progress on each of the priorities. The document also reflects the deep commitment of the Madison Metropolitan School District to assuring that all students have the knowledge and skills needed for academic achievement and a successful life.
1. All students complete 3rd grade able to read at grade level or beyond.
- Beginning in the fall of 2005-06, the federal No Child Left Behind Act required all states to test all students in reading from grades 3-8 and once in high school. This test replaced the former Wisconsin Reading Comprehension Test. MMSD now reports on three years of data for students in grade 4.
- District wide 74% of students scored proficient or advanced in reading on the 2007-08 WKCE, which is a 2% decline.
- Hispanic and Other Asian students posted increases in percent of proficient or higher reading levels between 2007 and 2008.
2. All students complete Algebra by the end of 9th grade and Geometry by the end of 10th grade.
- The largest relative gain in Algebra between the previous year measure, 2007-08, and this school year was among African American students.
- Students living in low income households who successfully completed Algebra by grade 10 at the beginning of 2008-09 increased since the previous year.
- The rate for Geometry completions for females continues to be slighter higher than their male counterparts.
3. All students, regardless of racial, ethnic, socioeconomic or linguistic subgroup, attend school at a 94 percent attendance rate at each grade level. The attendance rate of elementary students as a group continues to be above the 94% goal. All ethnic subgroups, except for African American (92.5% rate for 2007-08, 93.0% rate for 2006-07 and 93.1% for the previous two years) continue to meet the 94% attendance goal.
This report includes information about district initiatives that support students’ goal attainment. In the context of the MMSD Educational Framework, the initiatives described for the literacy and the mathematics priorities focus primarily within the LEARNING component and those described for the attendance priority focus primarily within the ENGAGEMENT component. It is important to note that underlying the success of any efforts that focus on LEARNING or ENGAGEMENT is the significance of RELATIONSHIPS.
The USA’s public schools stand to be the biggest winners in Congress’ $825 billion economic stimulus plan unveiled last week. Schools are scheduled to receive nearly $142 billion over the next two years — more than health care, energy or infrastructure projects — and the stimulus could bring school advocates closer than ever to a long-sought dream: full funding of the No Child Left Behind law and other huge federal programs.
But tucked into the text of the proposal’s 328 pages are a few surprises: If they want the money — and they certainly do — schools must spend at least a portion of it on a few of education advocates’ long-sought dreams. In particular, they must develop:
- High-quality educational tests.
- Ways to recruit and retain top teachers in hard-to-staff schools.
- Longitudinal data systems that let schools track long-term progress.
a
The Wisconsin test: WKCE has been criticized for its low standards. More on the WKCE here.
The analysis of data from 27 elementary schools and 11 middle schools is based on scores from the Wisconsin Knowledge and Concepts Examination (WKCE), a state test required by the federal No Child Left Behind law.
Madison is the second Wisconsin district, after Milwaukee, to make a major push toward value-added systems, which are gaining support nationally as an improved way of measuring school performance.
Advocates say it’s better to track specific students’ gains over time than the current system, which holds schools accountable for how many students at a single point in time are rated proficient on state tests.
“This is very important,” Madison schools Superintendent Daniel Nerad said. “We think it’s a particularly fair way … because it’s looking at the growth in that school and ascertaining the influence that the school is having on that outcome.”
The findings will be used to pinpoint effective teaching methods and classroom design strategies, officials said. But they won’t be used to evaluate teachers: That’s forbidden by state law.
The district paid about $60,000 for the study.
Much more on “Value Added Assessment” here.
Ironically, the Wisconsin Department of Public Instruction stated the following:
“… The WKCE is a large-scale assessment designed to provide a snapshot of how well a district or school is doing at helping all students reach proficiency on state standards, with a focus on school and district-level accountability. A large-scale, summative assessment such as the WKCE is not designed to provide diagnostic information about individual students. Those assessments are best done at the local level, where immediate results can be obtained. Schools should not rely on only WKCE data to gauge progress of individual students or to determine effectiveness of programs or curriculum.”
Related:
REMINDER: The MMSD district is holding its second of four “Information Sessions” regarding the referendum tonight (Thursday, October 16), 6:30 pm, Jefferson Middle School. You are urged to attend.
The Madison Metropolitan School District seeks approval of the district taxpayers to permanently exceed the revenue cap for operations money by $13 million a year. In the meantime, to establish that new tax base over the next three years, a total of $27 million in more revenue will have been raised for programs and services. The district has also projected there will continue to be a ‘gap’ or shortfall of revenue to meet expenses of approximately $4 million per year after the next three years, thereby expecting to seek approval for additional spending authority.
Whereas, the Board of Education has staked the future of the district on increased spending to maintain current programs and services for a “high quality education;”
Whereas, student performance on the Wisconsin Knowledge and Concepts Exams has languished at the 7, 8, and 9 deciles (in comparison with the rest of the state’s schools where 1 is the highest level and 10 is the lowest) in 4th, 8th and 10th grade reading, math, science, social studies and language arts exams for the past five years. The total percentage of MMSD students performing at either “proficient” or “advanced” levels (the two highest standards) has consistently ranged in mid 60%s to mid 70%s;
Whereas, the district Drop Out Rate of 2.7% (2006-07) was the highest since 1998-99. With the exception of two years with slight declines, the rate has risen steadily since 1999.
Whereas, the Attendance Rate for all students has remained basically steady since 1998-99 in a range from 95.2% (2005-06) to a high of 96.5% (2001-02);
Whereas, the district Truancy Rate of students habitually truant has risen again in the past three years to 6.0% in 2006-07. The truancy rate has ranged from 6.3% (1999-2000) to 4.4% in 2002-03;
Whereas, the district total PreK-12 enrollment has declined from 25,087 (2000-01) to its second lowest total of 24,540 (2008-09) since that time;
Whereas, the district annual budget has increased from approximately $183 million in 1994-1995 (the first year of revenue caps) to approximately $368 million (2008-09);
Whereas, the board explains the ‘budget gap’ between revenue and expenses as created by the difference between the state mandated Qualified Economic Offer of 3.8% minimum for salary and health benefits for professional teaching staff and the 2.2% average annual increases per student in the property tax levy. The district, however, has agreed with the teachers’ union for an average 4.24% in annual increases since 2001;
Whereas, the district annual cost per pupil is the second highest in the state at $13,280 for the school year 2007-08;
A state-by-state analysis by The New York Times found that in the 40 states reporting on their compliance so far this year, on average, 4 in 10 schools fell short of the law’s testing targets, up from about 3 in 10 last year. Few schools missed targets in states with easy exams, like Wisconsin and Mississippi, but states with tough tests had a harder time. In Hawaii, Massachusetts and New Mexico, which have stringent exams, 60 to 70 percent of schools missed testing goals. And in South Carolina, which has what may be the nation’s most rigorous tests, 83 percent of schools missed targets.
Related:

Page 1, Page 2, Page 3, Page 4.
Related links:
The red pen. In our still largely decentralized public school system, it’s no big surprise that this old-fashioned instrument of ill repute gets starkly different treatment from district to district and state to state. Three locales, in fact, have recently reopened the question, “what’s in a grade”–and come up with very different answers. Perhaps by evaluating these recent conversations, we can imagine what standard GPAs might look like.
Fairfax County, Virginia, parents are outraged that their children must score a 94 to receive an A. Neighboring counties give As for a mere 90, they argue, and they and their kids are being unfairly penalized when competing for college admission, national merit awards, even a lower car insurance bill. Parents have taken up arms in hopes that extended pressure on the district to follow the example of nearby school systems will lead to a lower bar; Fairfax is contemplating doing so.
Fairfax’s one-county crusade against grade inflation is probably sacrificing its students on the altar of its ideals, as parents allege, and remedying that problem is not difficult. Despite cries of the old “slippery slope,” shifting the letter-number ratio to match neighboring counties will ultimately benefit Fairfax students (in the short term at least) when it comes to college admissions and the like.
Pittsburgh has tackled the other end of the grading spectrum. All failing grades (those of 50 or below) will henceforth be marked down as 50 percent credit in grade books. Long on the books but only recently enforced, this policy, the district claims, is simply giving students a better chance to “catch up” in the next quarter since quarters are averaged into semester and yearlong grades. “A failing grade is still a failing grade,” explains district spokeswoman Ebony Pugh. Seems not to matter if it’s a 14 or a 49. Round up to 50.
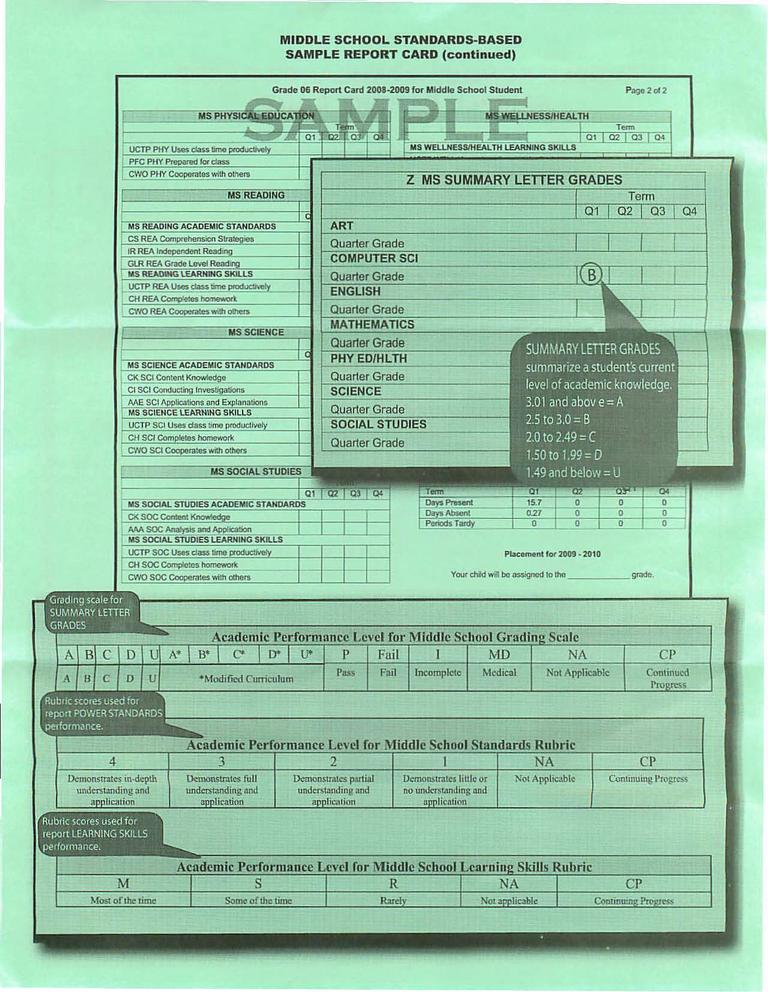
Locally, the Madison School District is implementing “Standards Based Report Cards” in the middle schools.
I’ve wondered what the implementation of this initiative tells parents, citizens and taxpayers, not to mention students about the new Superintendent? See his memo on the subject here. More here.
The State of Wisconsin’s standards are changing, according to this Department of Public Instruction. Peter Sobol’s post on the WKCE’s suitability for tracking student progress is illuminating:
… The WKCE is a large-scale assessment designed to provide a snapshot of how well a district or school is doing at helping all students reach proficiency on state standards, with a focus on school and district-level accountability. A large-scale, summative assessment such as the WKCE is not designed to provide diagnostic information about individual students. Those assessments are best done at the local level, where immediate results can be obtained. Schools should not rely on only WKCE data to gauge progress of individual students or to determine effectiveness of programs or curriculum.
Much more on report cards here.
This is the table of contents to the final findings from the research study of Ohio school district performance on the OPT and OSRC. This site is the data, graph, links, and comment page for Hoover’s research study of Ohio school district proficiency test and school report card performance accountability. These data and findings have been released to the public as of February 27, 2000. The entire study is available online for your use. If you wish to be included in the emailing list of updates about OPT and OSRC issues, click on the logo at the top of this page and send me your request.
The graphs and data presented here are from the final replication of the study. This final analysis represents the culmination of several hundred hours of work put forth to gain empirical insights into OPT performance across all Ohio school districts. At the time the study was completed there were 611 school districts in the State of Ohio. This study uses data from 593 districts out of the 611 total. 18 districts were not included in the study because of incomplete data or because the districts were too small such as North Bass Island. All data were taken from EMIS online data and no data other than the data presented by the State of Ohio were used. My confidence level is high that there are very few errors in the data array. Though errors are certainly possible, I am confident that if they exist they are minor and do not significantly affect the overall conclusions of this study. (RLH)
Scott Elliott has more.
Related: The Madison School District’s “Value Added Assessment” program uses the Wisconsin Department of Public instruction’s WKCE results. The WKCE’s rigor has been criticized.
March 7, 2008 Meeting [rtf / pdf]. Well worth reading for those interested in the use of Connected Math and Core Plus, among others, in our schools.
A few interesting items:
Math Forum audio / video and links.
380K PDF Press Release [AP’s posting of DPI’s press release]:
Results for statewide testing show an overall upward trend for mathematics, stable scores in reading, and a slight narrowing of several achievement gaps. This three-year trend comes at a time when poverty is continuing to increase among Wisconsin students.
The 434,507 students who took the Wisconsin Knowledge and Concepts Examinations (WKCE) and the Wisconsin Alternate Assessment for Students with Disabilities (WAA-SwD) this school year showed gains over the past three years in mathematics in six out of seven grades tested. Reading achievement at the elementary, middle, and high school levels was stable over three years. An analysis of all combined grades indicates a narrowing of some achievement gaps by racial/ethnic group.
“These three years of assessment data show some positive trends. While some results point to achievement gains, we must continue our focus on closing achievement gaps and raising achievement for all students,” said State Superintendent Elizabeth Burmaster.
Andy Hall notes that Madison Trails State Averages [Dane County Test Result Comparison prepared by Andy Hall & Phil Brinkman – pdf]:
But in the Madison School District, just two of the 23 proficiency scores improved, while five were unchanged and 16 declined, according to a Wisconsin State Journal review of the 2006-07 and 2007-08 school year data from the state Department of Public Instruction.
Madison’s scores trail the state average in 22 of the 23 scores. Typically the percentage of Madison students attaining proficient or advanced ratings trails the state average by several percentage points.
“The fact that we’re able to stay close to the state average as our demographics have made dramatic changes, I think is a positive,” said Madison schools Superintendent Art Rainwater, who added that the district’s “strong instructional program” is meeting many of the challenges of immigrant and low-income students while ensuring that “high fliers are still flying high.”
A district analysis shows that when the district’s students are compared with their peers across the state, a higher percentage of Madison students continue to attain “advanced” proficiency scores — the highest category.
Madison students who aren’t from low-income families “continue to outperform their state counterparts,” with higher percentages with advanced scores in reading and math at all seven tested grade levels, the district reported.
Rainwater said he’s long feared that the district’s increasingly needy student population, coupled with the state’s revenue limits that regularly force the district to cut programs and services, someday will cause test scores to drop sharply. But so far, he said, the district’s scores are higher than would be expected, based on research examining the effects of poverty and limited English abilities on achievement.
This school year, 43 percent of Madison students are from low-income families eligible for free and reduced-price lunches, while 16 percent of students are classified as English language learners — numbers that are far above those of any other Dane County school district.
Rainwater noted that students with limited English abilities receive little help while taking the reading and language arts tests in English.
Reading test scores for Madison students changed little compared to 2006-07, but math results decreased in six of the seven grades tested. Of 23 scores in five topics tested statewide, Madison lagged behind state peers in 22 of 23 of those scores.
Madison Superintendent Art Rainwater attributes the district’s performance and trends to the growing population of English language learners in the district.Officials now are able to draw upon three years of results since Wisconsin began administering testing to students in grades three through eight and grade 10 in reading and mathematics. Based on state regulations, students in fourth, eighth and 10th grade were also tested in language arts, science and social studies.
Alan Borsuk on Milwaukee’s results:
But there is little room for debate about what the scores say about the need for improvement in the outcomes for Milwaukee Public Schools students: The gaps between Milwaukee students and the rest of the state remain large, and school improvement efforts of many kinds over the years have not made much of a dent.
The problem is especially vivid when it comes to 10th-graders, the highest grade that is part of Wisconsin’s testing system. The gap between sophomores in Milwaukee and those statewide has grown larger over the last two years, and, once again, no more than 40% of 10th-graders in MPS were rated as proficient or better in any of the five areas tested by the state. For math and science, the figure is under 30%.
Amy Hetzner notes that Waukesha County’s test scores also slipped.
Notes and links regarding the rigor of Wisconsin DPI standards. DPI academic standards home page. Search individual school and district results here. The 2006 Math Forum discussed changes to the DPI math test and local results.
TJ Mertz reviews Wright Middle School’s results.
Chan Stroman’s June, 2007 summary of Madison WKCE PR, data and an interesting discussion. Notes on spin from Jason Spencer.
Jeff Henriques dove into the 2007 WKCE results and found that Madison tested fewer 10th graders than Green Bay, Appleton, Milwaukee and Kenosha. There’s also a useful discussion on Jeff’s post.
Advocating a Standard Grad Rate & Madison’s “2004 Elimination of the Racial Achievement Gap in 3rd Grade Reading Scores”.
Madison School District’s Press Release and analysis: Slight decline on WKCE; non-low income students shine
Susan Troller on retiring Madison Superintendent Art Rainwater:
Later this month, a new contract between Dr. Daniel Nerad and the Madison Metropolitan School District will signal the end of an era. For over a decade, Art Rainwater has been at the helm of Madison’s public schools, guiding the district during a period of rapid demographic change and increasingly painful budget cutting. Both admirers and critics believe Rainwater has had a profound impact on the district.
Retiring Madison schools superintendent Art Rainwater may have the name of a poet, but his first ambition was to be a high school football coach.
“I grew up loving football — still do — especially the intellectual challenge of the game. I was obsessed with it,” Rainwater explained in a recent interview.
In fact, during his early years as an educator, Rainwater was so consumed by his football duties for a Catholic high school in Texas he eventually switched from coaching to school administration for the sake of his family.
In some ways, Rainwater has been an unusual person to lead Madison’s school district — an assertive personality in a town notorious for talking issues to death. His management style grows out of his coaching background — he’s been willing to make unpopular decisions, takes personal responsibility for success or failure, puts a premium on loyalty and hard work and is not swayed by armchair quarterbacks.
A few related links:
Much more on Art here. Like or loath him, Art certainly poured a huge amount of his life into what is a very difficult job. I was always amazed at the early morning emails, then, later, seeing him at an evening event. Best wishes to Art as he moves on.
The study found that “cut scores” – the line between proficient and not proficient – vary widely among the 26 states, casting doubt on the question of what it means when a state says a certain percentage of its students are doing well. Those percentages are central to the way the federal No Child Left Behind education law works.
The law’s accountability system, which focuses on things such as whether a school or district is making “adequate yearly progress,” is driven largely by how many students meet the standards a state sets for proficiency in reading and math. The goal is that all students, with a handful of exceptions, be proficient by 2014.
“Five years into implementation of the No Child Left Behind Act, there is no common understanding of what ‘proficiency’ means. . . . This suggests that the goal of achieving ‘100 percent proficiency’ has no coherent meaning, either,” says a summary of the study, issued by the Washington, D.C.-based Thomas B. Fordham Institute.
To illustrate the differences among the states, the study’s authors gave an example in which a fourth-grader in Wisconsin would be regarded as proficient if the child could correctly answer a fairly simple question involving cats and dogs, while a child in Massachusetts would not be proficient if he or she couldn’t answer a formidable question about the meaning of a passage by Leo Tolstoy.
From the Fordham Institute report:
Cats and Dogs vs. Tolstoy
Wisconsin
This is a fourth-grade item with a difficulty equivalent to Wisconsin’s proficiency cut score (16th percentile).
Which sentence tells a fact, not an opinion?
A. Cats are better than dogs.
B. Cats climb trees better than dogs.
C. Cats are prettier than dogs.
D. Cats have nicer fur than dogs.
Massachusetts
This is a fourth-grade item with a difficulty equivalent to Massachusetts’ proficiency cut score (65th percentile).
Read the excerpt from “How Much Land Does a Man Need?” by Leo Tolstoy
So Pahom was well contented, and everything would have been right if the neighboring peasants would only not have trespassed on his wheatfields and meadows. He appealed to them most civilly, but they still went on; now the herdsmen would let the village cows stray into his meadows, then horses from the night pasture would get among his corn. Pahom turned them out again and again, and forgave their owners, and for a long time he forbore to prosecute anyone. But at last he lost patience and complained to the District Court.
What is a fact from this passage?
A. Pahom owns a vast amount of land.
B. The peasant’s intentions are evil.
C. Pahom is a wealthy man.
D. Pahom complained to the District Court.
Source: Thomas B. Fordham Institute. The correct answers are B for the first item and D for the second.
Fordham Institute Study.
Much more on Wisconsin’s Knowledge & Concepts Exam here [RSS], including a recent Madison School Board Performance & Achievement Committee discussion on using WKCE to “Measure Student Performance“. Clusty Search on WKCE.
Ian Shapira:
A new study of state achievement tests offers evidence that the No Child Left Behind law’s core mission — to push all students to score well in reading and math — is undermined by wide variations in how states define a passing score.
The Madison School Board’s Performance & Achievement Committee met Monday evening. Topics discussed included:
District Goal: Look at the composite overall average growth for the district across all schools and all grade levels in the areas of reading and math. Based on the WKCE scores.
30MB 87 Minute mp3 audio file.
Notes: 56 minutes (Maya Cole): “Why are we using WKCE and how is that going to tie into our curriculum and student improvement so that it ends up back in the classroom and not just measuring test scores?”. Art Rainwater responded that “this kind of measurement is not expected to do the day to day informing of instruction inside the classroom”, “informing the instruction occurs inside the classroom on a day to day basis”. Art also mentioned the District’s “Student Intervention Monitoring system [also SIMS]. [1:00]”.
Susan Troller
The Capital Times
September 25, 2007
Football coach Barry Switzer’s famous quote, “Some people are born on third base and go through life thinking they hit a triple,” could easily apply to schools and school districts that take credit for students who enter school with every advantage and continue as high achievers all along.
But how do you fairly judge the job that teachers, schools and districts with many children who have significant obstacles — obstacles like poverty, low parental expectations, illness and disability or lack of English proficiency — are doing? Likewise, how do you make certain that your top students are adding growth every year as they go through school, rather than just coasting toward some average or proficient standard?
An earlier posting examined the results of the small school initiative at Memorial high school. This post aims to examine West’s SLC grant. Similar to the Memorial grant, the goal of West’s SLC grant was to reduce the achievement gap and to increase students’ sense of community.
The final report is a major source of frustration for anyone who values data analysis and statistics. Essentially, there are no statistics reported. The data is presented in figures that are cluttered and too small, which makes them difficult to interpret. Changes over time are discussed as trends without any sort of statistical tests being reported. Most of the data presented are no more detailed than what anyone can pull off the DPI web site.
Before examining the impact of West’s restructuring on student achievement and on students’ connection to the school, it is necessary to identify just a few of the components of the West proposal that were never enacted:
On to the data…
The Madison Metropolitan School District (MMSD) recently submitted a five year, $5 million grant proposal to the US Department of Education (DOE) to support the creation of Small Learning Communities (SLCs) in all four high schools (See here for post re. grant application). While the grant proposal makes mention of the two smaller SLC grants the district received earlier, there is no examination of the data from those two projects. One would think that DOE would be curious to know if MMSD’s earlier efforts at creating SLCs had produced the desired results before agreeing to provide further funding. Furthermore, one would think it important to examine if the schools implemented the changes that they proposed in their applications. It is my intention to provide some of that analysis over the course of several posts, and I want to encourage other community members to examine the Memorial grant proposal and final report and the West grant and final report themselves.
We begin by examining Memorial High School’s SLC grant which was funded from 2000-2003. Memorial’s SLC grant is a good place to start, not only because it was the first MMSD SLC grant, but because they lay out clearly the outcome measures that they intend to evaluate and their final report provides hard numbers (as opposed to graphics) over a number of years before and after the implementation of the SLC grant. Memorial had two goals for their SLC grant: 1) to reduce the achievement gap and 2) to increase students’ connectedness to the school.
Examining student achievement suggests mixed results for Memorial’s restructuring. Student GPA’s indicate a slight narrowing of the achievement gap for African American students and essentially no change for Hispanic students when compared to their fellow white students over the period of the grant.
| Difference Between |
2000
|
2001
|
2002
|
2003
|
| White & African American |
1.35
|
1.35
|
1.16
|
1.24
|
| White & Hispanic |
0.75
|
0.87
|
0.74
|
0.79
|
Student WKCE performance can be considered an external indicator of student success, and these data indicate no change in the proportion of students scoring at the Proficient and/or Advanced levels, an especially noteworthy result given that the criteria for the WKCEs were lowered in 2002/03 which was the last year of the grant. I’ve included data up through this past school year since that is available on the DPI website, and I’ve only presented data from math and reading in the interests of not overloading SIS readers.
| WKCE | 99/2000 | 2000/01 | 2001/02 | 2002/03 | 2003/04 | 2004/05 | 2005/06 | 2006/07 |
| Reading | ||||||||
| African American |
45.09
|
54.90
|
36.00
|
33.00
|
40.5
|
45.8
|
42.9
|
29.8
|
| Hispanic |
63.16
|
80.00
|
47.00
|
54.00
|
53.6
|
51.7*
|
53.1*
|
29.3*
|
| White |
93.33
|
85.55
|
86.00
|
89.00
|
90.2
|
86.2
|
89.0
|
84.2
|
| Low Income |
53.33
|
56.36
|
36.00
|
36.00
|
32.9
|
40.7
|
43.7
|
25.7
|
| Not Low Income |
88.00
|
86.9
|
84.7
|
89.8
|
80.2
|
|||
| Math | ||||||||
| African American |
18.00
|
27.45
|
20.00
|
29.00**
|
39.2
|
32.2
|
27.3
|
39.4
|
| Hispanic |
42.11
|
40.00
|
33.00
|
49.00
|
42.9
|
62.1*
|
59.4*
|
36.2*
|
| White |
77.44
|
76.48
|
68.00
|
90.00
|
89.7
|
89.3
|
89.0
|
86.4
|
| Low Income |
18.64
|
16.37
|
16.00
|
29.00**
|
29.4
|
38.4
|
38.7
|
35.7
|
| Not Low Income |
90
|
85.8
|
86.9
|
89.2
|
84.2
|
* note. data for Hispanic students includes 4 Native American students in 03/04 and 2 in the following two years
** note. DPI actually reports higher percentages of students scoring proficient/advanced: 34% and 37% respectively for these two cells
The data from DPI looking at ACT test performance and percentage of students tested does not suggest any change has occurred in the last 10 years, so the data presented here would suggest that Memorial’s SLC restructuring hasn’t had any effect on the achievement gap, but what about the other goal, student connectedness?
|
Superintendent Art Rainwater gave a presentation on “Value Added Assessment” to the Madison School Board’s Performance & Achievement committee Monday evening. Art described VAA “as a method to track student growth longitudinally over time and to utilize that data to look at how successful we are at all levels of our organization”. MMSD CIO Kurt Kiefer, Ernie Morgan, Mike Christian and Rob Meyer, a senior scientist at WCER presented this information to the committee (there were two others whose names I could not decipher from the audio). |
Related Links:
“That is, there is no way of knowing whether previous WKCE tests were easier or harder than today’s, and also, DPI has changed the curve. For both reasons, we can’t use WKCE to gauge student progress (or lack of it) over time.
Pause and think about this. DPI says WKCE cannot tell us whether the academic skills of Wisconsin students are improving, staying the same, or getting worse over time.”
The fact that the School Board is actually discussing this topic is a positive change from the recent past. One paradox of this initiative is that while the MMSD is apparently collecting more student performance data, some parents (there are some teachers who provide full report cards) are actually receiving less via the report card reduction activities (more here and here). Perhaps the school district’s new parent portal will provide more up to date student data.
A few interesting quotes from the discussion:
45 minutes: Kurt has built a very rich student database over the years (goes back to 1990).
46 Superintendent Art Rainwater: We used to always have the opinion here that if we didn’t invent it, it couldn’t possibly be any good because we’re so smart that we’ve have thought of it before anybody else if it was any good. Hopefully, we’ve begun to understand that there are 15,000 school districts in America and that all of them are doing some things that we can learn from.
47 Art, continued: It’s a shame Ruth (Robarts) isn’t sitting here because a lot of things that Ruth used to ask us to do that we said we just don’t have the tools to do that with I think, over time, this will give us the tools that we need. More from Ruth here and here.
55 Arlene Silveira asked about staff reaction in Milwaukee and Chicago to this type of analysis.
69 Maya asked about how the School Board will use this to determine if this program or that program is working. Maya also asked earlier about the data source for this analysis, whether it is WKCE or NAEP. Kurt responded that they would use WKCE (which, unfortunately seems to change every few years).
71 Lawrie Kobza: This has been one of the most interesting discussions I’ve been at since I’ve been on the school board.
Lawrie, Arlene and Maya look like they will be rather active over the next 8 months.
Wisconsin students’ performances improved in math and held steady in reading, language arts, science and social studies, according to annual test data released today.
Dane County students generally matched or exceeded state averages and paralleled the state’s rising math scores, although test results in Madison slipped slightly on some measures of reading, language arts and science.
Madison educators touted the overall performance of their students, noting that the portion of students scoring proficient or advanced — the two highest of four grading levels — has grown or held steady over the past seven years on reading and math exams even as the district’s populations of students with limited English skills and low-income backgrounds have increased.
Limited English proficiency and poverty are two of the strongest predictors of poor academic performance in Madison and schools across the nation.
Improved scores in math led state and local school officials to put generally positive faces on the picture painted by student test results being made public today by the Wisconsin Department of Public Instruction.
Higher percentages of students in every grade from third through eighth were rated as “proficient” or “advanced” in math in this year’s round of statewide testing than in the previous year. The 10th-grade figure remained the same.
In reading, the statewide percentage of proficient or better students was steady or slightly improved at every grade level.
“We are on the right track,” Elizabeth Burmaster, state superintendent of public instruction, said in a statement. “Despite increased poverty in Wisconsin, we saw gains at nearly every grade level in mathematics and rising or stable scores for reading.”
Overall, better than 4 out of 5 fourth-graders in Wisconsin were proficient or advanced in reading, and about 3 out of 4 met those standards in math. For 10th-graders, 3 out of 4 were proficient in reading, and 7 out of 10 in math.
Madison schools’ improved math scores might seem to defy some of the laws of logic or probability.
The Madison district, like its counterparts across the state, saw a generally positive trend on math scores, according to data released today regarding scores from the Wisconsin Knowledge and Concepts Examinations that students took last November.
“Our students continue to perform well despite a number of challenges that would normally predict falling scores. We’re pleased, of course, but not surprised that has not been the case here,” Superintendent Art Rainwater noted in an interview this morning.
Rainwater said that changing demographics that include increasing numbers of children from low-income families and those who have limited proficiency in English generally go hand-in-hand with falling scores, but that has not been true in Madison, where test results in reading generally have been holding steady, or in mathematics, where almost all grade levels have improved.
Related:
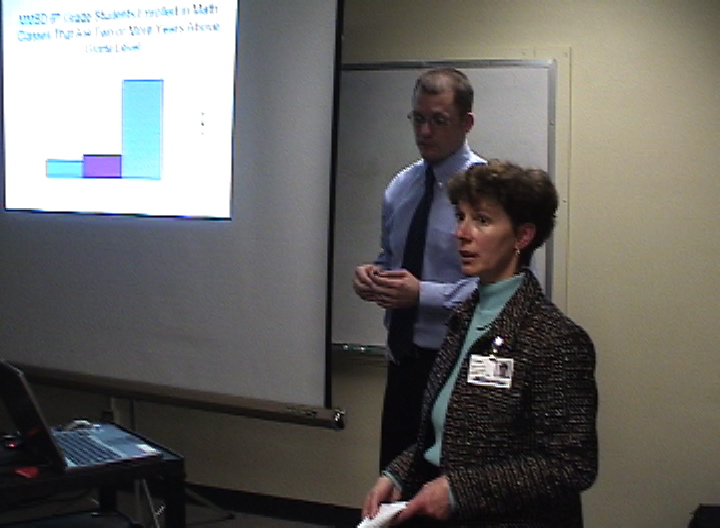
The Madison United for Academic Excellence (MUAE) meeting of 12-December-2006 offered a Question and Answer session with Madison Director of Teaching and Learning, Lisa Wachtel, and Brian Sniff, District K-12 Math Coordinator.
A list of questions was prepared and given to the speakers in advance so they could address the specific concerns of parents.
The video
of the meeting is 130MB, and 1 hour and 30 minutes long. Click on the image at left to watch the video.
The video contains chapter headings which allow quick navigation to sections of the meeting. The video will play immediately, while the file continues to download.
The topics covered during remarks and the question and answer sessions were accompanied by a PowerPoint presentation (here in PDF format), highlights of which are
In light of recent events regarding curriculum and other issues in our high schools, there has been a small step in the right direction at West HS. Superintendent Rainwater announced at our 11/29 MUAE meeting that he has been in discussion with West HS Principal Ed Holmes about providing West 9th and 10th graders who are advanced in language arts the opportunity to skip over English 9 and/or English 10. Advanced placement decisions will be based on grades, teacher recommendation, writing samples, WKCE scores, and ACT/SAT scores. Details will be worked out by Mr. Holmes, the West English Department and District TAG staff.
This small — but important — change brings West more in line with Memorial, the only other high school that has a core English 9 curriculum delivered in completely heterogeneous classes. Every year, four or five academically advanced Memorial freshmen are allowed to go into English 10 — specifically, English 10 Honors. (FYI: Unlike West, Memorial has honors classes in 10th grade; as well, 10th graders can take some of Memorial’s 17 AP classes.) East and LaFollette, of course, have two or three levels of ability/interest-grouped classes for freshman (and sophomore) English — called regular, advanced and TAG at East and regular and advanced at LaFollette — and will continue to have them for at least the next two years.
If you are the parent of a West area 8th or 9th grader who is advanced and highly motivated in English, you might want to consider having your student take either the ACT or SAT through the Midwest Academic Talent Search (MATS) in order to support a request for single subject acceleration. There is still time to register for the MATS online: http://www.ctd.northwestern.edu/mats/index.html
IMPORTANT NOTE: As I see it, this development does not in any way mean we should slow down our lobbying efforts vis a vis the BOE and Administration to get them to make West more like the other high schools — in terms of course offerings and other oportunities for academically advanced students — during the two years of the high school redesign study introduced by Superintendent Rainwater at the 11/27 BOE meeting.
The Madison United for Academic Excellence (MUAE) meeting of 29-November-2006 offered a question and answer session with Madison Superintendent Art Rainwater.
After opening remarks by Jeff Henriques, the Superintendent summarized his goals, rationale and approach to the high school redesign project, and discussed
his prior experience as a teacher and principal.
The video

of the meeting is 183MB, and 1 hours and 30 minutes long. Click on the image at left to watch the video.
The video contains chapter headings which allow quick navigation to sections of the meeting. The video will play immediately, while the file continues to download.
The topics covered during remarks and the question and answer session are
First, I want to say BRAVO, RUTH, for putting it all together and bringing it on home to us. Thanks, too, to the BOE members who overrode BOE President Johnny Winston Jr’s decision to table this important discussion. Finally, deepest thanks to all of the East parents, students and teachers who are speaking out … and to the many West parents, students and teachers who have also spoken out over the past few years.
As we begin what will hopefully be a thoughtful and thoroughgoing community-wide conversation about what’s going on in our high schools, I’d like to clear up some muddiness about what’s happened at West in the past few years. I think it’s important to have our facts straight and complete. In doing so — and in comparing what’s happened at West to what’s now going on at East — I’d like to draw on the image of an animal experiment (that apparently never happened). In one condition, a frog is put into a bath of cool water, the temperature is gradually raised to boiling, and the frog dies without a struggle. In another condition, a frog is put into a bath of boiling water, immediately jumps out, and lives to tell the tale. As I see it, West was put in the first condition. The administration implemented small changes over the course of several years, with the ultimate goal of turning 9th and 10th grades into two more years of middle school. Students and parents were lulled into thinking that everything was O.K. because, hey, what’s one small change? East, in contrast, has been put in the second condition. There, the administration seems to have the same goal of turning 9th and 10th grade into two more years of middle school, but has introduced all of the changes at once. Like the frog placed in the boiling water, East has been shocked into strong reaction.
The issue of curriculum quality and rigor continues to generate attention. P-I:
The good news is that the high school class of 2006 posted the biggest nationwide average score increase on the ACT college entrance exam in 20 years and recorded the highest scores of any class since 1991.
The bad news is that only 21 percent of the students got a passing grade in all four subject areas, including algebra and social science.
“The ACT findings clearly point to the need for high schools to require a rigorous, four-year core curriculum and to offer Advanced Placement classes so that our graduates are prepared to compete and succeed in both college and the work force,” Education Secretary Margaret Spellings said in Washington, D.C.
Alan Borsuk has more:
Wisconsin high school graduates are better prepared to succeed in college than students nationwide – but that means only that more than 70% of state students are at risk of having trouble in one or more freshman-level subjects while the national figure is almost 80%, according to ACT, the college testing company.
The message still isn’t getting across,” Ferguson said in a telephone news conference. If students want to go to college and do well, they have to take high school seriously and take challenging courses, he said.
ACT results showed that students who took at least four years of English and three years each of math, science and social studies in high school did substantially better on the tests (22.9 in Wisconsin, 22.0 nationwide) than those who took lighter loads in those core areas (21.0 and 19.7, respectively).
Elizabeth Burmaster, Wisconsin’s superintendent of public instruction, said she believes that if schools in Wisconsin stay focused on efforts such as early childhood education and small class sizes in the early grades, combined with strong academic programs in middle school and high school, achievement will go up and racial and ethnic gaps will close.
Individual state data is available here.
Burmaster’s statement, along with the ACT information will increase the attention paid to curriculum issues, such as the ongoing questions over the Madison School District’s math program (See UW Math professor Dick Askey’s statement on the MMSD’s interpration and reporting of math scores). Will we stick with the “same service” approach? This very important issue will be on voters minds in November (referendum) and again in April, 2007 when 3 board seats are up for election. See also the West High School Math Faculty letter and a recent open letter to the Madison School District Board and Administration from 35 of the 37 UW Math Department faculty members. Vaishali Honawar has more.
The Madison School District issued a press release on the recent ACT scores (68% of Wisconsin high school graduates took the ACT – I don’t know what the MMSD’s percentage is):
Madison students who took the 2006 ACT college entrance exam continued to outperform their state and national peers by a wide margin, and the scores of Madison’s African-American test takers increased significantly. Madison students’ composite score of 24.2 (scale of 1 to 36) was higher for the 12th straight year than the composite scores of Wisconsin students and those across the nation (see table below). District students outscored their state peers by 9% (24.2 vs. 22.2,) and their national peers by 15% (24.2 vs. 21.1).
Compared to the previous year, the average ACT composite score among the district’s African-American students increased 6% — 18.8 vs. 17.7 last year. The gap between district African-American and white student ACT scores decreased this year. The relative difference this year was 24% (18.8 vs. 24.8) compared to 30% last year.
Scores also increased this year for the district’s Asian students (22.1 to 23.0) and Hispanic students (21.5 to 21.8).
The Madison School District recently published this summary of student performance vs other similar sized and nearby districts (AP, ACT and WKCE) here. Madison’s individual high schools scored as follows: East 22.9, LaFollette 22.1, Memorial 25.1 and West 25.5. I don’t have the % of students who took the ACT.
I checked with Edgewood High School and they have the following information: “almost all students take the ACT” and their composite score is “24.4”. Lakeside in Lake Mills averaged 24.6. Middleton High School’s was 25 in 2005. Verona High School’s numbers:
222 students took the ACT in 2005-2006.
Our composite score was 23.6 compared to the state at 22.2
87% of test takers proved college ready in English Composition (vs. 77%)
66% of test takers proved college ready in College Algebra (vs. 52%)
77% of test takers proved college ready in Social Science (vs. 61%)
45% of test takers proved college ready in Biology (vs. 35%)
37% of test takers proved college ready in all four areas (vs. 28%)
(#) as compared to the state %
Waunakee High School:
Score HS Mean (Core/Non-Core)
Composite 23.3 (24.3/21.5)
English 22.5 (23.9/19.5)
Mathematics 23.2 (24.2/21.8)
Reading 23.3 (24.1/21.5)
Science 23.7 (24.4/22.7)
McFarland High School’s 2006 Composite average was 23.7. 110 students were tested.
UPDATE: A few emails regarding these results:
In the Waunakee information I sent to Jim Z, our mean for the Class of 2006 comes first, followed by the core/non-core in parentheses. So, our mean composite score for our 157 seniors who sat for the ACT was 23.3, the mean composite for those completing the ACT suggested core was 24.3, the mean composite for those who did not complete the core was 21.5.
With ACT profile reports, the student information is self-reported. It’s reasonably accurate, but some students don’t fill in information about course patterns and demographics if it is not required.
Please let me know if there are any other questions.
It appears that Jim Z’s chart comparing scores uses Waunakee’s “Core score” as opposed to the average composite that the other schools (at
least McFaland) gave to Jim Z.. If Jim Z. wishes to report average “Core” for McFarland it is 24.5. Our non-core is 22.2 with our average composite 23.7.
Probably everyone is familiar with the ACT definition of core, but it’s 4 years of English, and three years each of math, science, and social studies. ACT is refining their position on what course patterns best position a student for undergraduate success, however.
Additional comments, data and links here
Many of the nations that have left the United States behind in math and science have ministries of education with clear mandates when it comes to educational quality control. The American system, by contrast, celebrates local autonomy for its schools. When Congress passed the No Child Left Behind Act, it tried to address the quality control problem through annual tests, which the states were supposed to administer in exchange for federal dollars. But things have not quite worked out as planned.
A startling new study shows that many states have a longstanding tradition of setting basement-level educational standards and misleading the public about student performance. The patterns were set long before No Child Left Behind, and it will require more than just passing a law to change them.
Policy Analysis for California Education (PACE), a research institute run jointly by Stanford and the University of California, showed that in many states students who performed brilliantly on state tests scored dismally on the federal National Assessment of Educational Progress, which is currently the strongest, most well-respected test in the country.
The study analyzed state-level testing practices from 1992 to 2005. It found that many states were dumbing down their tests or shifting the proficiency targets in math and reading, creating a fraudulent appearance of progress and making it impossible to tell how well students were actually performing.
Read Wisconsin’s “Broad interpretation of how NCLB progress can be “met” through the WKCE”, Alan Borsuk’s followup article, including Wisconsin DPI comments and UW Math Professor Dick Askey’s comments on “Madison and Wisconsin Math Data, 8th Grade“.
PACE Report: Is the No Child Left Behind Act Working? “The Reliability of How States Track Achievement” [PDF]
Andrew Rotherham has more.
According to the data on DPI’s Web site, the combined percentages for minimum and basic categories (these are below grade level) for MMSD’s 10th graders on the WKCE reading test in November 2004 were:
All students – 26%
African American – 53%
Asian – 29%
Hispanic – 51%
White – 15%
The real shame lies, not in the scores, but in the MMSD’s lack of any systematic program to raise these students’ reading abilities before graduation.
A few schools may offer Read 180, a remedial curriculum praised by staff in the MMSD and other districts.
Pam Nash illustrated the MMSD’s weak commitment to Read 180 in a response to my question on how much money the current budget includes for Read 180. Pam wrote:
The district has not included any specific budget for 2006-07 that would be utilized for READ 180. Individual building principals may utilize existing supply/formula and staffing allocations to provide READ 180 strategies within existing curriculum offerings. Read 180 will be offered at all four high schools and Brearly Street Alternatives. (emphasis added)
Given that implementation of Read 180 costs about $40,000 per school, according to district figures, Read 180 won’t be expanded to schools currently without it.
From the WKCE scores, probably 20% to 26% of MMSD graduates cannot read their diploma, let alone read well enough to continue their education or land a job that pays a living wage. (The percentage might be lower than 20% since many non-readers may drop out before graduation.)
Additionally, the superintendent and some board members like to brag that the MMSD closed the achievement gap because children of color are no longer over represented in the minimum category on the third grade reading test. Obviously, that’s a pitiful claim when more than half of Madison’s African American 10th graders can’t read at grade level.
 Video and audio from Wednesday’s Math Forum are now available [watch the 80 minute video] [mp3 audio file 1, file 2]. This rare event included the following participants:
- Dick Askey (UW Math Professor)
- Faye Hilgart, Madison Metropolitan School District
- Steffen Lempp (MMSD Parent and UW Math Professor)
- Linda McQuillen, Madison Metropolitan School District
- Gabriele Meyer (MMSD Parent and a UW Math Department Lecturer)
- Dr. Terry Millar of the Wisconsin Center for Education Research
The conversation, including audience questions was lively.
Alan Borsuk on Phil McDade’s report for the Wisconsin Policy Research Institute: [250K pdf]
“The growing performance gap is largely influenced by socioeconomic factors beyond the influence of schools,” McDade said. “Property wealth, poverty and race were found to affect student performance.”
The per-student spending difference was much smaller than the difference in test scores and actually was smaller in 2003-’04 than it was seven years earlier, leading McDade to conclude that increased spending would not be a key to closing the gap.
Even though the roots of the gap are in matters such as poverty, McDade suggested that policy makers consider steps to increase academic performance of high school students, including stronger graduation requirements, tougher admissions standards to University of Wisconsin campuses and increased emphasis on sending more high school graduates to college.
According to the report, Madison High Schools (along with Verona, Middleton-Cross Plains, Wisconsin Heights, Monticello, Monona Grove and Waunakee) were in the top 10% based on 1996-1997 WKCE results in. However, they (Madison) were no longer present in the top 10% based on 2003/2004 results (Deerfield, Dodgeville, Middleton-Cross Plains, McFarland, Waunakee and Verona were in the top 10% based on the 2003/2004 data).
SIP Goal #2: Literacy-All students at John Muir will be proficient readers by the end of third grade.
Rationale: 50% of African Americans beginning fourth graders have minimal or basic reading skills as measured by the WKCE test. As a school, all students need to demonstrate proficient or advanced reading and writing skills. All classroom teachers will implement components of a Balance Literacy program. Students will have increased opportunities to read and practice their skills using a variety of ficion and non-fiction texts.
Sam Dillon, New York Times writes:
“After Tennessee tested its eighth-grade students in math this year, state officials at a jubilant news conference called the results a “cause for celebration.” Eighty-seven percent of students performed at or above the proficiency level.”
The WKCE test taken in Fall 2005 (reported in Spring 2005) shows statewide percent performing at minimal (below basic level) in Grade 4 Reading: 4%; Grade 4 Math: 16%; Grade 8 Reading: 6%; Grade 8 Math: 11%.
The WKCE test results for test taken in Fall 2004 (reported in Spring 2005) shows MMSD percent performing at minimal level in Grade 4 Reading: 5%; Grade 4 Math: 16%; Grade 8 Reading: 3%; Grade 8 Math: 10%.
National Assessment of Educational Progress – Also known as “The Nation’s Report Card” is the only national standardized continuing assessment administered periodically by the US Dept. Of Education in reading, math, science, writing, US history, civics, geography, and the arts to random schools in each state to evaluate national performance of students ages 7, 12, 14, and 17.
The 2005 NAEP results for Grade 4 Reading: 33%; Grade 8 Reading: 23%; Grade 4 Math: 16%; Grade 8 Math: 24%.
Dear La Follette Parents & Taxpayers,
I am writing because I am greatly distressed about conditions at La Follette High School under the 4-block system. I strongly believe that as parents and taxpayers you have the right to be included in the debate about your child’s education. Because I believe the future of the 4-block will be decided in the near future I am compelled to provide you with some information.
Students in the traditional MMSD high schools are required to spend 50% of the credits required for graduation in academic areas. La Follette students are required to spend only 42% of their time in academic areas. Why does the district believe that La Follette students need less time in academic areas? Do the taxpayers support this decision? I understand that this is a debatable question. What I do not understand is why there is a different answer for La Follette students.
Ruth Robarts wrote:
Thanks to Jason Shepard for highlighting comments of UW Psychology Professor Mark Seidenberg at the Dec. 13 Madison School Board meeting in his article, Not all good news on reading. Dr. Seidenberg asked important questions following the administrations presentation on the reading program. One question was whether the district should measure the effectiveness of its reading program by the percentages of third-graders scoring at proficient or advanced on the Wisconsin Reading Comprehension Test (WRCT). He suggested that the scores may be improving because the tests arent that rigorous.
I have reflected on his comment and decided that he is correct.
Using success on the WRCT as our measurement of student achievement likely overstates the reading skills of our students. The WRCT—like the Wisconsin Knowledge and Concepts Examination (WKCE) given in major subject areas in fourth, eighth and tenth grades— measures student performance against standards developed in Wisconsin. The more teaching in Wisconsin schools aims at success on the WRCT or WKCE, the more likely it is that student scores will improve. If the tests provide an accurate, objective assessment of reading skills, then rising percentages of students who score at the proficient and advanced levels would mean that more children are reaching desirable reading competence.
However, there are reasons to doubt that high percentages of students scoring at these levels on the WRCT mean that high percentages of students are very proficient readers. High scores on Wisconsin tests do not correlate with high scores on the more rigorous National Assessment of Educational Progress (NAEP) tests.
In 2003, 80% of Wisconsin fourth graders scored proficient or advanced on the WCKE in reading. However, in the same year only 33% of Wisconsin fourth graders reached the proficient or advanced level in reading on the NAEP. Because the performance of Madison students on the WCKE reading tests mirrors the performance of students statewide, it is reasonable to conclude that many of Madisons proficient and advanced readers would also score much lower on the NAEP. For more information about the gap between scores on the WKCE and the NAEP in reading and math, see EdWatch Online 2004 State Summary Reports at www.edtrust.org.
Next year the federal No Child Left Behind Act replaces the Wisconsin subject area tests with national tests. In view of this change and questions about the value of WRCT scores, its time for the Board of Education to review its benchmarks for progress on its goal of all third-graders reading at grade level by the end of third grade.
Ruth Robarts
Member, Madison Board of Education
This is my first post to this blog, so I�ll start by introducing myself. My name is Bill Herman. I have two kids at Crestwood ES, and a third will start in the fall. Also, I work in K-12 education; I�m the technology director for Monona Grove Schools.
I read �Paper #1,� criticizing MMSD for declining $2 million of federal money for reading, with interest and some dismay. With interest because it does seem odd that the district would reject such a sum even if some strings are attached. With dismay because neither side in the debate had a good way to weigh the district�s key claim�that the existing program has improved student reading.
Both sides used WKCE scores to support their claims. Unfortunately, the WKCE is not a useful tool to assess the effectiveness of programs at MMSD or anywhere else, because it isn�t designed to measure student progress over time, or to compare scores from one year with scores from another year. This means that we have a bigger problem than not knowing if elementary reading instruction is effective in MMSD. We are not able to decisively assess the effectiveness of any instructional program in the Madison schools.
Madison Schools Superintendent Art Rainwater sent me an email today regarding this paper. Here’s his email:
Dear Jim
I received a copy of your email to Diane Mayerfeld regarding reading in the Madison Schools. I would like to set straight the misinformation that is contained in the document that you included with your email. First the Milwaukee Public Schools have not performed better on the fourth grade WKCE test that Madison. The report cites “School Facts 03” as the source. The numbers in that publication show that in Madison 80% of our fourth graders scored proficient and advanced on the test and that only 63% of Milwaukee”s fourth graders scored proficient and advanced. I am not sure how such an error could have occurred in the document that you produced since the numbers in the report are very clear. An examination of the DPI WINNS website shows the same numbers.
I find this type of inaccuracy extremely disturbing since inaccurate numbers were also used in the Wisconsin State Journal editorial regarding the Reading First grant. The editorial states that Lincoln’s third grade reading scores have declined since 2001, when in fact, they have steadily increased. The editorial writer had the chart showing the increase in performance before her when she wrote the editorial.
There are always legitimate disagreements that can be made over many of the decisions that the District makes. However, using inaccurate and clearly wrong data to make those arguments should never be acceptable.
The Performance Series Report also indicates that there was a choice between Reading Recovery and the programs approved under the Reading First grant for funding. That assertion is not accurate. Reading Recovery was not part of the issue at all. The choice was between our Balanced Literacy Core Program (CLIP) and the Reading first programs. Reading Recovery is a first grade intervention not a core program. The following explanation written by the team that actually worked on the Reading First grant and have extraordinary expertise in reading says it much better than I can.

schoolinfosystem.org
