Search Results for: Measure of academic progress
Measures of Academic Progress Conflict in Seattle May Affect Wisconsin
MAP is very different from the WKCE. It is given by computer, it is given three times a year (in most schools), and results are known immediately. I’ve sat in on teacher meetings where MAP results were being used well to diagnose students’ progress and prod good discussion of what teachers could do to seek better results.
Some school districts (West Allis-West Milwaukee is one) are using MAP results as part of evaluating teachers. Milwaukee Public Schools, which began using MAP several years ago, isn’t doing that, but it is using overall MAP results as an important component of judging whether a school is meeting its goals.
MAP is an “adaptive” test – that is, the computer program modifies each test based on how a child answers each question. Get a question right and the next question is harder. Get a question wrong and the next one is easier. This allows the results to pinpoint more exactly how a child is doing and aims to have every student challenged – the best don’t breeze through, the worst don’t give up when they’re entirely lost.
MAP tests are generally given three times a year, which is one of the things supporters like and critics hate. On the one hand, you get data frequently and can make mid-course corrections. On the other hand, it means more times in the year when school life is disrupted.
A MAP spokeswoman said in December there were 287 “partners” in Wisconsin, ranging from MPS down to individual private schools. Many suburban districts use MAP, as do many Catholic and other private schools and charter schools.
At a lot of schools in southeastern Wisconsin, there is enthusiasm for using MAP and it is seen as a good way to judge how kids are doing and to determine what to focus on in helping them.Madison recently began using “Measures of Academic Progress”.
An Update on Madison’s Use of the MAP (Measures of Academic Progress) Assessment
Madison Superintendent Jane BelmoreUnlike other assessments, MAP measures both student performance and growth through administering the test in both fall and spring. No matter where a student starts, MAP allows us to measure how effective that student’s school environment was in moving that student forward academically.
This fall’s administration serves as a baseline for that fall to spring growth measure. It also serves as an indicator for teachers. As we continue professional development around MAP, we will work to equip schools to use this data at the classroom and individual student level. In other words, at its fullest use, a teacher could look at MAP data and make adjustments for the classroom or individual students based on where that year’s class is in the fall, according to these results.
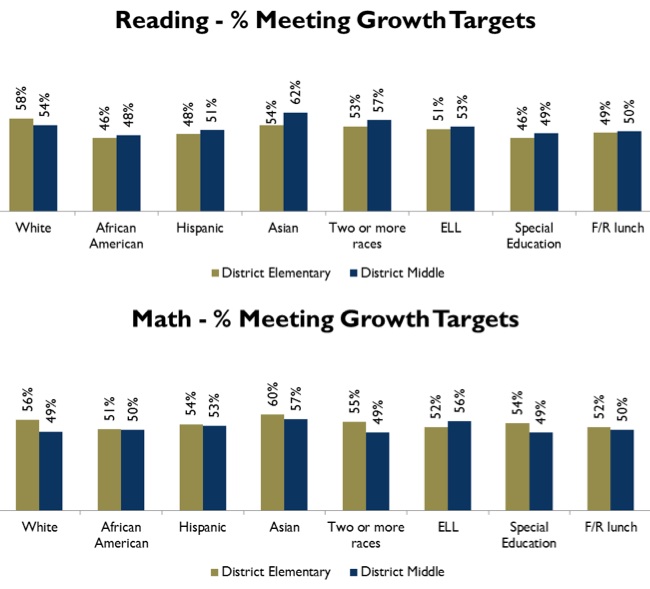
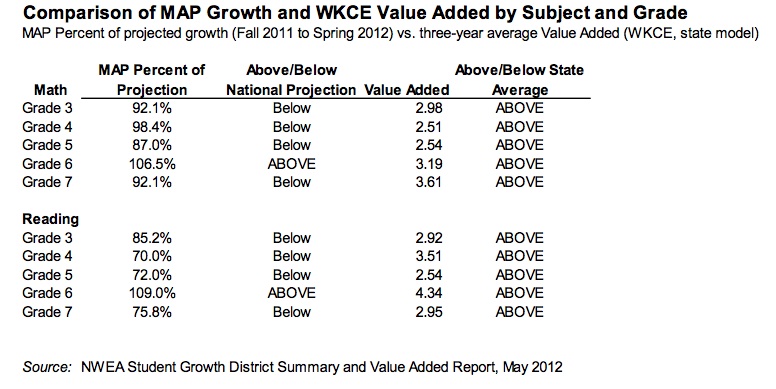
Meeting growth targets on the fall administration indicates that a student met or exceeded typical growth from Fall 2011 to Fall 2012. Typical growth is based on a student’s grade and prior score; students whose scores are lower relative to their grade level are expected to grow more than students whose scores are higher relative to their grade level.
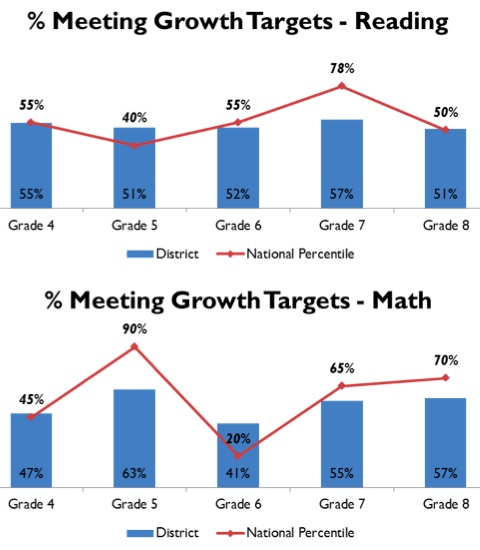
In Reading, more than 50% of students in every grade met their growth targets from Fall 2011 to Fall 2012. In Mathematics, between 41% and 63% of students at each grade level met their growth targets. The highest growth in Mathematics occurred from fourth to fifth grade (63%) and the lowest growth occurred from fifth to sixth grade (41%).
It is important to note that across student groups, the percent of students making expected growth is relatively consistent. Each student’s growth target is based on his or her performance on previous administrations of MAP. The fact that percent of students making expected growth is consistent across student subgroups indicates that if that trend continues, gaps would close over time. In some cases, a higher percentage of minority students reached their growth targets relative to white students. For example, at the middle school level, 49% of white students met growth targets, but 50% of African American students and 53% of Hispanic students met their growth targets. In addition, English Language Learners, special education students, and students receiving free and reduced lunch grew at similar rates to their peers.
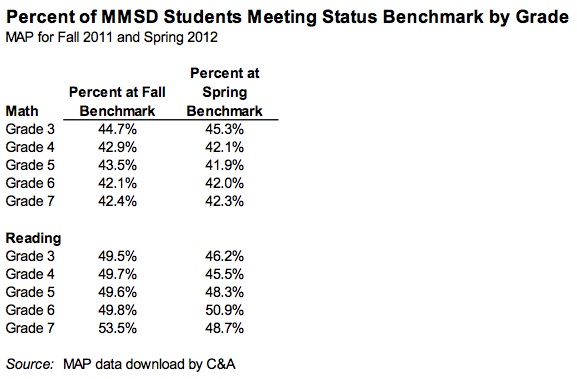
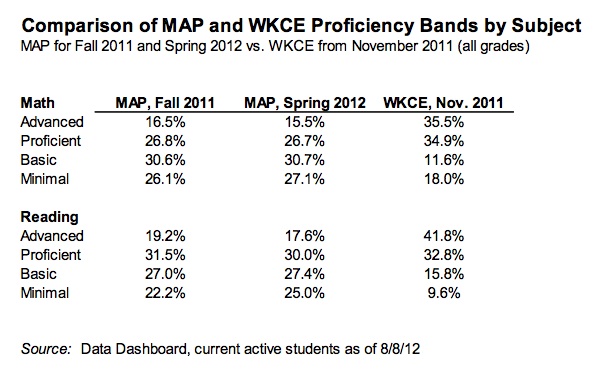
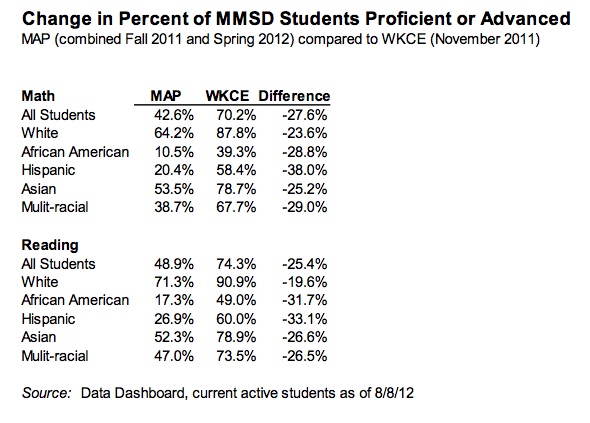
MAP also provides status benchmarks that reflect the new, more rigorous NAEP standards. Meeting status benchmarks indicates that a student would be expected to score “Proficient” or “Advanced” on the next administration of the Wisconsin Knowledge and Concepts Examination (WKCE).
That means that even though overall scores haven’t changed dramatically from last year, the percent of students identified as proficient or advanced will look different with these benchmarks. That is not unique for MMSD – schools around the state and nation are seeing this as they also work toward the common core.
While these scores are different than what we have been used to, it is important to remember that higher standards are a good thing for our students, our districts and our community. It means holding ourselves to the standards of an increasingly challenging, fast-paced world and economy. States all around the country, including Wisconsin, are adopting these standards and aligning their work to them.
As we align our work to the common core standards, student achievement will be measured using new, national standards. These are very high standards that will truly prepare our students to be competitive in a fast-paced global economy.
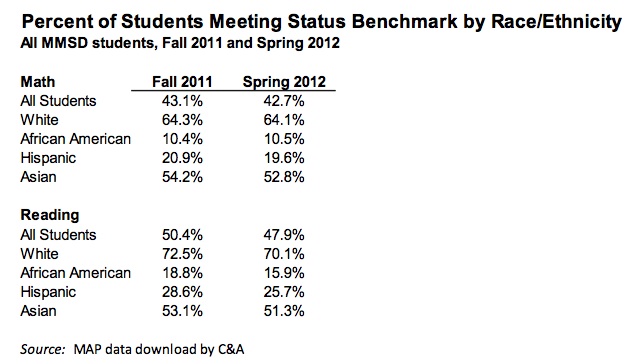
At each grade level, between 32% and 37% of students met status benchmarks in Reading and between 36% and 44% met status benchmarks in Mathematics. Scores were highest for white students, followed by Asian students, students identified as two or more races, Hispanic students, and African-American students. These patterns are consistent across grades and subjects.
Attachment #1 shows the percentage of students meeting status benchmarks and growth targets by grade, subgroup, and grade and subgroup. School- and student-level reports are produced by NWEA and used for internal planning purposes.Related: 2011-2012 Madison School District MAP Reports (PDF Documents):
- District Summary
- District Growth Summary
- Growth by Ethnicity
- Allis Elementary
- Black hawk Middle School
- Chavez Elementary School
- Cherokee Middle School
- Crestwood Elementary School
- Elvehjem Elementary School
- Emerson Elementary School
- Falk Elementary School
- Glendale Elementary School
- Gompers Elementary School
- Hamilton Middle School
- Hawthorne Elementary School
- Huegel Elementary School
- Jefferson Middle School
- Kennedy Elementary School
- Lake View Elementary School
- Leopold Elementary School
- Mendota Elementary School
- Nuestro Mundo Elementary School
- O’Keeffe Middle School
- Olson Elementary School
- Orchard Ridge Elementary School
- Randall Elementary School
- Sandburg Elementary School
- Schenck Elementary School
- Sennett Middle School
- Sherman Middle School
- Shorewood Elementary School
- Spring Harbor Middle School
- Stephens Elementary School
- Thoreau Elementary School
- Toki Elementary School
- Van Hise Elementary School
- White Horse Middle School
- Wright Middle School
I requested MAP results from suburban Madison Districts and have received Waunakee’s Student Assessment Results (4MB PDF) thus far.
Madison Schools’ Measures of Academic Progress (MAP) Assessment Results Released
Interim Madison Superintendent Jane Belmore (175K PDF):
The Measures of Academic Progress (MAP) is a computer adaptive series of assessments from the North West Evaluation Association (NWEA). There are tests in reading, language usage and math.
When taking a MAP test, the difficulty of each question is based on how well a student answers all the previous questions. As the student answers correctly, questions become more difficult. If the student answers incorrectly, the questions become easier. In an optimal test, a student answers approximately half the items correctly and half incorrectly. The final score is an estimate of the student’s achievement level. Each test takes approximately 50 minutes to complete.
MMSD has chosen to administer MAP for the following reasons:
- It helps ensure technical infrastructure to support implementation of Smarter Balanced Assessment.
- Rapid turn-around of classroom, school and district level data.
- Nationally normed results give a more accurate picture of MMSD’s standing.
- MAP measures student achievement growth in content area and within strands in a content area.
- Beginning 2012-13, MAP will be aligned with the Common Core State Standards
- MAP is not high stakes. It is not reported to the state for accountability purposes, but rather for district and school improvement.
In 2011-12, MAP was administered for Grades 3 through 7. In 2012-13, it will be expanded to include Grade 8. The default is to provide the test to all students, but MMSD has the ability to use judgment for students with disabilities. So, not all special education students will take MAP. Also, MAP is not for ELL levels 1 or 2.
I’m glad the Madison Schools published this information, and that they are implementing a much more rigorous assessment than the oft-criticized WKCE. I look forward to seeing the District’s report on the EXPLORE assessment, as well.
Nearby Monona Grove has used the MAP assessment for a number of years. It would be interesting to see how the Districts compare.
Matthew DeFour and TJ Mertz comment.
Students exceeded a typical year’s progress in math and reading, but slower gains among poor students have widened the achievement gap.
By Carrie Spector A new report by researchers at Stanford and Harvard shows that U.S. students achieved historic gains in math and reading during the 2022-23 school year, the first full year of recovery from the pandemic. The report, which measures the pace of academic recovery during the 2022-23 school year for school districts in 30 […]
“For Black and Native American students and for faculty from all underrepresented populations, there was effectively no progress from 2013 to 2020,” the analysis found.
Diana Ellsworth, Erin Harding, Jonathan Law, and Duwain Pinder Despite ongoing efforts, our analysis suggests that historically marginalized racial and ethnic populations—Black, Hispanic and Latino, and Native American and Pacific Islander—are still underrepresented in higher education among undergraduates and faculty and in leadership. Students from these groups also have worse academic outcomes as measured by […]
The Rise and Fall of Science: “despite massively increasing the number of people working in academia, we’ve seen an absolute decline in the rate of major theoretical progress in most academic fields”
Ideas and data: To begin with, it is necessary to make clear how we go about measuring scientific progress. Broadly speaking, there are two ways of quantitatively measuring this construct. First, there is the subjective approach. This approach measures scientific progress during a time period by counting up the number of important events which occurred during […]
Wisconsin Academic Result commentary: writer fails to mention thousands of DPI eLementary Reading teacher mulligans
Logan Wroge: For example, white students in fifth grade dropped 4.6 percentage points in English/language arts proficiency compared to a 1.6 percentage-point decrease for black students in fifth grade. In the eighth grade, the percentage of African American students scoring proficient or advanced in English/language arts rose 2 percentage points to 12.1%, while the percentage […]
Madison Middle School Academic Performance and Variation…
Madison School District Administration (PDF): “Inconsistency in grading and academic expectations between the middle schools may contribute to difficulty in transitioning to high school. The differences between the feeder middle schools are significant.” – MMSD Coursework Review, 2014 A recent tax increase referendum funded the expansion of Madison’s least diverse middle school: Hamilton. We’ve long […]
On Academic Diversity
Karen Herzog: Campuses in the University of Wisconsin System have been abuzz since last week, when Republican Assembly Speaker Robin Vos cited data he obtained through an open records request to support his claim that campuses “more times than not” seek “a liberal-minded individual to disperse information to the young, developing minds who pay them […]
Court rules against measure letting Scott Walker halt school administrative rules
Patrick Marley: Parents of students and members of teachers unions sued Walker over the law as it applied to rules put together by the Department of Public Instruction, which is headed by Evers. Walker is a Republican and Evers is aligned with Democrats, though his post is officially nonpartisan. The state constitution says that “the […]
Update on the Building the Madison School District’s Future: Measuring Progress on Priorities report
Jane Belmore (PDF):
Superintendent Jane Belmore (4MB PDF):The Building Our Future plan provides direction for improving student achievement and district accountability. The plan identifies specific strategies and corresponding measures to meet the four overarching priorities of the district. The measures provide data to monitor progress towards improvement.
The key reason to include district and program measures in this report is to make sure that the Building Our Future plan is contributing to closing achievement gaps. Each program and initiative in Building Our Future is based on extensive research and planning. However, it is important to connect these initiatives to tangible outcomes. Tracking these measures helps increase accountability, allocate resources effectively and efficiently, and continuously improve our efforts to educate all students.
District Priorities: MMSD Management Team identified overarching district priorities in the areas of Attendance, Behavior, Growth and Achievement. The rationale for these priorities is based on the following theory of action:
When our teachers apply strong, explicit teaching skills within an aligned multi-tiered system of instruction and support, and students attend school regularly with behavior that positively impacts their learning and the learning environment, then students will show academic achievement, and social and emotional growth and gaps in learning and achievement will close.
This report outlines 2011-12 progress indicators for each of these priorities and includes historical data when appropriate.
Strategies: Each initiative in Building Our Future is outlined in the report, including a narrative description, the alignment to district priorities, the primary contact(s), action steps, and objectives with annual progress measures. When available, data from 2011- 12 on key progress indicators is included, along with relevant history for comparison. The approved 2012-13 budget for each strategy will also be integrated into the report to help contextualize how MMSD will allocate resources for this initiative moving forward.
Goal setting: This update includes a discussion on the methods used to set goals associated with each strategy. These are described in Attachment 3 and use literacy goals for Chapter 1, Strategy #1 as an example.
Is California’s “API Growth” A Good Measure Of School Performance?
California calls its “Academic Performance Index” (API) the “cornerstone” of its accountability system. The API is calculated as a weighted average of the proportions of students meeting proficiency and other cutoffs on the state exams.
It is a high-stakes measure. “Growth” in schools’ API scores determines whether they meet federal AYP requirements, and it is also important in the state’s own accountability regime. In addition, toward the middle of last month, the California Charter Schools Association called for the closing of ten charter schools based in part on their (three-year) API “growth” rates.
Putting aside the question of whether the API is a valid measure of student performance in any given year, using year-to-year changes in API scores in high-stakes decisions is highly problematic. The API is cross-sectional measure – it doesn’t follow students over time – and so one must assume that year-to-year changes in a school’s index do not reflect a shift in demographics or other characteristics of the cohorts of students taking the tests. Moreover, even if the changes in API scores do in fact reflect “real” progress, they do not account for all the factors outside of schools’ control that might affect performance, such as funding and differences in students’ backgrounds (see here and here, or this Mathematica paper, for more on these issues).
Harvard study gives Race to Top winners bad grades on academic standards
One of the two states chosen by Education Secretary Arne Duncan as a winner in the first round of the $4 billion Race to the Top competition has academic standards that earned the grade of ‘F’ in a new study by Harvard University researchers, while the other state got a ‘C minus.’
The Education Next report by researchers Paul E. Peterson and Carlos Xabel Lastra-Anadón also shows that standards in most states remain far below the proficiency standard set by the National Assessment of Educational Progress. NAEP is known as the nation’s report card because it tests students across the country by the same measure and is considered the testing gold standard. States have their own individual student assessments designed to test students’ knowledge of state academic standards, which are all different.
This study, available on the Education Next website, comes on the heels of another analysis done by the Washington D.C.-based Economic Policy Institute, which concluded that the two first-round winning states, Tennessee and Delaware, were chosen through “arbitrary criteria” rather than through a rigorous scientific process.
Keeping Score When It Counts: Assessing the 2009‐10 Bowl‐bound College Football Teams – Academic Performance Improves but Race Still Matters
Institute for Diversity and Ethics in Sports [182K PDF]:
Overall academic progress continued while the gap between white and African‐American football student‐athletes increased slightly for the 67* Football Bowl Subdivision (FBS) schools (formerly known as Division I‐A schools) playing in this year’s college football bowl games according to a study released today by The Institute for Diversity and Ethics in Sport (TIDES) at the University of Central Florida.
Richard Lapchick, the Director of TIDES and the primary author of the study Keeping Score When It Counts: Assessing the 2009‐10 Bowl‐bound College Football Teams – Academic Performance Improves but Race Still Matters, noted that, “The academic success of big time college student‐athletes that grew continuously under the leadership of the late Dr. Myles Brand continued this year and will be part of his legacy. The new study shows additional progress and reinforces the success of Dr. Brand’s academic reform package. This year, 91 percent (61 of the 67 schools), the same as in the 2008‐09 report and up from 88 percent in the 2007‐08 report, had at least a 50 percent graduation rate for their football teams; approximately 90 percent of the teams received a score of more than 925 on the NCAA’s Academic Progress Rate (APR) versus 88 percent in the 2008‐09 report.”
The NCAA created the APR in 2004 as part of an academic reform package designed to more accurately measure student‐athlete’s academic success as well as improve graduation rates at member institutions.
Lapchick added that, “In spite of the good news, the study showed that the disturbing gap between white and African‐American football student‐athletes remains a major issue; 21 teams or 31 percent of the bowl‐bound schools graduated less than half of their African‐American football student‐athletes, while only two schools graduated less than half of their white football student‐athletes.”
Are Wisconsin Students Progressing?
The Wisconsin Taxpayer [Request a Copy]:
Wisconsin spent more than $10 billion in 2008-09 to educate 861,000 public school students. At more than $11,000 per student, this represents a public investment of over $I50,000 per student over their 13-year elementary and high school career.
The success of any investment-public or private-is measured by comparing its return wilh the amount invested. With public education, measuring returns can be difficult.
In an attempt to measure student progress, Wisconsin has tested public school students using the Wisconsin Knowledge and Concepts Exams (WKCE) since thc mid-
I990s. The tests are based on Wisconsin’s Model Academic Standards. Although not a perfect measure of how students (and schools) are doing, the results can provide useful information on academic progress.
MEASURING PROGRESS
The federal No Child Left Behind Act (NCLB), which was passed with bipartisan support in 2001, requires thai “not later than 12 years after the end of the 2001-02 school year, all students … will meet or exceed the State’s proficient level of academic achievement on the State assessments.” Wisconsin uses the WKCE to test public school students in reading and math in third through eighth grades, and again in 10th grade. In fourth, eighth and 10th grades, Wisconsin tests students in language arts, science and social studies, as well as reading and math. Student test scores are rated as minimal, basic, proficient, or advanced.
“Value Added Assessment” Madison School Board’s Performance & Achievement Committee Looks at “A Model to Measure Student Performance”
Video / 20MB Mp3 Audio Superintendent Art Rainwater gave a presentation on “Value Added Assessment” to the Madison School Board’s Performance & Achievement committee Monday evening. Art described VAA “as a method to track student growth longitudinally over time and to utilize that data to look at how successful we are at all levels of […]
Wisconsin’s “Broad interpretation of how NCLB progress can be “met” through the WKCE”
A reader involved in these issues forwarded this article by Kevin Carey: Hot Air: How States Inflate Their Educational Progress Under NCLB [Full Report: 180K PDF] Critics on both the Left and the Right have charged that the No Child Left Behind Act tramples states’ rights by imposing a federally mandated, one-size-fits-all accountability system on […]
Academic gap shrinks; both levels drop
A telling conclusion of the report was that schools with the highest
achievement levels among black students – such as Clayton, Webster Groves and Kirkwood – often also had the greatest gap in achievement levels between whites and blacks.
Examining Student Scores for Opportunities for Academic Improvement
Jay Mathews, Washington Post staff writer, wrote an article in the December 14, 2004 Washington Post (Mining Scores for Nuances in Improvement) about using value-added assessments, which “…use test scores to compare each child’s progress to predictions based on past performance…” Not everyone is pleased with value-added assessments. “Value-added assessment has also become a political […]
More “A” grades in the Madison School District
Scott Girard: Madison Metropolitan School District high school students got a higher percentage of A grades in the 2020-21 pandemic school year than they did during the 2018-19 school year, new data show. The data provide another measure of academic progress during one of the most challenging years in education in recent memory. It’s a […]
“In addition, we see that very few schools actually achieved growth improvements of 5% or more, with changes in growth generally clustering around 0%.” Slide updates on Madison’s $500M+ Government School System
PDF slides from a recent Madison School District Quarterly Board retreat. Readers may wish to understand “MAP” or “Measure of Academic Progress” [duck duck go SIS 2012 Madison and Waunakee results] Using MAP for Strategic Framework Milestones and SIP Metrics Feedback from various stakeholders has led us to examine the use of MAP (Measures of […]
Volunteers Sought for Area Schools
Nicholas Heynen: Verona elementary school students who participated in the United Way of Dane County-led Schools of Hope tutoring program showed better-than-expected improvement in reading and class-participation last year, according to program organizers who are kicking off a major volunteer recruitment effort this week. The Schools of Hope program began in 1995 in Madison as […]
Reading Recovery: More chipping and shredding in Fargo!
What makes this article from Fargo interesting is how it almost exactly mirrors the findings in my home district, Hortonville, and the recent analysis of Reading Recovery done in Madison. That being, a 50% success rate for RR students. From the article: “However, West Fargo student data over time, as presented by Director of Knowledge […]
“unlike Western schools that hide grades to protect feelings”
Pavel Du Rove: telegram post – Happy Chinese New Year! Following the success of the Chinese startup DeepSeek, many are surprised at how quickly China has caught up with the US in Al. However, China’s progress in algorithmic efficiency hasn’t come out of nothing. Chinese students have long outperformed others in math and programming at […]
DPI dragging heels on science-based literacy instruction Taxpayer funded Wisconsin
Leila Fletcher and Sandy Flores Ruiz We are concerned that Wisconsin’s Department of Public Instruction seems less than committed to the reforms outlined in Act 20. It’s been over a year since Gov. Tony Evers signed Act 20, dubbed “the reading bill.” Act 20 looks to address our state’s dismal reading scores with science-based literacy […]
Money and Ohio charter schools
Stéphane Lavertu, Foreword by: Aaron Churchill Chad L. Aldis
Commentary on Standardized tests
Christopher Martell: This is not a post about what standardized tests do. The reality is that educational assessment is a complicated process. High-quality standardized tests can be helpful in assessing what students know, but they do not always measure what they intend to measure. More importantly, they are also only one of many assessments that teachers and schools use […]
Education fads will make learning decline worse
Joanne Jacobs “As bad as the pandemic was for student learning,” some education fads will make it worse, writes Greg Richmond, superintendent of schools for the Archdiocese of Chicago. Across the country, schools are moving away from homework, grades, attendance and academic honors, he writes. “Numerous public school districts now prohibit teachers from giving students a score […]
Improving third-grade scores and the number of graduates ready for college are among DISD trustees’ goals for the new leader.
Megan Mangrum: The metric is one of five incentives trustees decided to include in its annual superintendent evaluation. The incentives mirror the district’s overall student outcome goals, which the board approved last month. “I for one deeply appreciate the direct alignment between the evaluation and what this board unanimously agreed [are] the most important things for […]
“it was a for vote to put performance over performativeness”
Clara Jeffery: But let’s review the array of irritants. Remote learning: Against every other issue I’m about to name, some of which were on a slow boil before the pandemic, you need to understand that SF schools stayed closed until the fall of 2021, longer than most districts in America. Now: SF takes the pandemic damn […]
America’s reading problem: Scores were dropping even before the pandemic
Remote classes made things worse
Jill Barshay, Hillary Flynn, Chelsea Sheasley, Talia Richman, Dahlia Bazzaz and Rebecca Griesbach: More than a dozen studies have documented that students, on average, made sluggish progress in reading during the pandemic. Estimates of just how sluggish vary. Consulting firm McKinsey & Company calculated that U.S. students had lost the equivalent of almost half a school year of […]
Friday Afternoon Veto: Governor Evers Rejects AB446/SB454; an effort to address our long term, disastrous reading results
Governor Evers: TO THE HONORABLE MEMBERS OF THE SENATE:I am vetoing Senate Bill 454 in its entirety. The bill would mandate school boards and independent charter schools to assess the early literacy skill of pupils in four-year-old kindergarten to second grade using repeated screening assessments throughout the year and to create a personal reading plan […]
Reading and Economic Expansion: German Edition & Copyright Law
Frank Thadeusz Höffner has researched that early heyday of printed material in Germany and reached a surprising conclusion — unlike neighboring England and France, Germany experienced an unparalleled explosion of knowledge in the 19th century. German authors during this period wrote ceaselessly. Around 14,000 new publications appeared in a single year in 1843. Measured against […]
Get Woke Or Get Laid Off: Madison’s taxpayer supported schools
Bill Osmulski: The Madison Metropolitan School District (MMSD) is planning to make sweeping changes to how it handles teacher layoffs, and wokeness could become the biggest factor in who stays and who goes. All teachers would be scored in five weighted categories, according to the school board’s current draft proposal. Most of the weight would […]
It’s Time To Take Time Out Of Learning And Reinvent Higher Education
Paul LeBlanc: Higher education is built around the credit hour as a measure of learning time. We build courses and programs on the number of credit hours required, assign faculty workloads on credit hours, allocate classroom space on a time basis tied to the credit hour, and disperse over $150 billion of federal financial aid […]
Candidate Q&A: Milton School Board
Emily Hamer: What is the best way to improve student literacy? Crull-Hanke: Early childhood includes getting the parents involved in reading and giving them strategies to use with their children. Having a balanced literacy program which includes oral, guided, and independent reading, writing, and repetitive use of phonics and site words. Middle school age would […]
Departing Madison Superintendent Jennifer Cheatham WORT FM Interview
mp3 audio – Machine Transcript follows [Better transcript, via a kind reader PDF]: I’m Carousel Baird and we have a fabulous and exciting show lined up today. Such a fabulous guy sitting right across from me right here in the studio. Is Madison metropolitan school district current superintendent? She still here in charge of all […]
Madison’s Taxpayer Supported K-12 School Superintendent Cheatham’s 2019 Rotary Talk
2013: What will be different, this time? Incoming Superintendent Jennifer Cheatham’s Madison Rotary Talk. December, 2018: “The data clearly indicate that being able to read is not a requirement for graduation at (Madison) East, especially if you are black or Hispanic” 2005: When all third graders read at grade level or beyond by the end […]
20 years ago…. Mutually Destructive Tendencies in K-12 and College Education
Chester E. Finn, Jr. President, Fordham Foundation Academic Questions, Spring 1998e: What’s going on in the college curriculum cannot be laid entirely at the doorstep of the K-12 system. Indeed, as Allan Bloom figured out a decade or more ago, it has as much to do with our educational culture, indeed with our culture per […]
“But more importantly, their parents do not rely on school programming to prepare their children for TJ admissions or any other milestone on their way to top STEM careers.”
Hilde Kahn, via Will Fitzhugh: One of few bright spots in the just-released National Assessment of Education Progress (NAEP) results was an increase in the number of students reaching “advanced” level in both math and reading at the 4th- and 8th-grades. But the results masked large racial and economic disparities. While 30 percent of Asian […]
Déjà vu: Madison elementary school students explore the district’s new math curriculum
Amber Walker: MMSD highlighted the success of the new math curriculum in its annual report, released last July. The report said the first cohort of schools using Bridges saw an eight-point increase in math proficiency scores and nine-point gains in math growth in one school year on the spring Measures of Academic Progress (MAP) exam […]
“It always feels like we are starting over instead of building”
Amber Walker: “It always feels like we are starting over instead of building. Where do you feel we are at in terms of preparing our kids now who are in K-5?” he said. “It seems as though the pool (for advanced learners) will shrink if we haven’t prepared them early on.” Cheatham pointed to the […]
Van Hise’s “Special Sauce”
Laurie Frost and Jeff Henriques, via a kind email: Dear Superintendent Cheatham and Members of the Madison School Board: We are writing as an update to our Public Appearance at the December 12 Board meeting. You may recall that at that meeting, we expressed serious concerns about how the District analyzes and shares student data. […]
Curriculum Is the Cure: The next phase of education reform must include restoring knowledge to the classroom.
“The existing K-12 school system (including most charters and private schools) has been transformed into a knowledge-free zone…Surveys conducted by NAEP and other testing agencies reveal an astonishing lack of historical and civic knowledge…Fifty-two percent chose Germany, Japan, or Italy as “U.S. Allies” in World War II.” Sol Stern, via Will Fitzhugh: President-elect Donald Trump’s […]
The Dangerous Rise of ‘The New Civics’
Peter Wood: National Findings: Traditional civic literacy is in deep decay in America. The New Civics, a movement devoted to progressive activism, has taken over civics education. “Service-learning” and “civic engagement” are the most common labels this movement uses, but it also calls itself global civics, deliberative democracy, and intercultural learning. The New Civics movement […]
Madison School District MAP Scores Report 2015-2016
Madison School District Administration (PDF): 1. The percent of students that tested advanced or proficient on the math portion increased 1% (45% to 46%) and increased 2% on the reading portion (40% to 42%) of the spring MAP test. 2. Proficiency gaps exist between demographic groups on MAP reading and math scores. These gaps are […]
“Why Johnny can’t write”
Heather Mac Donald: American employers regard the nation’s educational system as an irrelevance, according to a Census Bureau survey released in February of this year. Businesses ignore a prospective employee’s educational credentials in favor of his work history and attitude. Although the census researchers did not venture any hypothesis for this strange behavior, anyone familiar […]
Comments On The Madison School District’s Third “Annual Report”
Doug Erickson: The annual report is a selective rather than exhaustive view of the district, with only some grades and some demographic groups highlighted in detail. The report cited proficiency rates in reading at grade 3 and reading and math in grades 5 and 8, as measured by the Measures of Academic Progress exam, which […]
Madison Schools’ MAP Test Data Sharing Agreement
Madison School District PDF: Data Sources a) MMSD will sign NWEA’s release form allowing NWEA to transfer MMSD’s test data to Consultant. b) In signing this contract, MMSD authorizes DPI to disclose student-level information to the Consultant for the purpose of linking demographic, enrollment, and other necessary data elements to student test scores during the […]
U.S. high school seniors slip in math and show no improvement in reading
Emma Brown The nation’s high school seniors have shown no improvement in reading achievement and their math performance has slipped since 2013, according to the results of a test administered by the federal government last year. The results of the National Assessment of Educational Progress, or NAEP, also show a longer-term stagnation in 12th-grade performance […]
Responding to Ed Hughes
Dave Baskerville (7 April 2016) Mr. Ed Hughes, Member, MMSD Board 4/7/16 Ed, I finally got around to reading your “Eight Lessons Learned” article in the 3/9/16 edition of CT. Interesting/thanks. As you know from our previous discussions, we have similar thinking on some of the MMSD challenges, not on others. For the sake of […]
Moving achievement goalposts? Brown says it’s time to abandon API to judge schools’ performance
John Fensterwald: Members of the State Board of Education who favor replacing the three-digit Academic Performance Index with a “dashboard” of measurements highlighting school performance can count on the backing of Gov. Jerry Brown. The K-12 summary (pages 22-23) of Brown’s proposed 2016-17 state budget, released last week, stated, “The state system should include a […]
Reviewing and Renewing Madison’s Wright Middle School and Badger Rock Middle School “Charters”
Superintendent Jennifer Cheatham (PDF): Issue: The charter contracts for Badger Rock Middle School (BRMS) and James C. Wright Middle School (Wright) expire on June 30, 2016. Per respective contracts, the Board is required to make a decision whether or not to renew Wright’s contract at least six months before the contract’s expiration and BRMS’ contract […]
We mean business on K-12 education
John Engler & Thomas Donahue: The government can also exercise accountability without the federal mandates of NCLB that were disliked by many school systems—and those mandates must go. But it remains in the national interest for progress to be measured for all students. The results should be released, and parents and taxpayers should be told […]
deja vu: Madison, 2015
2005: When all third graders read at grade level or beyond by the end of the year, the achievement gap will be closed…and not before On November 7, Superintendent Art Rainwater made his annual report to the Board of Education on progress toward meeting the district’s student achievement goal in reading. As he did last […]
Closing the math gap for boys
David Kirp: ON a recent afternoon, the banter of boisterous adolescents at Edwin G. Foreman High School, in a poor, racially and ethnically mixed Chicago neighborhood, echoed off the corridor walls. But Room 214 was as silent as a meditation retreat. Inside, 16 ninth- and 10th-grade African-American and Latino boys were working, two-on-one, with a […]
Wisconsin Education Political Commentary
Alan Borsuk: everal years ago, I was writing about how the most significant debates in approaches to improving education didn’t pit Republicans against Democrats. They pitted Democrats against Democrats. Now, the dynamic to watch is between Republicans and Republicans. Both in Washington and Madison, they have so much power now — and they have some […]
Madison’s Lengthy K-12 Challenges Become Election Grist; Spends 22% more per student than Milwaukee
Madison 2005 (reflecting 1998): When all third graders read at grade level or beyond by the end of the year, the achievement gap will be closed…and not before On November 7, Superintendent Art Rainwater made his annual report to the Board of Education on progress toward meeting the district’s student achievement goal in reading. As […]
Teacher Evaluations in an Era of Rapid Change: From “Unsatisfactory” to “Needs Improvement”
Chad Aldeman & Carolyn Chuong: Over the last four years, states implemented remarkable changes to their teacher evaluation systems. Rather than rating all educators as either “satisfactory” or “unsatisfactory,” school districts use new multi-tiered evaluation systems to identify their best (and weakest) teachers. States now require districts to incorporate measurements of student academic growth and […]
Generation Later, Poor Are Still Rare at Elite Colleges
Richard Perez-Pena: As the shaded quadrangles of the nation’s elite campuses stir to life for the start of the academic year, they remain bastions of privilege. Amid promises to admit more poor students, top colleges educate roughly the same percentage of them as they did a generation ago. This is despite the fact that there […]
The Common Core Commotion
“Decisions about what content is to be taught,’ they insist, ‘are made at the state and local levels.’ At the same time, we read that Common Core’s “educational standards are the learning goals for what students should know.” Is what students should know different from content?” [That is the question. WHF] Andrew Ferguson: The logic […]
What’s Holding Back American Teenagers? Our high schools are a disaster
High school, where kids socialize, show off their clothes, use their phones–and, oh yeah, go to class.
Every once in a while, education policy squeezes its way onto President Obama’s public agenda, as it did in during last month’s State of the Union address. Lately, two issues have grabbed his (and just about everyone else’s) attention: early-childhood education and access to college. But while these scholastic bookends are important, there is an awful lot of room for improvement between them. American high schools, in particular, are a disaster.
In international assessments, our elementary school students generally score toward the top of the distribution, and our middle school students usually place somewhat above the average. But our high school students score well below the international average, and they fare especially badly in math and science compared with our country’s chief economic rivals.
What’s holding back our teenagers?
One clue comes from a little-known 2003 study based on OECD data that compares the world’s 15-year-olds on two measures of student engagement: participation and “belongingness.” The measure of participation was based on how often students attended school, arrived on time, and showed up for class. The measure of belongingness was based on how much students felt they fit in to the student body, were liked by their schoolmates, and felt that they had friends in school. We might think of the first measure as an index of academic engagement and the second as a measure of social engagement.
On the measure of academic engagement, the U.S. scored only at the international average, and far lower than our chief economic rivals: China, Korea, Japan, and Germany. In these countries, students show up for school and attend their classes more reliably than almost anywhere else in the world. But on the measure of social engagement, the United States topped China, Korea, and Japan.
In America, high school is for socializing. It’s a convenient gathering place, where the really important activities are interrupted by all those annoying classes. For all but the very best American students–the ones in AP classes bound for the nation’s most selective colleges and universities–high school is tedious and unchallenging. Studies that have tracked American adolescents’ moods over the course of the day find that levels of boredom are highest during their time in school.
It’s not just No Child Left Behind or Race to the Top that has failed our adolescents–it’s every single thing we have tried.
One might be tempted to write these findings off as mere confirmation of the well-known fact that adolescents find everything boring. In fact, a huge proportion of the world’s high school students say that school is boring. But American high schools are even more boring than schools in nearly every other country, according to OECD surveys. And surveys of exchange students who have studied in America, as well as surveys of American adolescents who have studied abroad, confirm this. More than half of American high school students who have studied in another country agree that our schools are easier. Objectively, they are probably correct: American high school students spend far less time on schoolwork than their counterparts in the rest of the world.
Trends in achievement within the U.S. reveal just how bad our high schools are relative to our schools for younger students. The National Assessment of Educational Progress, administered by the U.S. Department of Education, routinely tests three age groups: 9-year-olds, 13-year-olds, and 17-year-olds. Over the past 40 years, reading scores rose by 6 percent among 9-year-olds and 3 percent among 13-year-olds. Math scores rose by 11 percent among 9-year-olds and 7 percent among 13-year-olds.
By contrast, high school students haven’t made any progress at all. Reading and math scores have remained flat among 17-year-olds, as have their scores on subject area tests in science, writing, geography, and history. And by absolute, rather than relative, standards, American high school students’ achievement is scandalous.
In other words, over the past 40 years, despite endless debates about curricula, testing, teacher training, teachers’ salaries, and performance standards, and despite billions of dollars invested in school reform, there has been no improvement–none–in the academic proficiency of American high school students.
It’s not just No Child Left Behind or Race to the Top that has failed our adolescents–it’s every single thing we have tried. The list of unsuccessful experiments is long and dispiriting. Charter high schools don’t perform any better than standard public high schools, at least with respect to student achievement. Students whose teachers “teach for America” don’t achieve any more than those whose teachers came out of conventional teacher certification programs. Once one accounts for differences in the family backgrounds of students who attend public and private high schools, there is no advantage to going to private school, either. Vouchers make no difference in student outcomes. No wonder school administrators and teachers from Atlanta to Chicago to my hometown of Philadelphia have been caught fudging data on student performance. It’s the only education strategy that consistently gets results.
The especially poor showing of high schools in America is perplexing. It has nothing to do with high schools having a more ethnically diverse population than elementary schools. In fact, elementary schools are more ethnically diverse than high schools, according to data from the National Center for Education Statistics. Nor do high schools have more poor students. Elementary schools in America are more than twice as likely to be classified as “high-poverty” than secondary schools. Salaries are about the same for secondary and elementary school teachers. They have comparable years of education and similar years of experience. Student-teacher ratios are the same in our elementary and high schools. So are the amounts of time that students spend in the classroom. We don’t shortchange high schools financially either; American school districts actually spend a little more per capita on high school students than elementary school students.
Our high school classrooms are not understaffed, underfunded, or underutilized, by international standards. According to a 2013 OECD report, only Luxembourg, Norway, and Switzerland spend more per student. Contrary to widespread belief, American high school teachers’ salaries are comparable to those in most European and Asian countries, as are American class sizes and student-teacher ratios. And American high school students actually spend as many or more hours in the classroom each year than their counterparts in other developed countries.
This underachievement is costly: One-fifth of four-year college entrants and one-half of those entering community college need remedial education, at a cost of $3 billion each year.
The president’s call for expanding access to higher education by making college more affordable, while laudable on the face of it, is not going to solve our problem. The president and his education advisers have misdiagnosed things. The U.S. has one of the highest rates of college entry in the industrialized world. Yet it is tied for last in the rate of college completion. More than one-third of U.S. students who enter a full-time, two-year college program drop out just after one year, as do about one fifth of students who enter a four-year college. In other words, getting our adolescents to go to college isn’t the issue. It’s getting them to graduate.
If this is what we hope to accomplish, we need to rethink high school in America. It is true that providing high-quality preschool to all children is an important component of comprehensive education reform. But we can’t just do this, cross our fingers, and hope for the best. Early intervention is an investment, not an inoculation.
In recent years experts in early-child development have called for programs designed to strengthen children’s “non-cognitive” skills, pointing to research that demonstrates that later scholastic success hinges not only on conventional academic abilities but on capacities like self-control. Research on the determinants of success in adolescence and beyond has come to a similar conclusion: If we want our teenagers to thrive, we need to help them develop the non-cognitive traits it takes to complete a college degree–traits like determination, self-control, and grit. This means classes that really challenge students to work hard–something that fewer than one in six high school students report experiencing, according to Diploma to Nowhere, a 2008 report published by Strong American Schools. Unfortunately, our high schools demand so little of students that these essential capacities aren’t nurtured. As a consequence, many high school graduates, even those who have acquired the necessary academic skills to pursue college coursework, lack the wherewithal to persevere in college. Making college more affordable will not fix this problem, though we should do that too.
The good news is that advances in neuroscience are revealing adolescence to be a second period of heightened brain plasticity, not unlike the first few years of life. Even better, brain regions that are important for the development of essential non-cognitive skills are among the most malleable. And one of the most important contributors to their maturation is pushing individuals beyond their intellectual comfort zones.
It’s time for us to stop squandering this opportunity. Our kids will never rise to the challenge if the challenge doesn’t come.Laurence Steinberg is a psychology professor at Temple University and author of the forthcoming Age of Opportunity: Revelations from the New Science of Adolescence.
———————————-
“Teach with Examples”
Will Fitzhugh [founder]
The Concord Review [1987]
Ralph Waldo Emerson Prizes [1995]
National Writing Board [1998]
TCR Institute [2002]
730 Boston Post Road, Suite 24
Sudbury, Massachusetts 01776-3371 USA
978-443-0022; 800-331-5007
www.tcr.org; fitzhugh@tcr.org
Varsity Academics®
tcr.org/bookstore
www.tcr.org/blog
N.J. School Boards Association to study ways to close economic achievement gap
The New Jersey School Boards Association has created a task force on student achievement to help local boards identify strategies to improve student performance and close the economic achievement gap.
Members of 11 school boards from urban, rural and suburban districts are joined by education and community leaders to review relevant research and address issues ranging from curriculum to access to technology. The task force will present best practices and make recommendations that local boards can use to improve student performance.
“Overall New Jersey’s students performing well on nationwide measures of academic progress, but when one digs deeper, a troubling statistic becomes apparent: a persistent economic achievement gap,” the association’s executive director Lawrence Feinsod said. “Poverty is no friend to academic achievement. Neither should it be an excuse for allowing children not to succeed.”
Has UC Berkeley mortgaged itself to football?
Release of the numbers last month, amplified by an attention-getting analysis authored by retired UC Berkeley Vice Chancellor John Cummins and graduate student Kirsten Hextrum, has sent shock waves around the campus. The department of athletics and its friends are playing full-court damage control.
Sandy Barbour, Berkeley’s director of athletics, acknowledged the problem and promises to turn things around. Early indicators of academic progress in the past year are encouraging, she says, “But, we need to do better.”
A year ago she fired football coach Jeff Tedford, in part, say her friends, because he failed to do enough to help his players succeed academically. In the sports world, the explanation was simpler: Tedford’s three losing seasons. Barbour told me it was some of both: “downward trends” both on the field and in the classroom.
But in the eyes of some Berkeley professors and administrators – and for many beyond the campus – the attention given the new numbers about athletes’ graduation rates seems to raise the specter of older and more fundamental issues.John Cummins and Kirsten Hextrum (PDF):
This white paper is based on a larger project being conducted with the Regional Oral History Office at the Bancroft Library. The purpose of the research is to explore the history of the management of Intercollegiate Athletics at UC Berkeley from the 1960s to the present. The project began in 2009 and will include, when completed, approximately 70 oral history interviews of individuals who played key roles in the management of intercollegiate athletics over that period of time – Chancellors, Athletic Directors, senior administrators, Faculty Athletic Representatives, other key faculty members, directors of the Recreational Sports Program, alumni/donors, administrators in the Athletic Study Center and others. The interviews are conducted by John Cummins, Associate Chancellor – Chief of Staff, Emeritus who worked under Chancellors Heyman, Tien, Berdahl and Birgeneau from 1984 – 2008. Intercollegiate Athletics reported to him from 2004 – 2006. A publication of the results is underway and will be co- authored by Cummins and Kirsten Hextrum, a PhD student in the Graduate School of Education, a member and two-time national champion of Cal Women’s Crew from 2003 – 2007, and a tutor/adviser in the Athletic Study Center since 2009. This paper addresses administrative and management issues that typically concern those responsible for the conduct of a Division I-A intercollegiate athletics program. It assumes that such a program will continue for many years to come and that it provides important benefits for the Cal community. Its focus is principally with the market driven, multi-billion dollar phenomenon of the big-time sports of Men’s football and basketball, their development over time and their intersection with the academic world. The Olympic or non-revenue sports at UC Berkeley more closely resemble the amateur intercollegiate ideal with high graduation rates and successful programs. Even these sports programs, however, are gradually being pulled into the more highly commercialized model.
In the spring of 1999, a Professor in Ethnic Studies provided passing grades to two football players who did little or no work for his course. The NCAA cited Cal for academic fraud and a lack of institutional control, and placed the department on probation for five years. These kinds of incidents exact an emotional toll on the AD and the senior administration. They are a major embarrassment for the campus and remain so. In the NCAA’s own accounting of schools by major violations in its history, Cal, along with a few other schools including UCLA, with 7, ranks just behind Oklahoma (8) and Arizona State and Southern Methodist University (9). Stanford has none. Future work by these authors will investigate the nature of these violations, the culture that led to them and suggest efforts to mitigate further infractions. This paper primarily addresses the academic issues.
…..
Kasser did complete the Haas Pavilion during his watch despite the conflicts and difficulties associated with it, unquestionably a major accomplishment. He made great strides in addressing the inequities between the Men’s and Women’s programs. He upgraded the coaching in some of the Olympic Sports and his appointment of Ben Braun as the Men’s Basketball coach, who brought an inclusive, team oriented approach to management boosted the morale of the department. Kasser valued the Rec Sports program as part of the merged department and was an excellent public ambassador for Cal.
…..
The graduation rate for UC Berkeley’s revenue generating teams are the lowest in the department. Men’s basketball went four years with none of their scholarship student athletes graduating. This brought down their average to a 58% graduation rate over this eight year period. Football also has sub-par graduation rates. Over the past eight years, football graduation rates have ranged from a high of 72% to a low of 31%. Football has the lowest average team graduation rate with only 50% of their scholarship athletes graduating. The numbers are even more grim when broken down by race. In particular, the black scholarship football players, many of whom are special admits, have gone from a high of 80% to a low of 18%. The NCAA also tracks graduation rates by compiling four-year averages to even-out any anomalies. In this data set, the black graduation rates range from a high of 63% to a low of 30%. Three of the seven four-year averages mark the black graduation rate in the 30s.
…..
With a new Chancellor, a new football coach, a new stadium and high performance center, a larger and more monied conference, the present surely marks a transitional period for intercollegiate athletics at UC Berkeley. These changes all signal Cal’s continued escalation as a Big-Time sports program, and the difficult dilemmas campus administrators face. To fund an intercollegiate program of this magnitude they cannot alienate a substantial donor base. The recent blowback after the elimination, and subsequent reinstatement of five varsity sports, makes the possibility of cutting sports again as a cost saving measure extremely remote for years to come. Further, the athletic deficit places enormous pressures to win. This increases the temptation to gain an extra edge on the competition whether through newer facilities, higher-paid coaches, or longer practices. All this must be achieved on the backs of student athletes who are enrolled in a full-time course load at one of the most prestigious academic universities in the world. Rather than resolving the dilemma of how to maintain a nearly $70 million per year athletic enterprise while still providing a world-class education for the participants, campus administrators continue to muddle through.
Generation Monoglot
AS THE new term starts across England, schools are chewing over this summer’s results in the 16-plus exams. One trend is clear–the coalition’s emphasis on pupils achieving five core academic subjects, including a language, in its new EBACC (English Baccalaureate) qualification has raised the number of candidates taking language exams.
This marks a reversal of a long period in which English schools turned out a rising number of monoglots (see chart). The past two decades have witnessed a sharp decline in the numbers of teenagers poring over French verbs, let alone the oddities of German, which as Mark Twain, a 19th-century American writer, observed, renders a girl neuter but a turnip feminine.
In 1993 over 315,000 pupils sat the 16-plus exam in French, compared with just over 177,000 this year. German had 108,000 entrants in 1993; there are fewer than 63,000 now. Only Spanish fared better, with 91,000 GCSE entrants this year, rising from 32,000 in 1993. Largely to blame for the slump was a decision by the Labour government in 2002 to end the compulsory status of a language in secondary schools. That accelerated a longer period of modern-languages decline, as pupils switched to subjects perceived to be easier or more practical. Now the coalition is claiming that the rise in this year’s exam entries at 16 marks the first step to correcting the resulting monolingualism. Yet progress has been modest–the number of GCSE French entrants, for example, merely returned to 2010 levels, around half the numbers of the 1990s.
National Civics, History Tests to Disappear
The National Assessment of Educational Progress exams in civics, U.S. history, and geography have been indefinitely postponed for fourth and twelfth graders. The Obama administration says this is due to a $6.8 million sequestration budget cut. The three exams will be replaced by a single, new test: Technology and Engineering Literacy.
“Without these tests, advocates for a richer civic education will not have any kind of test to use as leverage to get more civic education in the classrooms,” said John Hale, associate director at the Center for Civic Education.
NAEP is a set of national tests of fourth, eighth, and twelfth graders that track achievement on various subjects over time. Researchers collect data for state to state comparisons in mathematics, reading, science, and writing. The other subjects only provide national statistics and are administered to fewer students. The tests provide basic information about students but do not automatically trigger consequences for teachers, students, and schools.
Students have historically performed extremely poorly on these three tests. In 2010, the last administration of the history test, students performed worse on it than on any other NAEP test. That year, less than half of eighth-graders knew the purpose of the Bill of Rights, and only 1 in 10 could pick a definition of the system of checks and balance on the civics exam.
Science vs. Humanities
Since most civic education is taught to first-semester high school seniors, Hale said, not testing in twelfth grade creates a major gap of information.
“Is it possible to have a responsible citizenry if we don’t teach them civics, history, and the humanities?” said Gary Nash, a professor of history education (sic) at the University of California Los Angeles. Postponing the exams, typically administered every four years, does not mean classroom education in the humanities will be cut. But the cuts indirectly say we can do without civics and U.S. history, Nash said.
Trading the humanities tests for technology tests is necessary to measure “the competitiveness of U.S. students in a science, technology, engineering and mathematics (STEM)-focused world,” said David Driscoll, chair of the NAEP Governing Board, in a statement. “The [Technology and Engineering Literacy] assessment, along with the existing NAEP science and mathematics assessments, will help the nation know if we are making progress in the areas of STEM education.”
Nash agrees the U.S. needs more engineers and scientists: “But what are they without humanities under their belt?” he said.
Excellence in one area flows into others
A summer report from the Commission on the Humanities and Social Sciences explained the need for these subjects this way: “The humanities and social sciences provide an intellectual framework and context for understanding and thriving in a changing world. When we study these subjects, we learn not only what but how and why.”
Nash pointed out that Franklin High School in the Los Angeles Unified School district is 94 percent Latino, and many families are immigrants. Without changing anything in science and math, the school began to emphasize humanities. The scores in science and math improved, testing almost on par with students in Beverly Hills. “It’s about increasing their passion for learning,” he says. Furthermore, giving students a context for learning helps them learn more.
Masters of Our Government
Students must be prepared “to think for themselves as independent citizens,” said Hale. “Civics and Government (& History) is (are) as generative as math; we are not born as great democratic citizens. We aren’t born knowing why everyone should have the right to political speech, even if it is intolerant speech.”
Consider the current events of the last few weeks, he said: the Supreme Court rulings on marriage and the Voting Rights Act, the National Security Administration’s data collection, and Congress debating immigration and student loan rates.
“Our leaders make decisions every day based on interpretations on the proper role of government; we have no way of knowing if these [decisions] are good or bad,” Hale continued. “We are supposed to be masters of our government, not servants of it.”
Cutting the civics tests indicates the government’s priorities, and priorities affect curriculum, Nash noted. He suggested danger for a country that must govern itself if children do not learn how.—————————–
“Teach by Example”
Will Fitzhugh [founder]
The Concord Review [1987]
Ralph Waldo Emerson Prizes [1995]
National Writing Board [1998]
TCR Institute [2002]
730 Boston Post Road, Suite 24
Sudbury, Massachusetts 01776-3371 USA
978-443-0022; 800-331-5007
www.tcr.org; fitzhugh@tcr.org
Varsity Academics®
www.tcr.org/blog
Madison Superintendent’s “Entry Process Report”
Madison Superintendent Jennifer Cheatham (PDF):Strengths
Overall Themes
Quality of teachers, principals, and central office staff: By and large, we have quality teachers, principals, support staff and central office staff who are committed to working hard on behalf of the children of Madison. With clarity of focus, support, and accountability, these dedicated educators will be able to serve our students incredibly well.
Commitment to action: Across the community and within schools, there is not only support for public education, but there is also an honest recognition of our challenges and an urgency to address them. While alarming gaps in student achievement exist, our community has communicated a willingness to change and a commitment to action.
Positive behavior: District-wide efforts to implement an approach to positive student behavior are clearly paying off. Student behavior is very good across the vast majority of schools and classrooms. Most students are safe and supported, which sets the stage for raising the bar for all students academically.
Promising practices: The district has some promising programs in place to challenge students academically, like our AVID/TOPS program at the middle and high school levels, the one-to-one iPad programs in several of our elementary schools, and our Dual Language Immersion programs. The district also does an incredibly successful job of inclusion and support of students with special needs. Generally, I’ve observed some of the most joyful and challenging learning environments I’ve ever seen.
Well-rounded education: Finally, the district offers a high level of access to the arts, sports, world language and other enriching activities that provide students with a well- rounded learning experience. This is a strength on which we can build.
“AVID is totally paying off. Kids, staff, everyone is excited about what it has brought to the school.” – Staff member
“Positive Behavior Support has made a dramatic improvement in teaching and the behavior expected. We’ve seen big changes in kids knowing what is expected and in us having consistent, schoolwide expectations”
– Staff member
Challenges
Focus: Principals, teachers and students have been experiencing an ever-changing and expanding set of priorities that make it difficult for them to focus on the day-to-day work of knowing every child well and planning instruction accordingly. If we are going to be successful, we need to be focused on a clear set of priorities aimed at measurable goals, and we need to sustain this focus over time.
“One of the strengths of MMSD is that we will try anything. The problem is that we opt out just as easily as we opt in. We don’t wait to see what things can really do.”
– Staff member
Coherence: In order for students to be successful, they need
to experience an education that leads them from Pre-Kindergarten through 12th grade, systematically and seamlessly preparing them for graduation and postsecondary education. We’ve struggled to provide our teachers with the right tools, resources and support to ensure that coherence for every child.
Personalized Learning: We need to work harder than ever to keep students engaged through a relevant and personalized education at the middle and high school levels. We’ve struggled to ensure that all students have an educational experience that gives them a glimpse of the bright futures. Personalized learning also requires increased access to and integrated use of technology.
Priority Areas
To capture as many voices as accurately as possible, my entry plan included a uniquely comprehensive analysis process. Notes from more than 100 meetings, along with other handouts, emails, and resources, were analyzed and coded for themes by Research & Program Evaluation staff. This data has been used to provide weekly updates to district leadership, content for this report and information to fuel the internal planning process that follows these visits.
The listening and learning phase has led us to five major areas to focus our work going forward. Over the next month, we’ll dive deeper into each of these areas to define the work, the action we need to take and how we’ll measure our progress. The following pages outline our priorities, what we learned to guide us to these priorities and where we’ll focus our planning in the coming month.Matthew DeFour collects a few comments, here.
Much more on Madison’s new Superintendent Jennifer Cheatham, here.

Madison school with steepest growth in poverty
How does an elementary school adjust to a steep and rapid rise in the number of poor children coming through its doors?
With programs to build language and technological literacy, resilient character, and ties to the community, says Brett Wilfrid, principal of Sandburg Elementary School, 4114 Donald Drive, on Madison’s far east side.
“When people come and spend time in this school, they see a lot of happy children and adults. It is a wonderful, thriving community,” Wilfrid told me in a phone interview Thursday.
I spoke with Wilfrid after a Cap Times data report published this week showed that Sandburg Elementary had the greatest increase in the Madison School District — 34.3 percentage points — in the number of children from low-income families in the past decade.
The percentage of low-income children, based on eligibility for free or reduced price lunch, rose from 37.9 percent of Sandburg enrollment in the 2003-2004 school year to 72.2 percent this year.
(One district evening program to help students who have left school to get their high school diplomas saw a slightly higher rate of increase, 35.4 percent, in the percentage of low-income students enrolled.)Related: Madison Schools’ Measures of Academic Progress (MAP) Assessment Results Released.
Madison’s “Building Our Future” Final Report & Activity Summary. Reading Appears to be Job 1….
Superintendent Jane Belmore 2.5MB PDF
When the Building Our Future plan was approved in June 2012, BOE members approved two motions to assure that specific accountability plans and progress indicators would be provided for each program receiving funding. Research & Program Evaluation staff have worked since then to create a comprehensive report to monitor progress on district priorities and strategies related to the plan. It is noted that while this plan officially indicated 17 specific strategies to address closing achievement gaps, every instructional decision in the district and at the school level is made with the intention of all students learning to potential and all learning gaps closed.
The overarching priorities section of the report has been developed this year to provide the direction for and measure of all of the energies that are going into all students reaching high levels of academic performance. This section of the report can stand alone as direction for and measures of overall district improvement efforts.Summary of “Building Our Future” activites (2.3MB PDF)
A. Synthesis of Topic: The Building Our Future Plan is a comprehensive set of strategies designed to eliminate achievement gaps while at the same time increase the achievement of all students. Attached to this report are Summary of Activities for the strategies approved by the Board of Education in each of the identified foundational areas: Instructional support, College and Career Readiness, Culturally Relevant Practices, Safe and Positive School Environments, Family Engagement, and Diverse and Qualified Workforce. Each of the summaries provides activities implemented, challenges, and future recommendations. All strategies now have outcome measures identified.
B. Recommendations: We are recommending, for budget purposes, all year two activities be moved to year three and that next year will be a combination of completion of year one activities and some recommended year two activities. These specific recommendations will come through the 2013/14 budget process. As with any implementation phase, some of the strategies needed to be modified and adapted. We continue to see this plan as the frame work by which the district will close the achievement gap.Related: Madison’s disastrous reading results.
Madison Mayor Soglin Commentary on our Local School Climate; Reading unmentioned
The city, he says, needs to help by providing kids with access to out-of-school programs in the evenings and during the summer. It needs to do more to fight hunger and address violence-induced trauma in children. And it needs to help parents get engaged in their kids’ education.
“We as a community, for all of the bragging about being so progressive, are way behind the rest of the nation in these areas,” he says.
The mayor’s stated plans for addressing those issues, however, are in their infancy.
Soglin says he is researching ways to get low-cost Internet access to the many households throughout the city that currently lack computers or broadband connections.
A serious effort to provide low-cost or even free Internet access to city residents is hampered by a 2003 state law that sought to discourage cities from setting up their own broadband networks. The bill, which was pushed by the telecommunications industry, forbids municipalities from funding a broadband system with taxpayer dollars; only subscriber fees can be used.
Ald. Scott Resnick, who runs a software company and plans to be involved in Soglin’s efforts, says the city will likely look to broker a deal with existing Internet providers, such as Charter or AT&T, and perhaps seek funding from private donors.Related: “We are not interested in the development of new charter schools” – Madison Mayor Paul Soglin.
Job one locally is to make sure all students can read.
Madison, 2004 Madison schools distort reading data by UW-Madison Professor Mark Seidenberg:Rainwater’s explanation also emphasized the fact that 80 percent of Madison children score at or above grade level. But the funds were targeted for students who do not score at these levels. Current practices are clearly not working for these children, and the Reading First funds would have supported activities designed to help them.
Madison’s reading curriculum undoubtedly works well in many settings. For whatever reasons, many chil dren at the five targeted schools had fallen seriously behind. It is not an indictment of the district to acknowledge that these children might have benefited from additional resources and intervention strategies.
In her column, Belmore also emphasized the 80 percent of the children who are doing well, but she provided additional statistics indicating that test scores are improving at the five target schools. Thus she argued that the best thing is to stick with the current program rather than use the Reading First money.
Belmore has provided a lesson in the selective use of statistics. It’s true that third grade reading scores improved at the schools between 1998 and 2004. However, at Hawthorne, scores have been flat (not improving) since 2000; at Glendale, flat since 2001; at Midvale/ Lincoln, flat since 2002; and at Orchard Ridge they have improved since 2002 – bringing them back to slightly higher than where they were in 2001.
In short, these schools are not making steady upward progress, at least as measured by this test.Madison, 2005: When all third graders read at grade level or beyond by the end of the year, the achievement gap will be closed…and not before by Ruth Robarts:
According to Mr. Rainwater, the place to look for evidence of a closing achievement gap is the comparison of the percentage of African American third graders who score at the lowest level of performance on statewide tests and the percentage of other racial groups scoring at that level. He says that, after accounting for income differences, there is no gap associated with race at the lowest level of achievement in reading. He made the same claim last year, telling the Wisconsin State Journal on September 24, 2004, “for those kids for whom an ability to read would prevent them from being successful, we’ve reduced that percentage very substantially, and basically, for all practical purposes, closed the gap”. Last Monday, he stated that the gap between percentages scoring at the lowest level “is the original gap” that the board set out to close.
Unfortunately, that is not the achievement gap that the board aimed to close.
In 1998, the Madison School Board adopted an important academic goal: “that all students complete the 3rd grade able to read at or beyond grade level”. We adopted this goal in response to recommendations from a citizen study group that believed that minority students who are not competent as readers by the end of the third grade fall behind in all academic areas after third grade.
“All students” meant all students. We promised to stop thinking in terms of average student achievement in reading. Instead, we would separately analyze the reading ability of students by subgroups. The subgroups included white, African American, Hispanic, Southeast Asian, and other Asian students.
“Able to read at or beyond grade level” meant scoring at the “proficient” or “advanced” level on the Wisconsin Reading Comprehension Test (WRC) administered during the third grade. “Proficient” scores were equated with being able to read at grade level. “Advanced” scores were equated with being able to read beyond grade level. The other possible scores on this statewide test (basic and minimal) were equated with reading below grade level.Madison, 2009: 60% to 42%: Madison School District’s Reading Recovery Effectiveness Lags “National Average”: Administration seeks to continue its use.
Madison, 2012: Madison’s “Achievement Gap Plan”:The other useful stat buried in the materials is on the second page 3 (= 6th page), showing that the 3rd grade proficiency rate for black students on WKCE, converted to NAEP-scale proficiency, is 6.8%, with the accountability plan targeting this percentage to increase to 23% over one school year. Not sure how this happens when the proficiency rate (by any measure) has been decreasing year over year for quite some time. Because the new DPI school report cards don’t present data on an aggregated basis district-wide nor disaggregated by income and ethnicity by grade level, the stats in the MMSD report are very useful, if one reads the fine print.
Seattle’s Low Stakes Testing Trap
Those with a mind for controversy or whimsy may recall the outrage last year over a certain talking pineapple on the New York State eighth-grade reading exam. The unfortunate pineapple passage was sliced, diced, and served up as an example of all that is wrong with standardized testing. Asking students to inhabit the shared mental landscape of some chatty anthropomorphized forest animals and tropical fruit, as the questions did, was deemed both ridiculous and unfair. The author of the excerpted passage criticized the exam’s adaptation of his story as “barely literate.” And the state quickly announced that it would not count on the test’s scoring.
And so the talking pineapple joined the long tradition of conflict and contention over educational reform in America, from Thomas Jefferson’s revolutionary plan for public education in Virginia, to the Texas State Board of Education’s recent demotion of Jefferson from its ranks of revolutionary thinkers. The current obsession with testing (and pineapples) belongs to the standards movement, which began in the nineteen-eighties. Now, one of its more unusual battles is being fought in Seattle, where, in December, teachers at Garfield High School voted to boycott the Northwest Evaluation Association’s Measures of Academic Progress (MAP) exam.
The Garfield teachers are not boycotting all standardized tests. Their complaints, as outlined by Kris McBride, the school’s testing coördinator, are focussed squarely on the MAP, which, as an assessment tool, can be categorized as a low-stakes test: according to the MAP-makers at the N.W.E.A., it is an “interim assessment.”
Teachers’ test boycott draws growing support
Eleven years ago, Rachel Eells saw value in the tests that she and other teachers at Seattle’s Garfield High School are now refusing to give their students.
Back then, she was a new middle-school teacher in the Highline School District, and the Measures of Academic Progress (MAP) helped her identify the strengths and weaknesses of her students in reading.
But Eells grew disenchanted with the MAP, saying it was, at best, a rough diagnostic tool that often left her with more questions than answers, especially with her older students. She couldn’t tell why, for example, a student would do well on literary terms one time, then poorly the next.
So when a Garfield colleague asked Eells last month whether she would consider boycotting the MAP, she said yes so quickly the colleague paused, a little taken aback.
ORCA K-8 teachers join boycott of district-required (MAP) exams
Linda Shaw: Eleven teachers and instructional assistants at ORCA K-8 have decided that they, too, will boycott district-required tests known as the MAP, according to ORCA teacher Matt Carter. The Orca staffers join the staff at Garfield High, where all teachers who were scheduled to administer the Measures of Academic Progress exams are refusing, with […]
Accountability: Report card scores for most Madison schools take small hit
Matthew DeFour, via a kind reader’s email
The report card scores of nearly all Madison schools will be reduced slightly after the district discovered it had reported incorrect student attendance data to the state and revised it.
In most cases the new, lower scores — which the Department of Public Instruction plans to update on its website next week — have no impact on the rating each Madison school receives on the report card. But six schools will be downgraded to a lower category.
Randall and Van Hise elementaries, which were rated in the highest performance category, are now in the second-highest tier. Olson and Chavez elementaries are now in the middle tier. And Mendota and Glendale elementaries are in the second-lowest tier.
The corrections — prompted by a State Journal inquiry — have no immediate practical ramifications, though the implications are significant as state leaders contemplate tying school funding to the report card results.
Adam Gamoran, director of the Wisconsin Center for Education Research, said it’s “extremely important” that the data used to rate schools is accurate. The report cards are part of the state’s new school accountability system, and DPI has proposed directing resources to schools struggling in certain categories.
“The report cards are only as good as the data that goes into them,” he said.Props to DeFour and the Wisconsin State Journal for digging and pushing.
Related: Madison Mayor Paul Soglin: “We are not interested in the development of new charter schools”.
Where does the Madison School District Get its Numbers from?
Global Academic Standards: How we Outrace the Robots and www.wisconsin2.org.
An Update on Madison’s Use of the MAP (Measures of Academic Progress) Assessment, including individual school reports. Much more on Madison and the MAP Assessment, here.
I strongly support diffused governance of our public schools. One size fits all has outlived its usefulness.
In Madison, poorer schools get less-experienced teachers; A Comparison of Randall & Sandburgs MAP Results
Randall Elementary School has one of the lowest poverty rates and some of the highest test scores in Madison. It also has the most experienced teaching staff in the district.
By contrast, Sandburg Elementary has one of the higher poverty rates and some of the lowest test scores. It also has the least experienced teaching staff.
Across the district, schools with higher concentrations of poverty are more likely to have teachers with less experience, according to a State Journal analysis of Madison School District data.
Experts say that while more experience doesn’t guarantee higher quality, teachers often need five to 10 years to reach their peak effectiveness.
“To consistently and disproportionately give the kids who need the most help people who aren’t at their best yet just disadvantages them,” said Sarah Almy, director of teacher quality for the Education Trust, a Washington, D.C.,-based group that advocates for raising student achievement.I quickly compiled the following charts (PDF version) from the 2011-2012 Madison School District’s MAP (Measurement of Academic Progress) math and reading results for Randall and Sandburg Elementary along with the District-wide results.
I added Randall, Sandburg’s and the Madison school district’s 3rd Friday, 2011 enrollment to the charts via the green rectangles. For example, the report states that 30 Sandburg 3rd grader’s took the MAP assessment while the District’s enrollment counts report 44 students in that class.

Big changes in the works for Madison’s 2012-13 school year
Wisconsin students, parents, teachers and property owners will feel the impact of major changes rolling out in Wisconsin’s public schools this school year.
This fall for the first time:
- The state will assign numerical ratings to schools based on various test score measures.
- Most students will start to see a new, more specific curriculum — in math and language arts, and with literacy incorporated in all subjects — in anticipation of a new state test in two years.
- And dozens of schools, including three in Madison, will take part in the state’s new teacher evaluation system, which takes into account student test scores.
“This is huge,” State Superintendent Tony Evers said. “I’ve been doing this for 37 years and I haven’t seen this level of reform efforts.”
The unifying reason for the changes is the end of the No Child Left Behind era and the national move toward a more rigorous set of standards for what students are expected to know at each grade level, said Adam Gamoran, director of the Wisconsin Center for Education Research at UW-Madison. In order to obtain a waiver from NCLB, Wisconsin had to adopt the accountability system, higher curriculum standards and a teacher evaluation system.
“This has nothing to do with the turmoil we experienced in Wisconsin last year,” Gamoran said. “This is happening in every state in the country.”Related:
- Education wake-up call is looming
- Madison Schools’ Measures of Academic Progress (MAP) Assessment Results Released
- 60% to 42%: Madison School District’s Reading Recovery Effectiveness Lags “National Average”: Administration seeks to continue its use
- Budget Cuts: We Won’t Be as Bold and Innovative as Oconomowoc, and That’s Okay.
- wisconsin2.org
Understanding the Real Retention Crisis in America’s Urban Schools
To identify and better understand the experience of these teachers, we started by studying 90,000 teachers across four large, geographically diverse urban school districts. We also examined student academic growth data or value-added results for approximately 20,000 of those teachers. While these measures cannot provide a complete picture of a teacher’s performance or ability on their own–and shouldn’t be the only measure used in real- world teacher evaluations–they are the most practical way to identify trends in a study of this scale, and research has demonstrated that they show a relationship to other performance measures, such as classroom observations.3 We used the data to identify teachers who performed exceptionally well (by helping students make much more academic progress than expected), and to see how their experiences and opinions about their work differed from other teachers’–particularly teachers whose performance was exceptionally poor.
Madison MAP Testing Shows They are Falling Short Too
Melissa Hammann, via a kind reader’s email:
So, the great and powerful Madison School District has started MAP testing and the results are, well, as they should have expected when viewed as a whole. White kids are above national averages and children of color are below them. MAP testing stands for Measures of Academic Progress. They are taken at the computer by each student and the questions are tailored to the individual student. They keep answering questions until they hit the wall of achievement level and the test is ended. Scores are known immediately and areas of strength and areas that need improvement are highlighted FOR EACH KID. It is supposed to be a tool for teachers to use in order to more adequately provide instruction in their classroom. This is called differentiated instruction, or DI in the education vernacular. MAP results are not really effective for national achievement comparison.
OK, I’m going out on a limb here and going to say to the critics of ECSD that we have been doing MAP testing in our district for 5 years now. My newly minted graduate was in the guinea pig group in 7th grade, so I am keyed in on this topic. We can thank Paula Landers for being ahead of the curve on implementing this tool. What seems to escape the writer of the article as well as our district is this. It’s very nice to know how one’s district stacks up as a whole against the state (WKCE) and nation (MAP, NAEP), but what exactly does this data provide in the way of improving individual student achievement? Exactly squat. In this world of inclusive learning, school districts must have tools to provide DI for all levels of learners. If you insist on teaching to some arbitrary mean that various test data indicates as the level of your class, you’ll lose the top 30 and bottom 30 percent of the curve. That’s 60 percent of the students being lost. Used properly, MAP results could be a very effective tool for the teaching arsenal to solve this problem.
Sadly, it is my experience that my kids’ teachers use it to verify what they already know about my kids, that they are above average, and use their MAP data to rationalize being satisfied with mediocre performance the rest of the year “because they are still above their peer average.” I have no data to indicate it is otherwise with other children. In fact, I have spoken to other parents with similar issues. In addition, over 35 percent of the students in the quadrant report that began the school year above their peer group in reading in our district in 10-11 did not reach the achievement goal the MAP test sets for them. It seems that the district thinks it’s OK that a child does not achieve to their potential. I am not of the same opinion.
……
Not only did my kid fail to reach his personal achievement goal set for him by the MAP test (gain less than they projected he should), but he ended 5th grade at a lower achievement level in reading than where he started. This loss of achievement happened while he got straight As all year long in language arts. I began a slow burn that has not stopped. I went to the principal, I went to the teacher and I went to the administrator in charge. “He started out so high that it was hard for him to achieve.” This is an unacceptable response. My child deserves to show some damn achievement after a year of instruction. I don’t care if he started out higher than the mediocre goals you set for the masses. This is thievery, plain and simple. That year, as I recall, the entire grade level failed to meet the 50% level, which basically says they have achieved grade level performance. Interpretation of MAP results is a bit confusing, so go with me here. Anything less than 50% for a grade level indicates they have not achieved a years worth of learning. There has been a shake up in the 5th grade teaching team, but I think it goes beyond individual teachers. If there is an endemic attitude that high achieving students are OK to ignore and an insistence on mistakenly using MAP data to compare to national averages (like the article in the Madison paper did) instead of using it for the amazing tool it could be, there will be no dang improvement in overall achievement.Related: Madison Schools’ Measures of Academic Progress (MAP) Assessment Results Released. Unfortunately, the Madison School District has not published the school by school MAP results, though the information made its way to Matthew DeFour’s Sunday article.
We Should Only Hold Schools Accountable For Outcomes They Can Control
Let’s say we were trying to evaluate a teacher’s performance for this academic year, and part of that evaluation would use students’ test scores (if you object to using test scores this way, put that aside for a moment). We checked the data and reached two conclusions. First, we found that her students made fantastic progress this year. Second, we also saw that the students’ scores were still quite a bit lower than their peers’ in the district. Which measure should we use to evaluate this teacher?
Would we consider judging her even partially based on the latter – students’ average scores? Of course not. Those students made huge progress, and the only reason their absolute performance levels are relatively low is because they were low at the beginning of the year. This teacher could not control the fact that she was assigned lower-scoring students. All she can do is make sure that they improve. That’s why no teacher evaluation system places any importance on students’ absolute performance, instead focusing on growth (and, of course, non-test measures). In fact, growth models control for absolute performance (prior year’s test scores) so it doesn’t bias the results.
If we would never judge teachers based on absolute performance, why are we judging schools that way? Why does virtually every school/district rating system place some emphasis – often the primary emphasis – on absolute performance?
MacIver Large Wisconsin School District Report Card
The MacIver Institute District Report Card takes an innovative look at the Wisconsin’s fifty largest public school districts and offers a vigorous analysis and traditional letter grading system in this unique analysis. It rates districts across several different measures to create a comprehensive look at how teachers and administrators are performing in their schools. The Report Card goes beyond the typical parochial comparison of neighboring communities to also focus on how children compete on a global level. With a dynamic global economy perpetually in front of us, a broader focus was needed to better understand how our districts stack up across many metrics.
The Report Card takes into account not only how a student is testing, but also how likely a district is to push their students to achieve more. The state has recently increased graduation requirements to include more coursework and more challenging classes. This metric works to gauge the progress that has been made in those departments. Finally, the MI District Report Card factors in a student’s basic background to better understand the challenges that a school district may face and their effectiveness as a result. Educating students from low-income families, as well as other students that have traditionally been difficult to teach, is critically important to the future of Wisconsin.
These rankings go beyond what standardized testing tells us. They take a closer look inside the classroom and assign grades based on achievement, attainment, and student population. Districts that have higher percentages of low-income and limited English proficiency (LEP) students, two factors that are traditionally linked to lower scores on state testing measures, earn extra points to address this greater degree of difficulty for their teachers.Madison ranked 42nd out of 50 in academic achievement, 40th in student attainment, B- overall.
With Common Core, changes are coming to curriculum, tests
If you’ve never heard of the Common Core standards, it’s time to take note: They could have a big effect on what students will learn – and maybe also on the tests that measure their progress.
This attempt at creating uniform academic standards stringent enough to ensure that students in every state are ready for college or career has been years in the making. It is being pushed by the Obama administration, with help from organizations like the Bill & Melinda Gates Foundation. The goal is to raise the bar nationally and make American students more competitive with those abroad.
Longtime proponents point out that individual state standards are all over the place in terms of rigor and expectations. They argue that clear standards for what students at each grade level should know and be able to do, drawn up by top educators and used nationwide, can benefit everyone. And they say it doesn’t require dictating what happens in the classroom.
Researchers blast Chicago teacher evaluation reform
Scores of professors and researchers from 16 universities throughout the Chicago metropolitan area have signed an open letter to the city’s mayor, Rahm Emanuel, and Chicago school officials warning against implementing a teacher evaluation system that is based on standardized test scores.
This is the latest protest against “value-added” teacher evaluation models that purport to measure how much “value” a teacher adds to a student’s academic progress by using a complicated formula involving a standardized test score.
Researchers have repeatedly warned against using these methods, but school reformers have been doing it in state after state anyway. A petition in New York State by principals and others against a test-based evaluation system there has been gaining ground.
In long-expected move – legislators, school districts outlaw the children (Satire)
Laurie Rogers, via a kind email
Perched up there the tears of others are never upon our own cheek.”
― Elizabeth Goudge, The White Witch
“I say let the world go to hell, but I should always have my tea.”
― Fyodor Dostoyevsky, Notes from Underground
Republicans, Democrats, progressives, communists, anarchists, elitists, corporatists and fascists are finally working together – in a multi-partisan effort to look the same. Having outlawed logic several sessions ago, Washington legislators are fixing education by breaking it some more.
- HB 2799 would pay the deep thinkers in the colleges of education to “partner” with K-12 on “innovation,” thus sending all of us farther into financial, academic and social ruin.
- HB 2337 would pay the geniuses at the state education agency to write online curricula in alignment with the unfunded, unproved, arguably illegal, obscenely expensive de facto federal mandate called the Common Core. Legislators who had promised to help fight off the Common Core defended their support of HB 2337 by saying, “Shut up. Don’t be so negative.”
- HB 2586 would pay for mandated standardized testing of kindergartners, getting them started early with government brow-beating and low self-esteem. Legislators explained the idea: “Why should kindergartners feel good about themselves? Nobody else gets to do it.”
- HB 2533 was affectionately dubbed “Fund the Education Mob First.” Legislators defended their support of this bill by refusing to discuss it.
School districts already suffering from a phenomenal growth in their operating and capital projects budgets over ten years have been forced to consider doing things properly and efficiently. Desperate, they begged for help, and lawmakers came to their aid by voting to eliminate everything from school buildings other than administrative staff. As a matter of efficiency, the measures became law before they were written.
As a result of these measures, school district buildings in Washington State soon will have nothing in them but administrators, support staff and “Vote Yes for Kids!” signs. Forums were held around the state to pretend to gather feedback. In Spokane, administrators shrugged and said, “So what? We’ve already begun to do that. We’ve been trying to get rid of the little buggers for decades.”
As a result of these measures, school district buildings in Washington State soon will have nothing in them but administrators, support staff and “Vote Yes for Kids!” signs. Forums were held around the state to pretend to gather feedback. In Spokane, administrators shrugged and said, “So what? We’ve already begun to do that. We’ve been trying to get rid of the little buggers for decades.”
Ritalin Gone Wrong
To date, no study has found any long-term benefit of attention-deficit medication on academic performance, peer relationships or behavior problems, the very things we would most want to improve.
First details of proposed Wisconsin school accountability system revealed
The state could more aggressively intervene in the lowest-performing publicly funded schools under a proposed accountability system unveiled Monday.
The system would rate schools on a scale of 0 to 100 based on student performance and growth on state tests, closing achievement gaps and preparing students for college and careers. Ratings also would be tied to dropout rates and third-grade literacy levels.
The http://dpi.state.wi.us/esea/pdf/eseawaiver_coverletter.pdf“>http://dpi.state.wi.us/esea/index.html“>Department of Public Instruction released a draft application to the U.S. Education Department for a waiver from the 10-year-old federal No Child Left Behind Act, which State Superintendent of Public Instruction Tony Evers said “has shackled schools by being overly prescriptive and prohibiting creative reforms.”
“Wisconsin’s request for flexibility from NCLB is driven by the belief that increasing rigor across the standards, assessment and accountability system will result in improved instruction and improved student outcomes,” Evers saidDPI’s Initial Draft Full Waiver Proposal (2.5MB PDF):
Raising Expectations, Increasing Rigor
As noted in Principle 1, DPI has significantly raised expectations for schools and the proportion of students who graduate ready for college and career, as indicated by the adoption of rigorous academic standards, higher cut scores based on NAEP as the state transitions to SBAC, increasingly rigorous and adaptive assessment systems, and increased graduation requirements. The new accountability report card and the new system of support, rewards, and recognition will reflect these new expectations. While the state has previously emphasized graduation rates (and boasted one of the highest in the nation), DPI also recognizes the state has significant achievement and graduation gaps. The accountability index prioritizes achievement and attainment using measures which emphasize not only graduation, but also the proportion of students graduating college and career ready. Additionally, the system examines achievement gaps within and across schools as a means to address the state’s existing gaps. Using a multifaceted index will help pinpoint areas of need within a school, as well as areas of strength, and help schools track their progress at meeting the needs of all student subgroups. Within the system of support, identified schools will participate in diagnostic reviews and needs assessments (Priority and Focus Schools, respectively) to identify their instructional policies, practices, and programming that have impacted student outcomes and to differentiate, and individualize reforms and interventions. While planning and implementing reforms, schools and districts will have access to increasingly expansive and timely data systems to monitor progress. Additionally, the state will require Priority and Focus Schools to implement RtI (with the support of the Wisconsin RtI Center and its resources) to ensure that all students are receiving customized, differentiated services within a least restrictive environment, including additional supports and interventions for SwDs and ELLs as needed, or extension activities and additional challenge for students exceeding benchmarks.
Washington, DC School District unveils first ranking of public charter schools
The District unveiled its first rankings of public charter schools Tuesday, part of a new rating system that offers parents a broader assessment of school progress than annual standardized test results.
The new performance evaluation shows how test scores of students have grown over the last year, relative to their academic peers across the city. Schools also are assessed against a series of leading indicators and “gateway” measurements that researchers regard as predictors of future educational success. They include third-grade DC CAS reading scores, eighth-grade math scores and 11th-grade PSAT results.
Madison School Board’s DIFI (District Identified for Improvement) Plan Discussion
The Madison School Board (the discussion begins at about 58 minutes) video archives (11.7.2011) is worth a watch.
Related: Madison School District Identified for Improvement (DIFI); Documentation for the Wisconsin DPI1. Develop or Revise a District Improvement Plan
Address the fundamental teaching and learning needs of schools in the Local Education Agency (LEA), especially the academic problems o f low-achieving students.
MMSD has been identified by the State of Wisconsin as a District Identified for Improvement, or DIFI. We entered into this status based on District WKCE assessment scores. The data indicates that sub-groups of students-African American students, English Language Learner Students with Disabilities or Economically Disadvantaged -did not score high enough on the WKCE in one or more areas of reading, math or test participation to meet state criteria.
Under No Child Left Behind, 100% of students are expected to achieve proficient or advanced on the WKCE in four areas by 2014. Student performance goals have been raised every year on a regular schedule since 2001, making targets more and more difficult to reach each year. In addition to the curriculum changes being implemented, the following assessments are also new or being implemented during the 2011-12 school year (see Attachment 1):Perhaps the No Child Left Behind requirement waivers that Education Secretary Duncan has discussed remove the urgency to address these issues. Of course, the benchmark used to measure student progress is the oft-criticized WKCE “Wisconsin, Mississippi Have “Easy State K-12 Exams” – NY Times”.
Related: Comparing Wisconsin & Texas: Updating the 2009 Scholastic Bowl Longhorns 17 – Badgers 1; Thrive’s “Advance Now Competitive Assessment Report”.
Madison School District Identified for Improvement (DIFI); Documentation for the Wisconsin DPI
Madison School District Superintendent Dan Nerad 15MB PDF
1. Develop or Revise a District Improvement Plan
Address the fundamental teaching and learning needs of schools in the Local Education Agency (LEA), especially the academic problems o f low-achieving students.
MMSD has been identified by the State of Wisconsin as a District Identified for Improvement, or DIFI. We entered into this status based on District WKCE assessment scores. The data indicates that sub-groups of students-African American students, English Language Learner Students with Disabilities or Economically Disadvantaged -did not score high enough on the WKCE in one or more areas of reading, math or test participation to meet state criteria.
Under No Child Left Behind, 100% of students are expected to achieve proficient or advanced on the WKCE in four areas by 2014. Student performance goals have been raised every year on a regular schedule since 2001, making targets more and more difficult to reach each year. In addition to the curriculum changes being implemented, the following assessments are also new or being implemented during the 2011-12 school year (see Attachment 1):
- The Measures of Academic Progress (MAP): Grades 3-7. MAP is incorporated into the MMSD Balanced Assessment Plan as a computer adaptive benchmark assessment tool for grades 3-7. Administration of the assessment was implemented in spring, 2011.
- Cognitive Ability Test (CogAT): Grades 2 and 5. As proposed in the Talented and Gifted Plan approved by the Board of Education in August, 2009, the district requested approval of funds to purchase and score the Cognitive Ability Test (CogAT) which was administered in February, 2011, to all second and fifth graders.
- The EPAS System: Explore Grades 8-9, Plan Grade 10, ACT Grade 11. The EPAS system provides a longitudinal, systematic approach to educational and career planning, assessment, instructional support, and evaluation. The system focuses on the integrated, higher-order thinking skills students develop in grades K-12 that are important for success both during and after high school. The EPAS system is linked to the College and Career Readiness standards so that the information gained about student performance can be used to inform instruction around those standards.
Attached are six documents describing programs being implemented for the 2011-12 school year to address the needs of all students.
1. Strategic Plan Document: Year Three (Attachment 2)
2. Strategic Plan Summary of Three Main Focus Areas (Attachment 3)
3. Addressing the Needs of All Learners and Closing the Achievement Gap Through K-12 Alignment (Attachment 4)
4. Scope and Sequence (Attachment 5)
5. The Ideal Graduate from MMSD (Attachment 6)
6. 4K Update to BOE- Program and Sites- (Attachment 7)Clusty Search: District Identified for Improvement (DIFI)
Matthew DeFour:Madison School District administrators aren’t keeping track of the best classroom instruction. Not all principals create a culture of high expectations for all students. And teachers aren’t using the same research-based methods.
Such inconsistencies across the district and within schools — stemming from Madison’s tradition of school and teacher autonomy — are hurting student achievement, according to a district analysis required under the federal No Child Left Behind law.
“There are problems within the entire system,” Superintendent Dan Nerad said. “We do have good practice, but we need to be more consistent and have more fidelity to our practices.”
Inconsistencies in teaching and building culture can affect low-income students, who are more likely to move from school to school, and make teacher training less effective, Nerad said.
The analysis is contained in an improvement plan the district is scheduled to discuss with the School Board on Monday and to deliver next week to the state Department of Public Instruction.
Lawsuits for School Reform?: Parent Power May Insert Itself in L.A. Unified’s Teachers’ Contract; Demand that the LAUSD Immediately Comply with the Stull Act
Earlier this year, Dropout Nation argued that one way that school reformers — including school choice activists and Parent Power groups — could advance reform and expand school choice was to file lawsuits similar to school funding torts filed for the past four decades by school funding advocates. But now, it looks like Parent Power activists may be filing a lawsuit in Los Angeles on a different front: Overhauling teacher evaluations. And the Los Angeles Unified School District may be the place where the first suit is filed.
In a letter sent on behalf of some families Wednesday to L.A. Unified Superintendent John Deasy and the school board — and just before the district begins negotiations with the American Federation of Teachers’ City of Angels unit over a new contract — Barnes & Thornburg’s Kyle Kirwan demanded that the district “implement a comprehensive system” of evaluating teachers that ties “pupil progress” data to teacher evaluations. Kirwan and the group he represents are also asking for the district to begin evaluating all teachers “regardless of tenure status” and to reject any contract with the American Federation of Teachers local that allows for any veteran teacher with more than a decade on the job to go longer than two years without an evaluation if they haven’t had one in the first place.We represent minor-students currently residing within the boundaries of the Los Angeles Unified School District (the “District” or “LAUSD”), the parents of these students, and other adults who have paid taxes for a school system that has chronically failed to comply with California law.
Our clients seek to have the District immediately meet its obligations under the Stull Act, a forty year old law that is codified at California Education Code section 44660 et seq. (the “Stull Act“).
In relevant part, the Stull Act requires that “[t]he governing board of each school district establish standards of expected pupil achievement at each grade level in each area of study.”
Cal. Educ. Code § 44662(a). The Stull Act requires further that “[t]he governing board of each school district … evaluate and assess certificated employee performance as it reasonably relates to … [t]he progress of pupils toward the standards established pursuant to subdivision (a) and, if applicable, the state adopted academic content standards as measured by state adopted criterion referenced assessments ….” Cal. Educ. Code§ 44662(b)(l).
In the forty years since the California Legislature passed the Stull Act, the District has never evaluated its certificated personnel based upon the progress of pupils towards the standards established pursuant to Education Code section 44662(a) and, if applicable, the state adopted academic content standards as measured by the state adopted criterion referenced assessments; never reduced such evaluations to writing or added the evaluations to part of the permanent records of its certificated personnel; never reviewed with its certificated personnel the results of pupil progress as they relate to Stull Act evaluations; and never made specific recommendations on how certificated personnel with unsatisfactory ratings could improve their performance in order to achieve a higher level of pupil progress toward meeting established standards of expected pupil achievement.
Reforming NCLB: How the GOP and Democrats Compare
Everybody hates the No Child Left Behind Act. In the last few weeks, both conservative Republicans and President Obama have announced plans to overhaul George W. Bush’s signature education law by sending power over K-12 schooling back to the states. On the surface, this might seem like a rare moment of bipartisan consensus. Don’t believe it. The two plans actually represent radically different views of the federal government’s responsibility for helping children learn.
To see why, it helps to understand some common misconceptions about NCLB. The law requires schools to administer annual reading and math tests in grades 3-8 and once in high school, and it holds schools accountable for the percentage of students who pass the tests. That target percentage increases steadily over time, to 100 percent in 2014. Since universal proficiency is obviously impossible, the law has been cast as a malevolent force designed to tar public schools with “failing” labels as a prelude to corporate takeover and/or conversion to the free-market voucher nirvana of Milton Friedman’s dreams.
There are, however, three aspects of NCLB that render this scenario very unlikely. First, states were given total discretion to set their own academic standards, pick their own tests, and decide what scores on the tests count as passing. Last year, for example, Alabama reported that 87 percent of its fourth graders had passed the state’s reading test. Yet Alabama is, by all available measures, one of the most academically low-performing states in the nation. According to the federal National Assessment of Education Progress, only 34 percent of Alabama fourth graders are proficient in reading. The lesson: Give state education officials the ability to decide how their performance will be judged, and they’ll respond in predictable fashion.
Wisconsin Read to Lead Task Force 8.25.2011 Meeting Summary
Wisconsin Reading Coaltion, via a kind reader’s email:
Summary of the August 25, 2011 Read to Lead Task Force Meeting
Green Bay, WI
The fifth meeting of the Read to Lead task force was held on August 25, 2011, at Lambeau Field in Green Bay. Governor Walker was delayed, so State Superintendent Tony Evers opened the meeting. The main topic of discussion was accountability for reading outcomes, including the strategy of mandatory grade retention. Troy Couillard from DPI also presented an overview of reading reform in Milwaukee Public Schools.
Accountability
Superintendent Evers said that Wisconsin will seek a waiver from the No Child Left Behind proficiency requirements by instituting a new system of accountability. His Educator Effectiveness and Accountability Design teams are working on this, with the goal of a new accountability system being in place by late 2011.
Accountability at the educator level:
The concept of using student achievement or growth data in teacher and principal evaluations is not without controversy, but Wisconsin is including student data in its evaluation model, keeping in mind fairness and validity. The current thought is to base 50% of the educator evaluation on qualitative considerations, using the Danielson Framework http://www.danielsongroup.org (“promoting professional learning through self assessment, reflection on practice, and professional conversations”), and 50% on student data, including multiple measures of performance. 10% of the student data portion of the evaluation (5% of the total evaluation) would be based on whole-school performance. This 5% would be based on a proficiency standard as opposed to a value-added measurement. The 5% is thought to be small enough that it will not affect an individual teacher adversely, but large enough to send a message that all teachers need to work together to raise achievement in a school. The task force was asked if it could endorse whole-school performance as part of teacher evaluation. The task force members seemed to have some support for that notion, especially at the principal level, but had some reservations at the level of the individual teacher.
Kathy Champeau was concerned that some schools do not have the resources to serve some children. She also felt it might not be fair to teachers, as they have no control over other teachers in the school or the principal.
Steve Dykstra said it is important to make sure any value-added system is designed to be fair.
Rachel Lander felt it would be better to use value-added data for whole-school performance rather than a proficiency standard, but supported the importance of schoolwide standards.
Rep. Steve Kestell supported the 5% requirement, and questioned what the qualitative half of the evaluation would be based on. He felt perhaps there could be some schoolwide standards to be met in that part of the evaluation, also.
Tony Evers responded that the Danielson Framework was research-based observations, and that the evaluators would need to be highly trained and consistent in their evaluations.
Tony Pedriana had questions about the type of research on which the Danielson Framework is based.
Evers said he would provide further information to the task force.
Mara Brown said she cannot control what the teacher down the hall does, and that the 5% should apply only to principals.
Linda Pils agreed with the 5%, but felt principals need to be watching and guiding new teachers. She agreed with Dykstra’s comments on measuring growth.
Sen. Luther Olsen was concerned that the 5% portion of a teacher’s evaluation may be the part that tips the balance on job retention for an individual, yet that individual has no control over whole-school performance. He understood the principle of getting everyone involved and committed to a goal, but was concerned with possible consequences.
Mandatory Retention:
The task force was asked to consider whether Wisconsin should implement a mandatory retention policy. If so, what would it look like, and if not, what can be done to make sure students are reading at grade level?
After a guest presentation and discussion, the consensus of the task force was that Wisconsin should not have mandatory retention. Reasons cited were negative effects on later achievement, graduation, self esteem, and psychological well-being. Third grade was felt to be far too late to start intervention, and there needs to be more emphasis on developing teacher expertise and focusing on the responsibility of teachers, principals, and higher education as opposed to threatening the students with retention. Retention without changing the curriculum for the student the following year is pointless.
Dr. Elaine Allensworth, a director at the Consortium on Chicago School Research, joined the task force by telephone to summarize the outcomes of a mandatory retention project in Chicago. Students more than 1 year below the cut-off level on certain tested skills were retained unless they passed the test after a summer bridge program. Students identified as at-risk were given after-school tutoring during the year. Retention was thought to have three primary mechanisms that would affect student performance: motivation for students, families, and teachers to work harder, supplemental instruction after school and during the summer, and an additional year in the grade for failing students. All students in the school could be affected by the motivation and the supplemental instruction, but only the retained students by the extra year of instruction. The study found that the threat of retention worked as a positive motivator for teachers, parents, and some older students. However, there were also negatives in terms of higher-achieving students receiving less attention, more time on test preparation, and an instructional shift to focus on tested skills. The supplemental instruction, especially the summer bridge program, was the biggest positive of the retention project. There was high participation, increased personal attention, and higher-quality instruction. Retention itself had more negative effects than positive. Academic gains were either non-existent or rapidly-disappearing. Multiple year retentions resulted in a problematic mix of ages in classrooms, students unable to finish high school by age 18, and a negative overall attitude toward school.
Dykstra said it appeared that the impetus to do things differently because of the threat of retention had some benefit, but the actual retention had either no effect or a negative effect. He wondered if there was some way to provide the motivation without retention.
Allensworth agreed that the challenge was to provide a motivation without having a threat.
Pils asked if third graders could even understand the threat of retention.
Allensworth replied that they understood if teachers helped them. She also said that some schools with low-quality instruction had no way to improve student learning even with the threat of retention.
Rep. Jason Fields asked how you could avoid teaching to the test.
Allensworth replied that teaching the skills on the test was productive, but not the excessive time that was spent on test-taking strategies. She also said the tendency to teach more narrowly could cause problems later in high school where students needed to be able to participate in broader learning.
Marcia Henry inquired about students who returned to their old rate of learning when they returned to the regular classroom after successfully completing the summer bridge.
Allensworth replied that the summer program used higher quality curriculum and teachers, there was more time provided with students, and the students were more highly motivated.
Dykstra asked if it was possible to determine how much of the summer gain was due to student motivation, and how much due to teachers or parents.
Allensworth said those factors could not be pulled apart.
Champeau questioned whether the summer bridge program taught to the test.
Allensworth replied that it taught in a good way to the skills that the test assessed.
Brown asked if intervention was provided for the first time in third grade.
Allensworth replied that some schools began providing intervention and retaining in first or second grade.
Dykstra asked if the project created a situation where a majority of the school’s resources were concentrated in third grade, leaving other grades short.
Allensworth said they didn’t look at that, though some schools appeared to put their better teachers at certain grades.
Dykstra thought it was the wrong approach to tie services and supports to a specific grade rather than a specific student.
Are some types of consequences necessary to achieve the urgency and intensity necessary for performance improvement? Should there be mandatory summer school or other motivators? The task force did not seem to arrive at a consensus on this.
Lander said schools need the resources to do early intervention, plus information on what should be done in early intervention, and this is not currently the case in Wisconsin.
Pils questioned where teachers would find the time to provide intervention. She liked the idea of after-school and summer programs as well as reading the classics to kids. Providing a model of best instruction is important for teachers who don’t have that background.
Mary Read commented on Bill Gates’ experience with spending a lot of money for minimal results, and the conclusion that money needs to go into teacher training and proven programs such as the Kipp schools or into a national core curriculum.
Dykstra noted that everyone agrees that teacher training is essential, but there is disagreement as to curriculum and training content. His experience is that teachers are generally unable to pinpoint what is going wrong with a student’s reading. We must understand how poor and widespread current teacher training is, apologize to teachers, and then fix the problem, but not at teachers’ expense.
The facilitators asked what the policy should be. Is there an alternative to using retention? Should teacher re-training be mandatory for those who need the support?
Evers said that a school-by-school response does not work. The reforms in Milwaukee may have some relevance.
Olsen suggested that there are some reading programs that have been proven successful. If a school is not successful, perhaps they should be required to choose from a list of approved instructional methods and assessment tools, show their results, and monitor program fidelity. He feels we have a great resource in successful teachers in Wisconsin and other states, and the biggest issue is agreeing on programs that work for intervention and doing it right the first time.
Kestell said some major problems are teachers with high numbers of failing students, poor teacher preparation, the quality of early childhood education, and over-funding of 4K programs without a mandate on how that money is used. There has been some poor decision-making, and the kids are not responsible for that. We must somehow hold schools, school board, and individual educators accountable.
Champeau said teachers have no control over how money is spent. This accountability must be at the school and district level. More resources need to be available to some schools depending on the needs of their student population.
Lander: We must provide the necessary resources to identified schools.
Dykstra: We must develop an excellent system of value-added data so we can determine which schools are actually doing well. Right now we have no way of knowing. High-performing schools may actually be under-performing given their student demographics; projected student growth will not be the same in high and low performing schools.
Pedriana: We have long known how to teach even the most at-risk readers with evidence-based instruction. The truth is that much of our teacher training and classroom instruction is not evidence-based. We need the collective will to identify the evidence base on which we will base our choices, and then apply it consistently across the state. The task force has not yet taken on this critical question.
Pils: In her experience, she feels Wisconsin teachers are among the best in the country. There are some gaps we need to close.
Pedriana: Saying how good we are does not help the kids who are struggling.
Pils: We need to have our best teachers in the inner city, and teachers should not need to purchase their own supplies. We have to be careful with a limited list of approved programs. This may lead to ethics violations.
Pedriana: Referring to Pils’ mention of Wisconsin’s high graduation rates in a previous meeting, what does our poor performance on the NAEP reading test say about our graduation standards?
Michael Brickman (Governor’s aide): There is evidence of problems when you do retention, and evidence of problems when you do nothing. We can’t reduce the failing readers to zero using task force recommendations, so what should we do with students who leave 3rd grade not reading anywhere near grade level? Should we have mandatory summer school?
Henry: Response to Intervention (RTI) is a perfect model for intervening early in an appropriate way. A summer bridge program is excellent if it has the right focus. We must think more realistically about the budget we will require to do this intervention.
Olsen: If we do early intervention, we should have a very small number of kids who are still behind in 3rd grade. Are we teaching the right, most efficient way? We spend a lot of money on K-12 education in Wisconsin, but we may need to set priorities in reading. There is enough money to do it. Reading should be our mission at each grade level.
Facilitator: What will be the “stick” to make people provide the best instruction?
Dykstra: Accountability needs to start at the top in the state’s education system. When the same people continue to make the same mistakes, yet there are no consequences, we need to let some people go. That is what they did in Massachusetts and Florida: start with two or three people in whom you have great confidence, and build from there.
Facilitator: Is there consensus on mandatory summer school for failing students?
Michele Erickson: Summer school is OK if the right resources are available for curriculum and teachers.
Kestell: All grades 4K – 3 are gateway grades. They are all important.
Champeau: Summer school is a good idea, but we would need to solve transportation issues.
Dykstra: We should open up the concept of summer school beyond public schools to any agency that offers quality instruction using highly qualified instructors from outside the educational establishment.
Lander: Supports Dykstra’s idea. You can’t lay summer instruction on schools that can hardly educate during the school year.
Brown: Could support summer school in addition to, but not in place of, early intervention during the school year.
Erickson: Look at the school year first when allocating resources. Summer school is a hard sell to families.
Pedriana: Agrees with Olsen that we probably have sufficient funds for the school year, but we need to spend it more wisely. We cannot expect districts to make the commitment to extra instruction if there is no accountability at the top (including institutions of higher education). We need to resolve the issue of what knowledge and content standards will be taught before we address summer school or other issues.
Milwaukee Public Schools’ tiered RTI system was presented by DPI’s Troy Couillard as an example of an accountability system. MPS chose a new core reading program for 2010-11 after submitting its research base to DPI. Teachers were provided with some in-service training, and there are some site checks for fidelity of implementation. Tier 2 interventions will begin in 2011-12, and Tier 3 interventions in 2012-13. He felt that the pace of these changes, plus development of a data accountability system, student screening with MAP and other testing, progress monitoring, and professional development, has MPS moving much faster than most districts around the county on implementing RTI. DPI embedded RTI in the district’s Comprehensive Literacy Plan. DPI is pushing interventions that are listed on the National RTI site, but teachers are allowed to submit research for things they are using to see if those tools might be used.
Pils: Kids in MPS are already struggling. Reading First would suggest that they have 120 minuets of reading a day instead of the 90 minutes provided in the MPS plan.
Couillard: Tier 2 intervention for struggling students will add onto the 90 minutes of core instruction.
Olsen: Can this system work statewide without DPI monitoring all the districts?
Couillard: Districts are trained to monitor their own programs.
Pils: Veteran schools with proven strategies could be paired with struggling schools as mentors and models.
Pedriana: We have no way of knowing what proven strategies are unless we discuss what scientific evidence says works in reading. The task force must grapple with this question.
Brickman: Read to Lead task force needs to start with larger questions and then move to finer grain; this task force may not be able to do everything.
Pedriana: Is there anything more important for this task force to do than to decide what evidence-based reading instruction is?
Brickman: Task force members may submit suggestions for issues to discuss at the final meeting in September. Tony could submit some sample language on “evidence-based instruction” as a starting point for discussion.
Henry: The worst schools should be required to at least have specific guidelines, whether it is a legislative or DPI issue. Teacher retraining (not a 1-day workshop) is a necessity. Teachers are unprepared to teach.
Olsen: Wisconsin has always been a local control state, but one of the outcomes of the task force may be that we have a method for identifying schools that are not doing well, and then intervene with a plan. The state is ultimately responsible for K-12 education. Districts should take the state blueprint or come up with their own for approval by the state.
Erickson: Can we define what will work so districts can just do it?
Evers: MPS experience shows there is a process that works, and districts can do their own monitoring.
Dykstra: Sees value in making a list of things that districts are not allowed to do in reading instruction; also value in making a list of recommended programs based on alignment with the convergence of the science of reading research. That list would not be closed, but it should not include programs based on individual, publisher-funded studies that do not align with the convergence of the science. This could be of benefit to all districts. Even those doing relatively well could be doing better. Right now there is no list, and no learning targets. The MPS plan contains the Wisconsin Model Early Learning Standards, which contain errors. DPI needs to correct that information and distribute it right now. That would be a good example of accountability at the state level.
Couillard: The new statewide data collection system will help districts monitor their own data.
Champeau: School needs change depending on demographics. The goal should be to build decision-making capacity at the local level, not dictation from outside. We should be talking more about people than programs. Have MPS teachers been doing a better job? What will they do if their program goes away? We need to work on the underlying expertise and knowledge base.
Facilitator: There appears to be agreement that the state can intervene in failing districts.
Lander: We might have some consensus as to what teachers need to know, and then go into schools to see if they know it. If not, we need to teach them.
Pedriana: What is so bad about providing a program, with training, of course? It would help people.
Facilitator: There is consensus around training of teachers.
Dykstra: Some of the distinction between training and programs is artificial. You need both.
Other things the state could require: weighting of reading in evaluation systems, grading of schools etc.
Dykstra: If giving schools grades, they should get separate grades for how they do in teaching separate content areas. In addition, everything should be reported in the best value-added system we can create, because it’s the only way to know if you’re doing a good job.
Pils: Doesn’t like grading of schools. She has a whole folder on cheating in districts that have grading of schools and high stakes tests.
Evers: Do we just want to measure what schools are doing, or do we want to use it to leverage change?
Erickson: Wisconsin has gone from 3rd to 30th on the NAEP, so of course we should be seeking change.
Walker: The idea is not to pick on failing schools, but to help them. We must be able to deploy the resources to the things that work in accordance with science and research to teach reading right.
Dykstra: We should seek small kernels of detailed information about which teachers consistently produce better results in a given type of school for a given type of student. There is a problem with reliability when using MAP data at an individual student level.
Supt. Evers talked about the new state accountability system as being a better alternative to no Child Left Behind. Governor Walker said the state is not just doing this as an alternative to NCLB, but in response to comments from business that our graduates are not well-prepared. Parents want to know what all schools are doing.
Olsen: We need a system to monitor reading in Wisconsin before we get into big trouble. Our changing population is leading us to discover challenges that other states have dealt with for years.
Kestell: The accountability design team is an excellent opportunity to discuss priorities in education; a time to set aside personal agendas and look for solutions that work.
Next Meeting/Status of Report
Michael Brickman will try to send out a draft of a report the week of August 29 with his best interpretation of task force consensus items. The final meeting will be Sept. 27, perhaps in Madison, Eau Claire, or Wausau. Some task force issues will need to be passed on to other task forces in the future.Related: A Capitol Conversation on Wisconsin’s Reading Challenges and Excellence in Education explains Florida’s reading reforms and compares Florida’s NAEP progress with Wisconsin’s at the July 29th Read to Lead task force meeting and www.wisconsin2.org.
Children of divorce fall behind peers in math, social skills
UW News Service Divorce is a drag on the academic and emotional development of young children, but only once the breakup is under way, according to a study of elementary school students and their families. “Children of divorce experience setbacks in math test scores and show problems with interpersonal skills and internalizing behavior during the […]
Madison school officials want new standardized tests
Madison students are slated to get a double dose of standardized tests in the coming years as the state redesigns its annual series of exams while school districts seek better ways to measure learning.
For years, district students in grades three through eight and grade 10 have taken the Wisconsin Knowledge and Concepts Examination (WKCE), a series of state-mandated tests that measure school accountability.
Last month, in addition to the state tests, eighth- and ninth-graders took one of three different tests the district plans to introduce in grades three through 10. Compared with the WKCE, the tests are supposed to more accurately assess whether students are learning at, above or below grade level. Teachers also will get the results more quickly.
“Right now we have a vacuum of appropriate assessment tools,” said Tim Peterson, Madison’s assistant director of curriculum and assessment. “The standards have changed, but the measurement tool that we’re required by law to use — the WKCE — is not connected.”Related Links:
- The WKCE has been used for the District’s “Value Added Assessment” progam
- The WKCE has been often criticized for its lack of rigor: Wisconsin’s Low State Test Score Standards (“The Proficiency Illusion”) by Alan Borsuk.
- Many links on the WKCE.
- Clusty Search: EXPLORE test; Blekko Search.
- Clusty Search: Measures of Academic Progress (MAP); Blekko Search.
I’m glad that the District is planning alternatives to the WKCE.
Questions and Concerns Regarding the “Findings and Recommendations” of the MMSD K-12 Literacy Program Evaluation report
The following questions and concerns are submitted to you for your consideration regarding the “findings and recommendations” of the MMSD K-12 Literacy Program Evaluation report:
1. What findings and recommendations are there for ‘year-around’ literacy experiences to help mitigate ‘losses’ over the summer months in achievement gains during the traditional academic year?
Although “summer loss” was not a particular focus of discussion during the evaluation process, there are several ways in which the recommendations address reducing the impact of summer reading loss. These include:
Recommendation I – curricular consistency will provide for a more seamless connection with content and instruction in summer school, Saturday school (pending funding) and after school supports.
Recommendation II – more explicit instruction focused in early grades will allow students to read for enjoyment at earlier ages.
Recommendation III – a well-developed intervention plan will follow a student through summer school and into the following academic year
2. What are the findings and recommendations regarding parental (significant adults in student’s life) participation, training, evaluation and accountability in the literacy learning process?
Parental participation opportunities to support their children’s enjoyment and achievement in literacy include:
Family Literacy Nights at various elementary schools and in collaboration with Madison School and Community Recreation. Town Hall Meetings that provide opportunities for families to share pros and cons of literacy practices at school and home.
Literacy 24-7: Parent training for Spanish speaking families on how to promote literacy learning. Read Your Heart Out Day: This event builds positive family, community and school relationships with a literacy focus and supports both the family involvement and cultural relevance components of the Madison Metropolitan School District Strategic Plan.
Tera Fortune: Professional development for parents about the Dual Language Immersion Program with a focus on bi-literacy throughout the content areas. MALDEF Curriculum Training: Nine-week training covering a variety of topics to assist parents in sharing the responsibility of student success and how to communicate effectively in schools.
Regular column in Umoja Magazine: Forum to inform families and community members about educational issues through African American educators’ expertise. Several columns have focused on literacy learning at home.
Training is provided for parents on how to choose literature that:
Has positive images that leave lasting impressions
Has accurate, factual information that is enjoyable to read
Contains meaningful stories that reflect a range of cultural values and lifestyles
Has clear and positive perspective for people of color in the 21st century
Contains material that is self affirming Promotes positive literacy learning at home
Evaluations of the Read Your Heart Out and Family Literacy Night were conducted by requesting that participating parents, staff, students and community members complete a survey about the success of the event and the effects on student achievement.
3. What are the consequential and remediation strategies for non-performance in meeting established achievement/teaching/support standards for students, staff and parents? What are the accompanying evaluation/assessment criteria?
A District Framework is nearing completion. This Framework will provide clear and consistent expectations and rubrics for all instructional staff and administrators. Improvement will be addressed through processes that include the School Improvement Plans and staff and administrator evaluations processes.
4. Please clarify the future of the Reading Recovery program.
MMSD proposes to maintain Reading Recovery teachers and teacher leaders as an intervention at grade 1. There are currently two Reading Recovery teacher leaders participating in a two-year professional development required to become Reading Recovery teacher leaders. One of these positions will be certified to support English Language Learners. The modifications proposed include: 1) targeting these highly skilled Reading Recovery teachers to specific students across schools based on district-wide data for 2011-12 and 2) integrating the skills of Reading Recovery staff into a comprehensive intervention plan along with skilled interventionists resulting in all elementary schools benefiting from grade 1 reading intervention.
5. How will the literacy learning process be integrated with the identification and development of Talented and Gifted (TAG) students?
The development of a balanced, comprehensive assessment system will result in teachers having more frequent and accurate student data available to tailor instruction. K-12 alignment uses tools such as Measures of Academic Progress (MAP) and Educational Planning and Assessment System (EPAS) are being implemented in Spring, 2011.
The Response to Intervention model is based on evidence-based instruction and responds to students who need additional challenge and/or support.
6. What will be the 2010-2011 budgetary priorities and strategies for undertaking the literacy program and resources recommendations outlined in the report?
PreK-12 literacy will be a priority for the 2011-12 budget process. In addition to the prioritization of funding within our budget parameters, MMSD is in the process of writing a major grant (Investing in Innovation – i3) to support the recommendations of the literacy evaluation as a key strategy to close achievement gaps and improve literacy for all students to be ready for college and/or careers.
Public School Districts – Return on Educational Investment: Madison Has a “Low ROI”
The Center for American Progress, via a kind reader’s email:
The Wisconsin school systems of Oshkosh and Eau Claire are about the same size and serve similar student populations. They also get largely similar results on state exams-but Eau Claire spends an extra $8 million to run its school system
This report is the culmination of a yearlong effort to study the efficiency of the nation’s public education system and includes the first-ever attempt to evaluate the productivity of almost every major school district in the country. In the business world, the notion of productivity describes the benefit received in exchange for effort or money expended. Our project measures the academic achievement a school district produces relative to its educational spending, while controlling for factors outside a district’s control, such as cost of living and students in poverty.
Our nation’s school system has for too long failed to ensure that education funding consistently promotes strong student achievement. After adjusting for inflation, education spending per student has nearly tripled over the past four decades. But while some states and districts have spent their additional dollars wisely–and thus shown significant increases in student outcomes–overall student achievement has largely remained flat. And besides Luxembourg, the United States spends more per student than any of the 65 countries that participated in a recent international reading assessment, and while Estonia and Poland scored at the same level as the United States on the exam, the United States spent roughly $60,000 more to educate each student to age 15 than either nation.
Our aims for this project, then, are threefold. First, we hope to kick-start a national conversation about educational productivity. Second, we want to identify districts that generate higher-than-average achievement per dollar spent, demonstrate how productivity varies widely within states, and encourage efforts to study highly productive districts. Third–and most important–we want to encourage states and districts to embrace approaches that make it easier to create and sustain educational efficiencies.
This report comes at a pivotal time for schools and districts. Sagging revenues have forced more than 30 states to cut education spending since the recession began. The fiscal situation is likely to get worse before it gets better because the full impact of the housing market collapse has yet to hit many state and local budgets. At a time when states are projecting more than $100 billion in budget shortfalls, educators need to be able to show that education dollars produce significant outcomes or taxpayers might begin to see schools as a weak investment. If schools don’t deliver maximum results for the dollar, public trust in education could erode and taxpayers may fund schools less generously.
While some forward-thinking education leaders have taken steps to promote better educational efficiency, most states and districts have not done nearly enough to measure or produce the productivity gains our education system so desperately needs. Some fear that a focus on efficiency might inspire policymakers to reduce already limited education budgets and further increase the inequitable distribution of school dollars. To be sure, our nation’s system of financing schools is unfair. Low-income and minority students are far more likely to attend schools that don’t receive their fair share of federal, state, and local dollars. But while the issue of fairness must be central to any conversation about education finance, efficiency should not be sacrificed on the altar of equity. Our nation must aspire to have a school system that’s both fair and productive.
Our emphasis on productivity does not mean we endorse unfettered market-based reforms, such as vouchers allowing parents to direct public funds to private schools. Nor do we argue that policymakers should spend less on education. Indeed, we believe neither of these approaches can solve the nation’s pressing education challenges. Transforming our schools will demand both real resources and real reform. As Education Secretary Arne Duncan recently said: “It’s time to stop treating the problem of educational productivity as a grinding, eat-your-broccoli exercise. It’s time to start treating it as an opportunity for innovation and accelerating progress.”Madison’s results can be seen here. I asked Superintendent Dan Nerad what benefits citizens, students and parents received from Madison’s greater per student spending, then, for example, his former Green Bay school district in this recent interview.
Madison spent $15,241 per student according to the 2009-2010 Citizen’s Budget. I’ve not seen a 2010-2011 version.
Under Pressure, Teachers Tamper With Test Scores
The staff of Normandy Crossing Elementary School outside Houston eagerly awaited the results of state achievement tests this spring. For the principal and assistant principal, high scores could buoy their careers at a time when success is increasingly measured by such tests. For fifth-grade math and science teachers, the rewards were more tangible: a bonus of $2,850.
But when the results came back, some seemed too good to be true. Indeed, after an investigation by the Galena Park Independent School District, the principal, assistant principal and three teachers resigned May 24 in a scandal over test tampering.
The district said the educators had distributed a detailed study guide after stealing a look at the state science test by “tubing” it — squeezing a test booklet, without breaking its paper seal, to form an open tube so that questions inside could be seen and used in the guide. The district invalidated students’ scores.
Of all the forms of academic cheating, none may be as startling as educators tampering with children’s standardized tests. But investigations in Georgia, Indiana, Massachusetts, Nevada, Virginia and elsewhere this year have pointed to cheating by educators. Experts say the phenomenon is increasing as the stakes over standardized testing ratchet higher — including, most recently, taking student progress on tests into consideration in teachers’ performance reviews.Somewhat related: Wisconsin’s annual student test, the WKCE has often been criticized for its lack of rigor.
“Anything But Knowledge”: “Why Johnny’s Teacher Can’t Teach”
from The Burden of Bad Ideas Heather Mac Donald, Chicago: Ivan R. Dee, 2000, pp. 82ff.
America’s nearly last-place finish in the Third International Mathematics and Sciences Study of student achievement caused widespread consternation this February, except in the one place it should have mattered most: the nation’s teacher education schools. Those schools have far more important things to do than worrying about test scores–things like stamping out racism in aspiring teachers. “Let’s be honest,” darkly commanded Professor Valerie Henning-Piedmont to a lecture hall of education students at Columbia University’s Teachers College last February. “What labels do you place on young people based on your biases?” It would be difficult to imagine a less likely group of bigots than these idealistic young people, happily toting around their handbooks of multicultural education and their exposés of sexism in the classroom. But Teachers College knows better. It knows that most of its students, by virtue of being white, are complicitous in an unjust power structure.
The crusade against racism is just the latest irrelevancy to seize the nation’s teacher education schools. For over eighty years, teacher education in America has been in the grip of an immutable dogma, responsible for endless educational nonsense. That dogma may be summed up in the phrase: Anything But Knowledge. Schools are about many things, teacher educators say (depending on the decade)–self-actualization, following one’s joy, social adjustment, or multicultural sensitivity–but the one thing they are not about is knowledge. Oh, sure, educators will occasionally allow the word to pass their lips, but it is always in a compromised position, as in “constructing one’s own knowledge,” or “contextualized knowledge.” Plain old knowledge, the kind passed down in books, the kind for which Faust sold his soul, that is out.
The education profession currently stands ready to tighten its already viselike grip on teacher credentialing, persuading both the federal government and the states to “professionalize” teaching further. In New York, as elsewhere, that means closing off routes to the classroom that do not pass through an education school. But before caving in to the educrats’ pressure, we had better take a hard look at what education schools teach.
The course in “Curriculum and Teaching in Elementary Education” that Professor Anne Nelson (a pseudonym) teaches at the City College of New York is a good place to start. Dressed in a tailored brown suit, and with close-cropped hair, Nelson is a charismatic teacher, with a commanding repertoire of voices and personae. And yet, for all her obvious experience and common sense, her course is a remarkable exercise in vacuousness.
As with most education classes, the title of Professor Nelson’s course doesn’t give a clear sense of what it is about. Unfortunately, Professor Nelson doesn’t either. The semester began, she said in a pre-class interview, by “building a community, rich of talk, in which students look at what they themselves are doing by in-class writing.” On this, the third meeting of the semester, Professor Nelson said that she would be “getting the students to develop the subtext of what they’re doing.” I would soon discover why Professor Nelson was so vague.
“Developing the subtext” turns out to involve a chain reaction of solipsistic moments. After taking attendance and–most admirably–quickly checking the students’ weekly handwriting practice, Professor Nelson begins the main work of the day: generating feather-light “texts,” both written and oral, for immediate group analysis. She asks the students to write for seven minutes on each of three questions; “What excites me about teaching?” “What concerns me about teaching?” and then, the moment that brands this class as hopelessly steeped in the Anything But Knowledge credo: “What was it like to do this writing?”
Excellence in Action: Seven Core Principles
Foundation for Excellence in Education:
High academic standards: High academic standards are based on the principle that all students can learn. Raising expectations for what students are required to learn in the classroom will better prepare students for success. Standards in core subjects must be raised to meet international benchmarks to ensure American students can compete with their peers around the globe.
Standardized measurement: To provide an accurate depiction of where our students are, annual standardized testing must be continued and expanded in all 50 states. Measuring whether students are learning a year’s worth of knowledge in a year’s time is essential for building on progress, rewarding success and correcting failures. To accurately measure progress, modern data and information systems should be utilized, and there must be maximum transparency across the board.
Data-driven accountability: Holding schools accountable for student achievement – measured objectively with data such as annual standardized tests and graduation rates – improves the quality of an education system. Success and learning gains no longer go unnoticed and problems are no longer ignored, resulting in efforts to effectively narrow achievement gaps.
Writing Instruction in Massachusetts: Commonwealth’s Students Making Gains, Still Need Improvement
BOSTON – Writing Instruction in Massachusetts [1.3MB PDF], published today by Pioneer Institute, underscores the fact that despite 17 years of education reform and first-in-the-nation performance on standardized tests, many Massachusetts middle school students are still not on the trajectory to be prepared for writing in a work or post-secondary education environment.
The study is authored by Alison L. Fraser, president of Practical Policy, with a foreword by Will Fitzhugh of The Concord Review, who, since 1987, has published over 800 history research papers by high school students from around the world.
Writing Instruction finds that Massachusetts’ students have improved, with 45 percent of eighth graders writing at or above the ‘Proficient’ level on the 2007 National Assessment of Educational Progress test. In comparison, only 31 percent of eighth graders scored at or above ‘Proficient’ in 1998. The paper ascribes Massachusetts’ success in improving writing skills to adherence to MCAS standards and the state’s nation-leading state curriculum frameworks. It also suggests that strengthening the standards will help the state address the 55 percent of eighth graders who still score in the “needs improvement” or below categories.
According to a report on a 2004 survey of 120 major American businesses affiliated with the Business Roundtable, remedying writing deficiencies on the job costs corporations nearly $3.1 billion annually. Writing, according to the National Writing Commission’s report Writing: A Ticket to Work…Or a Ticket Out, is a “threshold skill” in the modern world. Being able to write effectively and coherently is a pathway to both hiring and promotion in today’s job market.
“While we should be pleased that trends show Massachusetts students have improved their writing skills, the data shows that we need renewed focus to complete the task of readying them for this important skill,” says Jim Stergios, executive director of Pioneer Institute. “Before we even think about altering academic standards, whether through state or federal efforts, we need to recommit to such basics.”
The study notes that if the failure to learn to write well is pervasive in Massachusetts, one should look first to the Massachusetts Curriculum Frameworks and the Massachusetts Comprehensive Assessment System (MCAS) designed to measure mastery of those frameworks. Analysis completed in December 2009 by a member of the Board of Elementary and Secondary Education found that nearly all of the skills that the 21st Century Skills Task Force identified as important, such as effective written communication, are already embedded in the state’s academic standards guiding principles.
Leaders & Laggards: A State-By-State Report Card of Educational Innovation
Two years ago, the U.S. Chamber of Commerce, the Center for American Progress, and Frederick M. Hess of the American Enterprise Institute came together to grade the states on school performance. In that first Leaders and Laggards report, we found much to applaud but even more that requires urgent improvement. In this follow-up report, we turn our attention to the future, looking not at how states are performing today, but at what they are doing to prepare themselves for the challenges that lie ahead. Thus, some states with positive academic results receive poor grades on our measures of innovation, while others with lackluster scholarly achievement nevertheless earn high marks for policies that are creating an entrepreneurial culture in their schools. We chose this focus because, regardless of current academic accomplishment in each state, we believe innovative educational practices are vital to laying the groundwork for continuous and transformational change.
And change is essential. Put bluntly, we believe our education system needs to be reinvented. After decades of political inaction and ineffective reforms, our schools consistently produce students unready for the rigors of the modern workplace. The lack of preparedness is staggering. Roughly one in three eighth graders is proficient in reading. Most high schools graduate little more than two-thirds of their students on time. And even the students who do receive a high school diploma lack adequate skills: More than 33% of first-year college students require remediation in either math or English.Ben Paynter has more.