Van Hise’s “Special Sauce”
Laurie Frost and Jeff Henriques, via a kind email:
Dear Superintendent Cheatham and Members of the Madison School Board:
We are writing as an update to our Public Appearance at the December 12 Board meeting. You may recall that at that meeting, we expressed serious concerns about how the District analyzes and shares student data. For many years, it has seemed to us that the District reports data more with an eye towards making itself look good than to genuinely meeting children’s educational needs. As social scientists with more than two decades of involvement with the Madison schools, we have long been frustrated by those priorities.
Our frustration was stirred up again last week when we read the newly released MMSD 2017 Mid- Year Review, so much so that we felt called upon to examine a specific section of the report more closely. What follows is expressly not a critique of the MMSD elementary school in question, its staff, or its students. What follows is solely a critique of what goes on in the Doyle Building.
MMSD 2017 Mid-Year Review and Van Hise Elementary School’s “Special Sauce”
Near the end of the MMSD 2017 Mid-Year Review, there is an excited update on the “extraordinary [student] growth” happening at Van Hise Elementary School:
School Update: Van Hise students and families build on strengths
In last year’s Annual Report, Principal Peg Keeler and Instructional Resource Teacher Sharel Nelson revealed Van Hise Elementary School’s “special sauce,” which helped students achieve extraordinary growth in the Measures of Academic Progress (MAP) assessments. We reported that seventy percent of the school’s African American third through fifth grade students were proficient or advanced and half of third through fifth grade students receiving Special Education services were proficient.
We recently caught up with Principal Keeler and Ms. Nelson to get an update on their students’ progress.
“In the past, we felt that one of our strengths as a school was to hold kids to very high expectations. That continues to be the case. We promote a growth mindset and kids put their best effort toward their goals,” said Principal Keeler. “Our older students are provided a process for reflecting on how they did last time on the MAP assessment. They reflect on areas they feel they need to continue to work on and the goals they set for themselves. They reflect on what parts were difficult and what they can improve upon.”
Nelson discussed the sense of community among Van Hise students and how the Van Hise equity vision encompasses families as partners. “We have a comprehensive family engagement plan. We are working together with our families – all on the same page. The students feel really supported. We’re communicating more efficiently and heading toward the same goals,” Nelson said.
Principal Keeler added, “It’s been a fantastic year, it continues to get stronger.”
We got curious about the numbers included in this update — in part because they are some of the few numbers to be found in the 2017 Mid-Year Review — and decided to take a closer look. All additional numbers used in the analysis that follows were taken from the MMSD website.
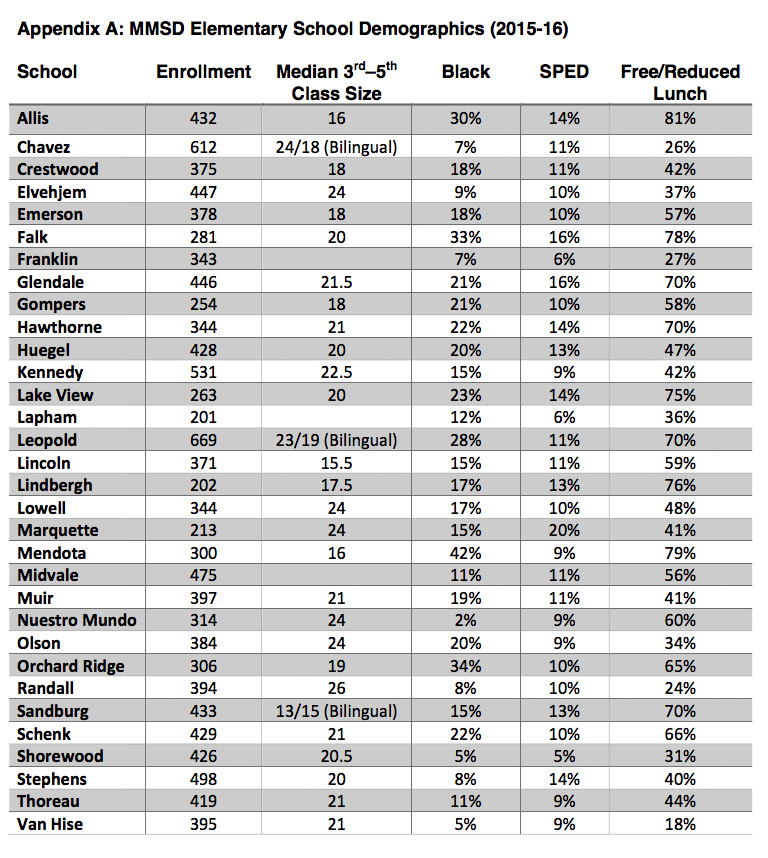
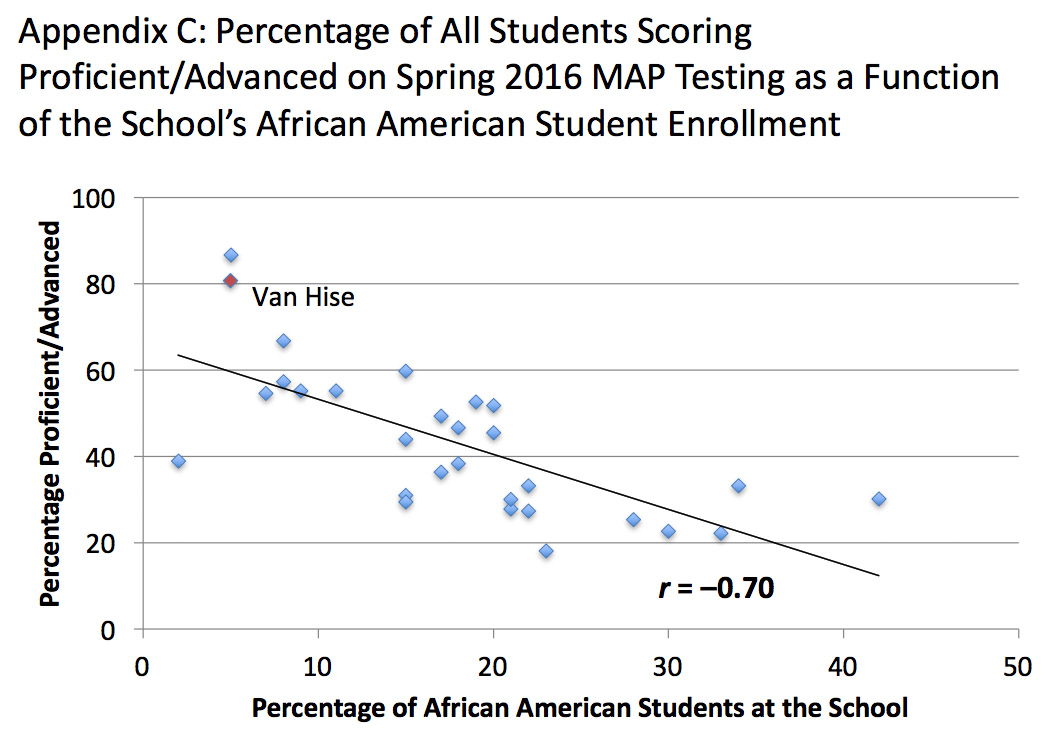
As you know, Van Hise is a K-through-5th grade elementary school on Madison’s near west side. In 2015-16, it enrolled 395 students, 5% (20) of whom were African American and 9% (36) of whom received special education services. (Note: These percentages are some of the lowest in the District.) For purposes of explication, let’s say half of each of those groups were in grades K-2 and half were in grades 3-5. That makes 10 African American and 18 special education students in grades three-through-five.
The Mid-Year Review states that in 2015-16, an extraordinary 70% of Van Hise’s African American third-through-fifth grade students were proficient or advanced (in something — why not say what?). But 70% of 10 students is only 7 students. That’s not very many.
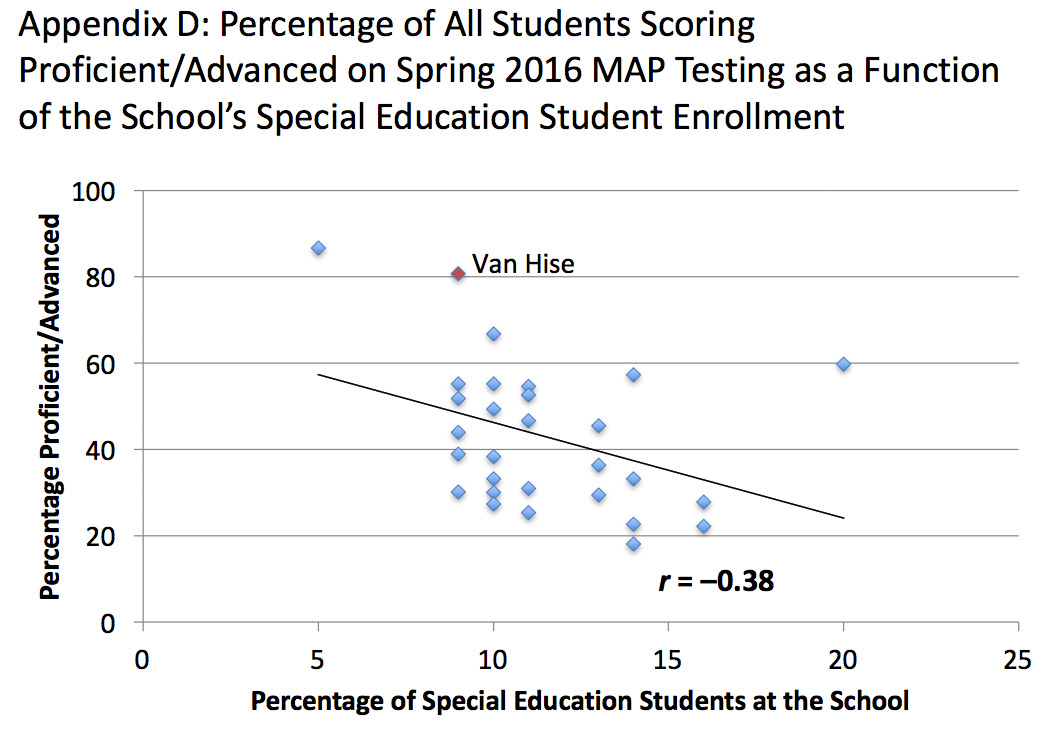
The Mid-Year Review also states that in 2015-16, an equally extraordinary 50% of Van Hise’s third- through-fifth grade special education students scored proficient (in something). But again, 50% of 18 students is only 9 students.
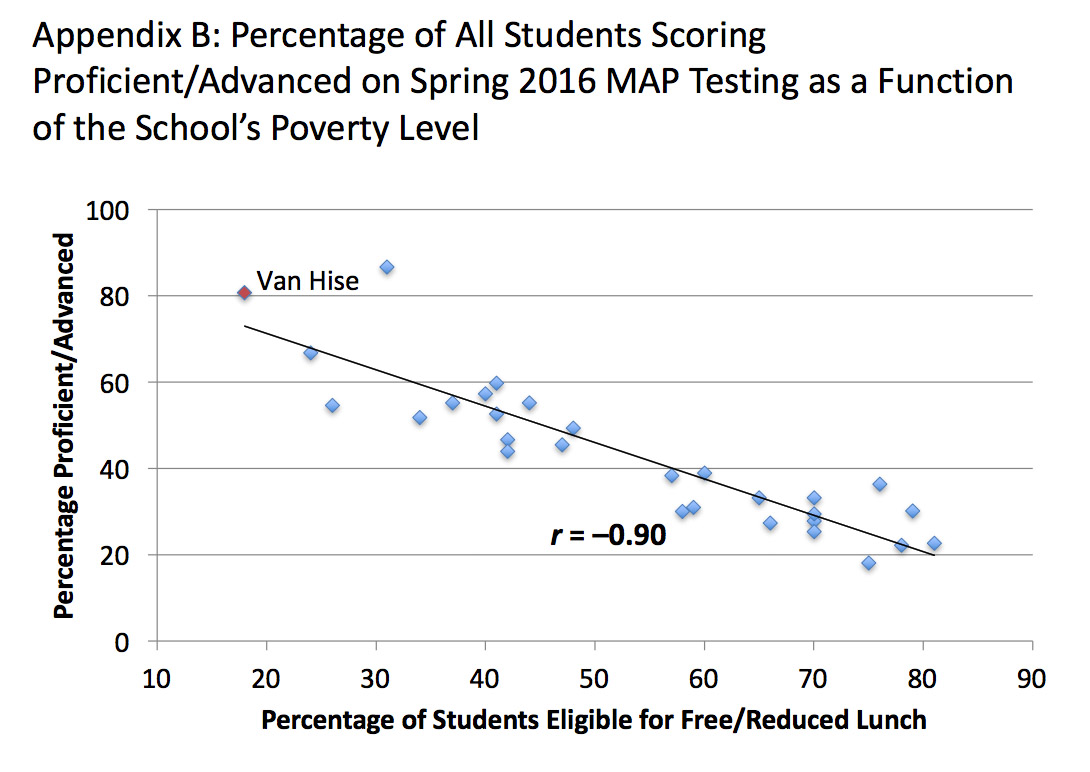
To complete the demographic picture, it is important to note that Van Hise is the MMSD elementary school with the lowest rate of poverty; in 2015-16, only 18% of its students were eligible for Free/Reduced Lunch. (Note: The Districtwide average is 50%).
We would argue that this additional information and analysis puts the Van Hise Elementary School update into its proper context … and makes the numbers reported far less surprising
and “extraordinary.”
The additional information also makes the Van Hise “special sauce” – whatever it is they are doing in the school to achieve their “extraordinary” results with African American and special education students – far less relevant for the District’s other elementary schools, schools with significantly higher percentages of African American, low income, and special education students.
In terms of its demographic profile, Van Hise is arguably the most privileged elementary school in Madison. Perhaps, then, its “special sauce” is nothing more than the time-worn recipe of racial, socioeconomic, and other forms of political advantage.
But be that as it may, it is not our main point. Our main objective here has been to provide a clear- cut example of how the MMSD cherry picks its examples and “manages” its data presentation for public relations purposes.
We believe the overarching drive to make the District look good in its glossy reports is a misguided use of District resources and stands as an ongoing obstacle to genuine academic progress for our most disadvantaged and vulnerable students.
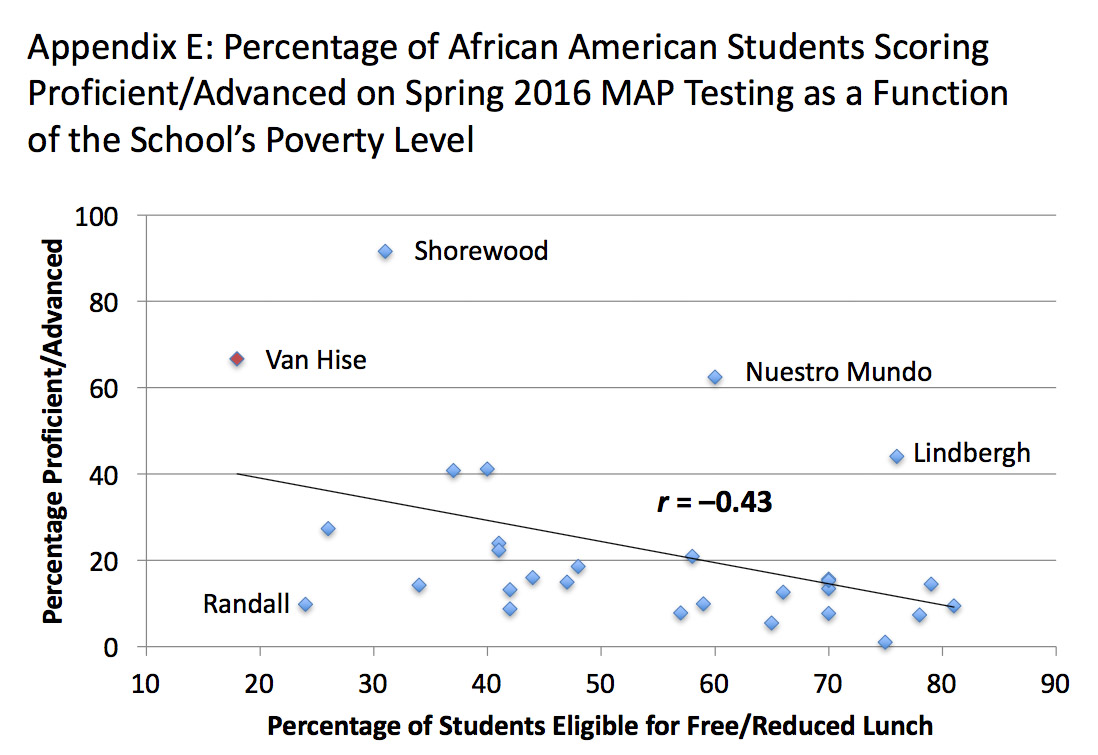
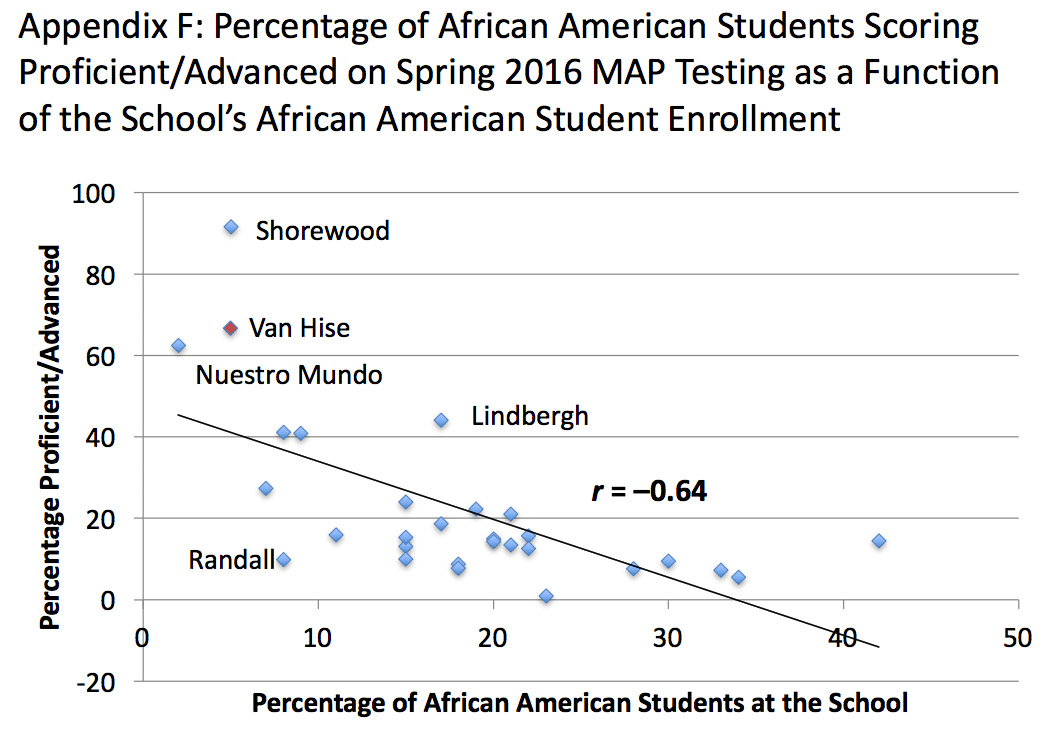
The Appendices attached to this report consist of a table and several graphs that expand upon the foregoing text. We hope you will take the time to study them. (When you look at Appendices E and F, you may find yourselves wondering, as we did, what’s going on at Lindbergh Elementary School, where the African American students are performing much better than one would expect, given their demographics? Similarly, you may wonder what’s going on at Randall Elementary School, where the African American students are performing much worse than one would expect?)
Please feel free to contact us with any questions you may have about this analysis. As School Board members, you cannot work effectively on behalf of our community’s children unless you understand the District’s data. We are happy to help you achieve that understanding.
Respectfully,
Laurie Frost, Ph.D.
Jeff Henriques, Ph.D.
APPENDICES
Appendix A: MMSD Elementary School Demographics (2015-16)
Appendix B: Percentage of All Students Scoring Proficient/Advanced on Spring 2016 MAP Testing as a Function of the School’s Poverty Level
Appendix C: Percentage of All Students Scoring Proficient/Advanced on Spring 2016 MAP Testing as a Function of the School’s African American Student Enrollment
Appendix D: Percentage of All Students Scoring Proficient/Advanced on Spring 2016 MAP Testing as a Function of the School’s Special Education Student Enrollment
Appendix E: Percentage of African American Students Scoring Proficient/Advanced on Spring 2016 MAP Testing as a Function of the School’s Poverty Level
Appendix F: Percentage of African American Students Scoring Proficient/Advanced on Spring 2016 MAP Testing as a Function of the School’s African American Student Enrollment
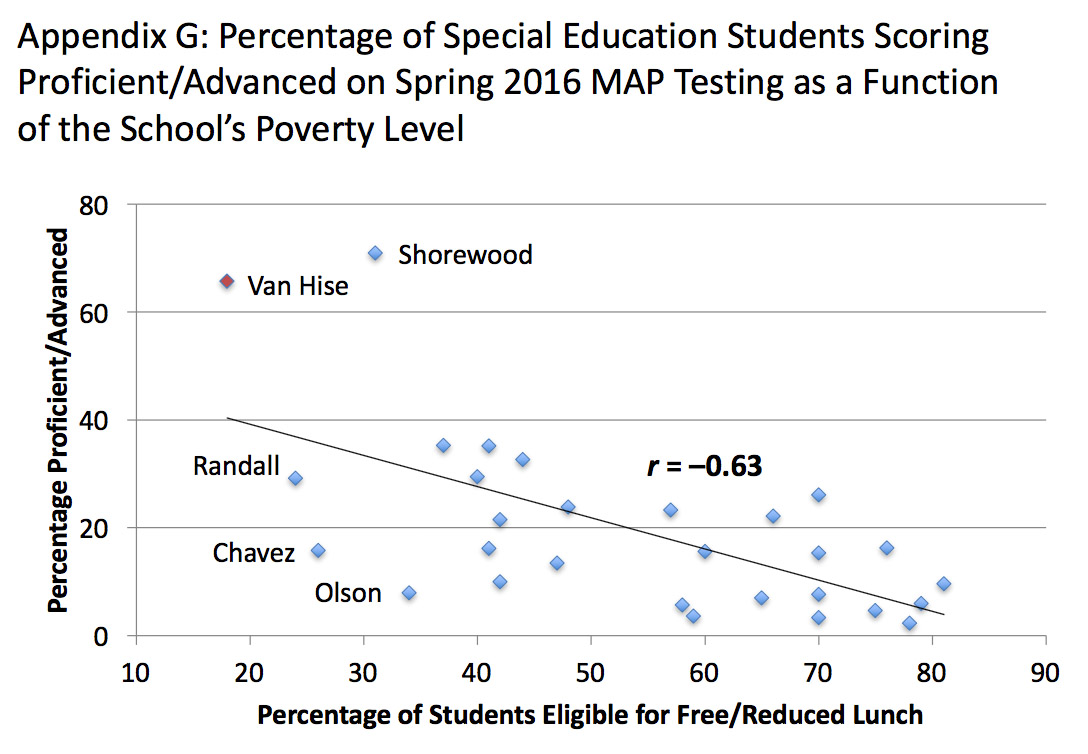
Appendix G: Percentage of Special Education Students Scoring Proficient/Advanced on Spring 2016 MAP Testing as a Function of the School’s Poverty Level
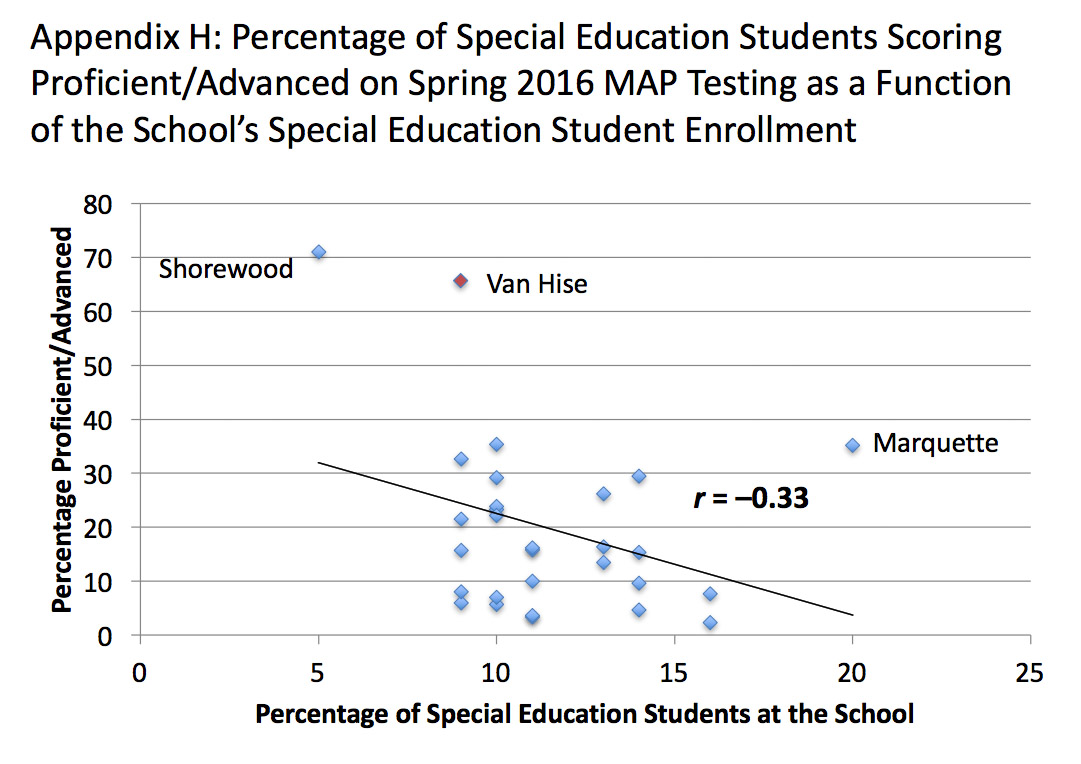
Appendix H: Percentage of Special Education Students Scoring Proficient/Advanced on Spring 2016 MAP Testing as a Function of the School’s Special Education Enrollment
Note:
Appendices B through H utilize Spring 2016 MAP data for MMSD third-through-fifth grade students only. The scores for each school are simple averages of the percentages of students scoring proficient or advanced in reading or math across those three grades. We freely acknowledge that these calculations lack some precision; however, given the data we have access to, they are the best we could do.
Source: https://public.tableau.com/profile/bo.mccready#!/vizhome/MAPResults2015- 16/MAPResultsWithSchool
The Madison School District’s 2016 “Mid Year Review“.
Madison expanded its least diverse schools, including Van Hise, via a recent tax increase referendum.