
I read with interest Nathan Comps’ article on the forthcoming 2012-2013 Madison School District budget. Board Vice President Marj Passman lamented:
“If Singapore can put a classroom of students on its money, and we can’t even put our money into children, what kind of country are we?” asks Passman, Madison school board vice president. “It’s going to be a horrible budget this year.”
Yet, according to the World Bank, Singapore spends 63% less per student than we do in America on primary education and 47% less on secondary education. The US spent $10,441/student in 2007-2008 while Madison spent $13,997.27/student during that budget cycle. Madison’s 2011-2012 budget spends $14,858.40/student.
The Economist on per student spending:
Those findings raise what ought to be a fruitful question: what do the successful lot have in common? Yet the answer to that has proved surprisingly elusive. Not more money. Singapore spends less per student than most. Nor more study time. Finnish students begin school later, and study fewer hours, than in other rich countries.
In Finland all new teachers must have a master’s degree. South Korea recruits primary-school teachers from the top 5% of graduates, Singapore and Hong Kong from the top 30%.
Rather than simply throwing more money (Madison taxpayers have long supported above average K-12 spending) at the current processes, perhaps it is time to rethink curriculum and just maybe, give Singapore Math a try in the Madison schools.
Related:
- 60% to 42%: Madison School District’s Reading Recovery Effectiveness Lags “National Average”: Administration seeks to continue its use
- Singapore Math and Math Forum.
- Singapore school statistics (PDF)
- When A Stands for Average: Students at the UW-Madison School of Education Receive Sky-High Grades. How Smart is That?
- Alabama, unlike Wisconsin, participated in the 2011 global TIMSS examinations. Perhaps one day, Wisconsin will have the courage to compare our students to the world.
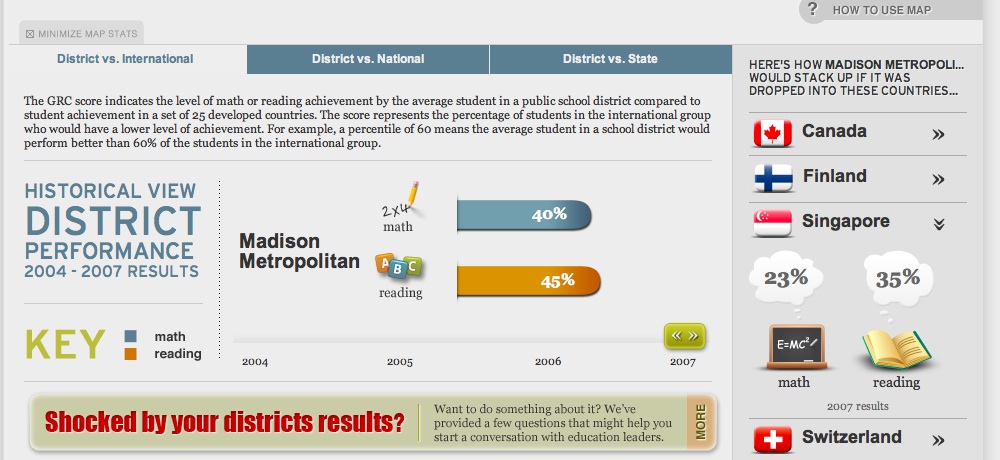
Via the Global Report Card. The average Madison student performs better than 23% of Singapore students in Math and 35% in reading.
Really … Please clarify I find 25% of GDP not believable. Consider Food, Transportation, Housing, utilities, National Defense (and offense).
In WA state we have about 1 million k-12 students and spend around $10,000 per student.
According to that ratio … that gives WA state a GDP of 1,000,000 x $10,000 x 4 = 40,000,000,000
dividing that by 6 million residents =>
40,000/6 = $6,700 per capita GDP for WA residents.
BUT the Per Capita GDP of WA State is $52,000
http://en.wikipedia.org/wiki/List_of_U.S._states_by_GDP
Wisconsin GDP $44,000 per capita
Actual WA State GDP = 351,100 million dollars and
WA k-12 spending of $9754 x 1,040,000 students = $10,144 million
10,144/351,100 = 2.9%
I get 2.9% of GDP on k-12 education … which makes someone off by a factor of about 10. As this article shows spending for k-12 at 23% of GDP.
Can someone please explain this large discrepancy?