Referendum Climate: Charts – Enrollment; Local, State, Federal and Global Education Spending
Variations of this question are often asked: “Are we spending too much, too little or just the right amount on education?” I thought it might be useful to have a look at some local, state, federal and global information. Click to view the charts in detail:
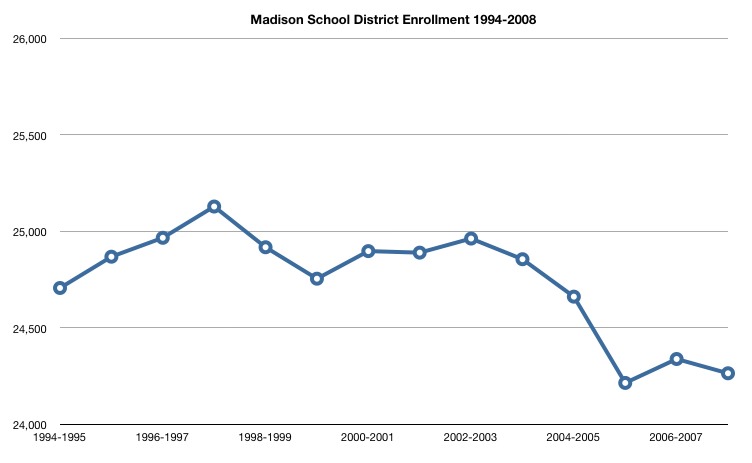
Madison School District Enrollment: 1994-2007 (the demographics have changed during this time) |
Madison School District Budgets: 1995-2009 |
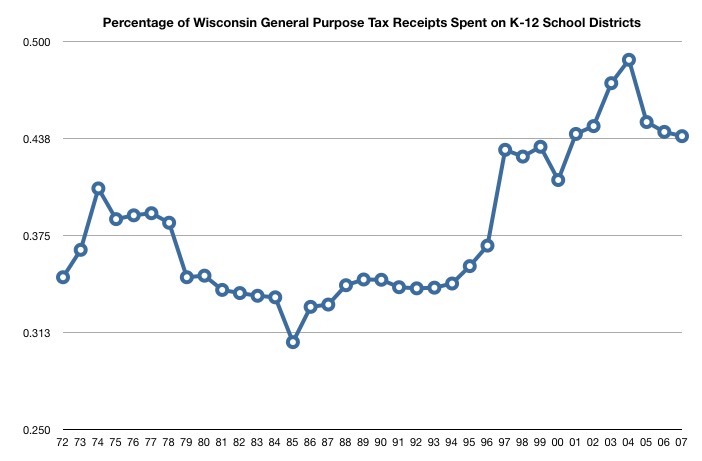
Percentage of Wisconsin General Purpose State Tax Revenue Spent on K-12 School Districts: 1972-2007 |
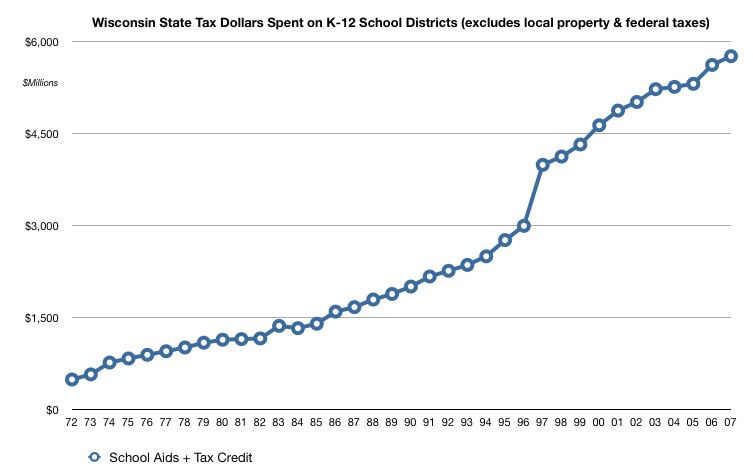
Wisconsin State Tax Dollars Spent on K-12 School Districts: 1972-2007 |
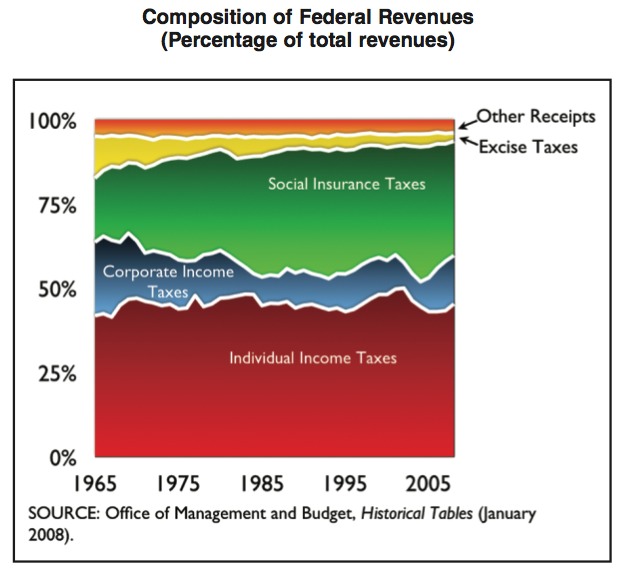
US Government Tax Revenue, by Source: 1965-2005 |
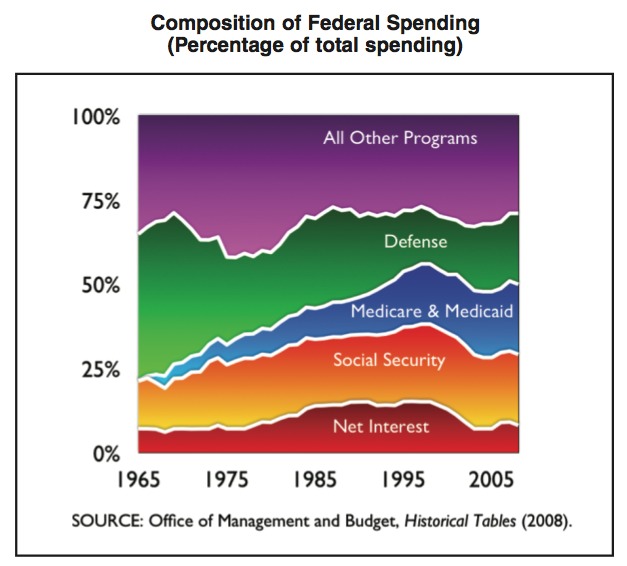
Composition of US Government Spending: 1965-2005 |
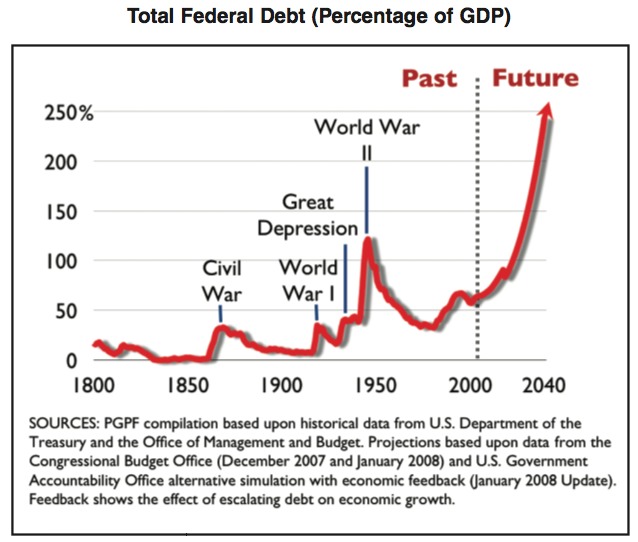
Total US Governement Debt, as a percentage of GDP |
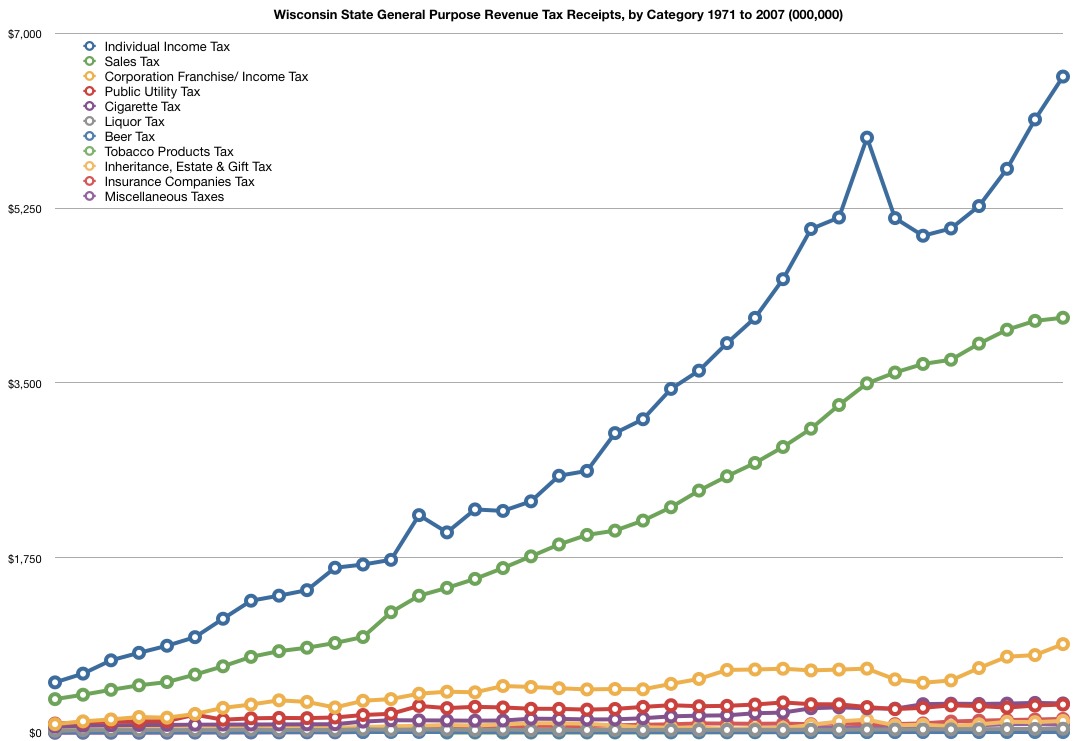
Wisconsin General Purpose Revenue Tax Receipts by Category: 1971-2007 |
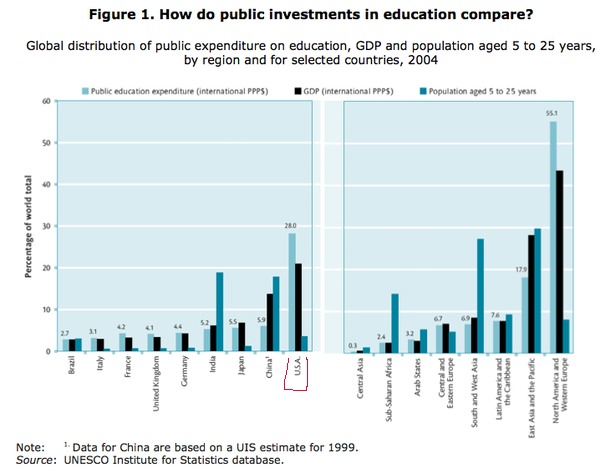
Global Distribution of public expenditure on Education: ages 5 to 25 |
Data via the Madison School District (various budget documents and statistics), The Wisconsin Taxpayers Alliance, I.O.U.S.A: One Nation, Under Stress, in Debt and the UNESCO Institute for Statistics Database.
US Bureau of Labor Statistics: Consumer Price Index. $1000 in 1995 requires $1443.33 according to their inflation calculator, while $1000 in 1972 requires $5,262.30 in 2008.
November Madison School District Planned November, 2008 Referendum notes & links. Tax climate notes & links: When is a Tax Cut Really a Tax Hike by Gene Epstein, 20 Reasons to Kill Corporate Taxes by James Pethokoukis, I.O.U.S.A the Movie, the Economist: Inflation’s Last Hurrah and Dave Blaska on the proposed referendum.
Wow. Thank you for this post. GDP vs ed spending!
What I get from this is that enrollment has dropped by less than a thousand students in 15 years, the budget has gone up about 3% – 5% per year (the rate of inflation), state spending has stayed within the caps as set by law, and other countries don’t invest as much money in their public education as we do because we have more children to educate. So what? Am I missing something here?
Dumb question – as I look at the first chart, I’m having trouble lining up the academic year with the data points. Am I misreading the chart, or are there more data points that years? And, if so, what are the time intervals for the various points? Again, I may be misreading the chart…. if so, apologies.
Lucy
Hi Lucy:
Here are the numbers underlying the first chart:
Madison School District Enrollment
1994-1995 24710
1995-1996 24872
1996-1997 24970
1997-1998 25132
1998-1999 24921
1999-2000 24758
2000-2001 24901
2001-2002 24893
2002-2003 24966
2003-2004 24859
2004-2005 24665
2005-2006 24218
2006-2007 24342
2007-2008 24268
We’re repeatedly told that the district has made “cuts,” yet the budget has increased at the rate of 3-5% every year. This is approximately the rate that we’re told teachers salaries/benefits must be increased under the QEO, and salaries-benefits are, what, 75% or more of the budget. If this is the case, I can’t understand why cuts need to be made.
My feeling is that there is something being hidden from the public about the salaries/benefits being provided to staff. My guess is the actual amount that is being provided in increased benefits and wages to individual teachers is far in excess of that 3.8%, and when summed over the entire staff result in us strip mining programs for kids in order to provide benefits/salary for adults.
Donald Pay’s comments seem on target. Eye balling the Madison Budget graph shows that the average increase per year (slope of the curve) is approximately $10,000,000/year, which translates into a 4% increase year over year.
Since the cuts to the same service budget range from $6,000,000 to $8,000,000 per year, MMSD cost must be increasing in the neighborhood of 7% to 8% per year. Since approximately 80% of the budget is wages and benefits, wages and benefits costs must be increasing at a rate of about 6%.
PS: I love Donald’s graphic “strip mining” to describe MMSD’s approach to the budgeting process.
Thanks for trying to clarify this. I am curious about Jim Zellmer’s thoughts on his post.
Hi Laura:
Perhaps it is a sign of the times.
Whenever I hear a substantive subject discussed, in this case, education spending; I’m often curious about the facts vs. rhetoric.
K-12 spending increases annually and interestingly, quite a bit during the Bush years. There is disagreement about whether it is enough and perhaps, if the money is spent in the right places.
I also am interested, generally, in the percentage of tax dollars spent on education, versus other needs, such as health care, senior assistance among others.
I think, over the years, local credibility has been affected by a rather liberal use of the term “cut”.
http://www.schoolinfosystem.org/archives/001761.php
Dictionary.com on “cut”
http://dictionary.reference.com/browse/cut
If there is an argument to be made, then I’d suggest it is on the merits of a program (or programs) rather than the “gap” between “same service” school spending increases and tax receipt growth, some of which is limited by state law.
It appears that the new Madison Administration is taking a different approach to these matters than we’ve seen in the past.
Finally, my sense is that societal, in some ways apart from educational needs will continue to grow. Does it make sense, then, in Madison, for example, to continue the current structure which is largely top down (“same service”)? Are charters, or perhaps a group of smaller “districts” more effective? Should we aim high for more, but smaller high schools with a strong embrace of virtual learning tools? If we look back from the year 2050, what will be required?
A great teacher friend reminds me that we’re stuck in the mud with our agrarian K-12 model.
As I understand it, the new superintendent is planning to look at existing programs and determine which are obselete or ineffective, and eliminate them. Once that is done, he will have a better idea of what he really has as a budget. In the mean time, he needs some breathing room to look at each program. It is my understanding that if the proposed referendum is passed, the Superintendent, board, students, parents and residents will be able to go forward with a proposed plan to determine the districts priorities. If the referendum fails, there will be a hap-hazard cutting process that doesn’t really serve students or taxpayers well.
I support any referendum that will slow down the budget process so we can determine what works and what doesn’t work. Some of the suggestions you put forward such as charter schools and smaller districts may work but it seems premature to make those changes when there is so much confusion about current spending.
I find it interesting that MMSD has any data to show which programs are obsolete or ineffective. I raised this issue in terms of the budget process years ago with the Board and with Rainwater, and Roger Price. The NCES has suggested approaches to annotating budget lines based on demographic, school, course information so that the budget lines can be analyzed as part of reviewing programs for effectiveness (and cost effectiveness).
Now, we’re being told(?) that if we pass this referendum, we’re going to do what we should have been doing but said we couldn’t do for the past decade. It would have made sense all these past years to make an honest determination of effectiveness before making cuts or adding programs.
Were the MMSD administrative staff lying to me when they said such an approach was not feasible? Did the MMSD staff get smarter at doing their jobs? Is Nerad being played by MMSD staff as part of this new thrust to pass the proposed referendum? Are the funds from the referendum going to be mostly used for the long term task of collecting the data to perform the effectiveness analysis, shifting the funds again from direct education of kids to supporting additional staff downtown. Or did Nerad find that there really is data and a process that could be used to determine program effectiveness, and find that the MMSD staff are really willing and able to do what they should have been doing all along.
I don’t know the answers to your questions Larry. It sounds like you have put much more effort into looking at the budget than most people. Maybe you are correct and the data doesn’t exist but perhaps there are other ways to evaluate programs. Just a guess on my part.
It is my understanding that money from the referendum will be used to maintain classroom teaching. It will allow the board to focus on changing the way the district does things, rather than on what programs to cut if the referendum fails.
I think we have a diverse school board whose members have a common goal and who seem to be working well together. By passing a referendum, we will allow them and the administration to spend time looking at each program in a methodical way. I think there will be a lot of opportunities for public input if the referendum passes. If it doesn’t pass, the result may be less input from the public and some poor choices being made.
I would not be supporting the referendum if I thought there was a lot of wasteful spending going on. What I see in my children’s classrooms is that the science textbooks are older than my kids. There are kids who need special attention, both TAG and Special needs who are getting nothing. There are heating systems that are very inefficient because they are 40 years old or more. I remember working at Glendale school during an election. There were buckets in the halls to catch the water from the then leaking roof. The kids are already suffering and I think we need to stop blaming the administration and board and give them the time to try and figure out what needs to be done.
Substantive program reviews would certainly provide a method, should it be used, to evaluate local school spending. Thinking a bit about Laura’s points: facilities, special education, TAG, curriculum and recent MMSD referendums, consider:
Rather than funding two new far west side elementary schools (Chavez & Olson), might we have spent the roughly $40M on current buildings and programs that the community deems essential?
Enrollment is essentially flat, but this approach would have required boundary changes, which can be a challenge. Perhaps we are at the point where it is “easier” to fund bricks and mortar than deal with some of these other and to my mind more important issues?
While I like the idea of supporting the schools we have before building new ones, I think there were good reasons for Chavez and Olson to be built. And as you know, even when enrollment is flat, costs go up due to inflation, wage and benefit increases, higher energy and related materials costs, and unfunded state and federal mandates which seem to increase every year.
I think what you are getting at, and correct me if I am wrong, is that somewhere, money is being used by the administration and board for pet projects that don’t always pan out. That could very well be true. A case in point may be the new report cards for elementary and middle schools. I may be the only parent in district who thinks that this new way of grading may take more teacher time than it is worth, however. So, I think we need to let the new superintendent take a look at this initiative and other programs. I’m willing to pay the extra $30 a year to give him the time he needs to do that.
Building is a problem only if you fail to honestly inform people what is likely to happen. My objection to building of the two new elementaries was the failure to incorporate a school consolidation/closing component, or to specify which programs would be cut. It’s simple budgeting: you can’t build and open new schools under conditions of stable enrollment unless you are willing to close schools or cut programs at all schools. Of course to put reality on the ballot might make some people hesitate in their reflexive support for a school administration willing to sell us nonsense rather than to be open and honest. Let’s hope that changes with the new administration. But I’m not holding my breath. Their excessive salary increases requires people to be kept in the dark.
I appreciate your perspective but I don’t like to see schools close.
As we saw when the district tried to consolidate Lapham and Marquette, and O’Keeffe and Sherman, or close Lindberg, these options are not popular. Maybe people are willing to pay for schools that are defined by the district as less than full based on square feet per student (it seems to me they keep changing the desired magic number of square feet per student but I could be mistaken).
As an aside, Lapham-Marquette and O’Keeffe have actually increased by 20-30 kids per year over the last two years. This was not the prediction by the district.
I also wonder if we don’t need more room in schools because we have so many different programs. For example, some schools have things like physical theorapy rooms and sensory rooms that might be required under the Americans with Disabilities Act. SAGE also takes extra room. Also, rooms are needed for reading specialists. I won’t talk about computer space as I know that is a hot button issue on this site.
Finally I refer you to the Madison Advocates for Public schools website. There is a really nice summary of how taxes for schools specifically have decreased in Madison.
Here is the link:
http://madisonamps.org/2008/09/10/madison-mill-rates-and-assessments-from-peter-gascoyne/