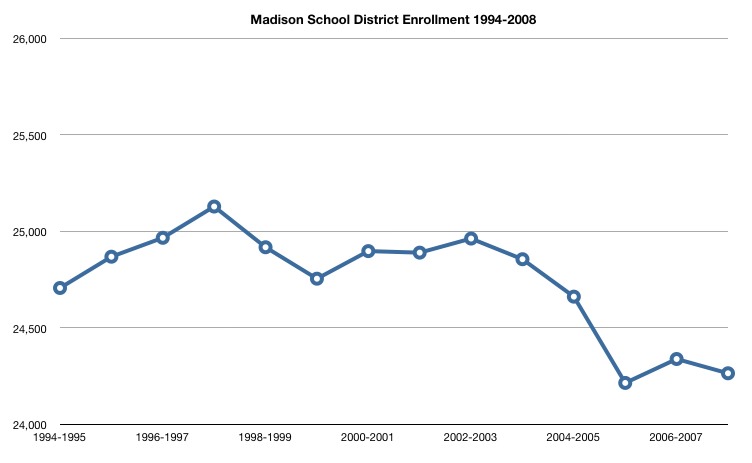
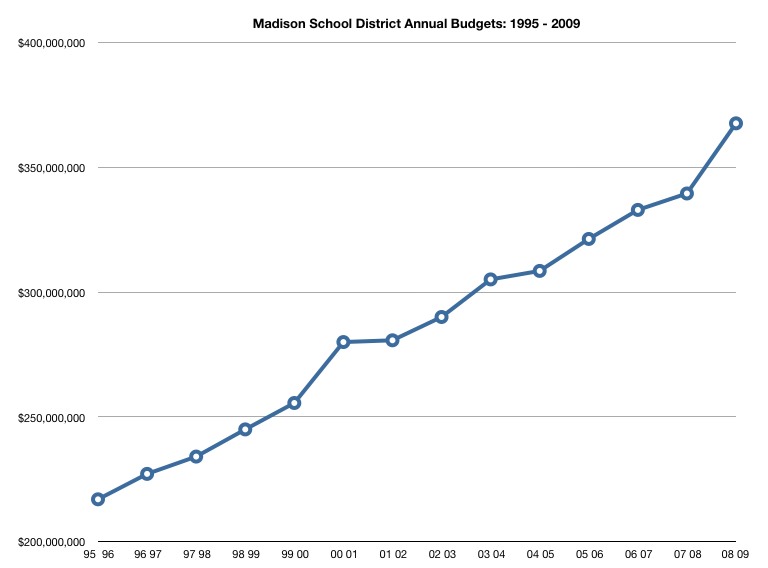
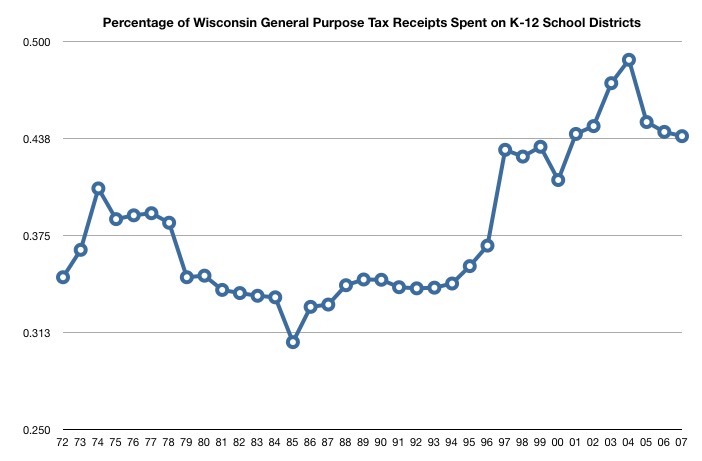
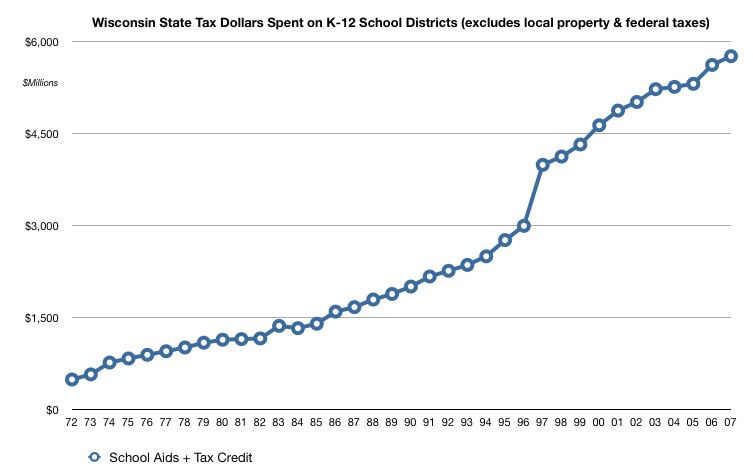
Referendum Climate: Charts - Enrollment; Local, State, Federal and Global Education Spending
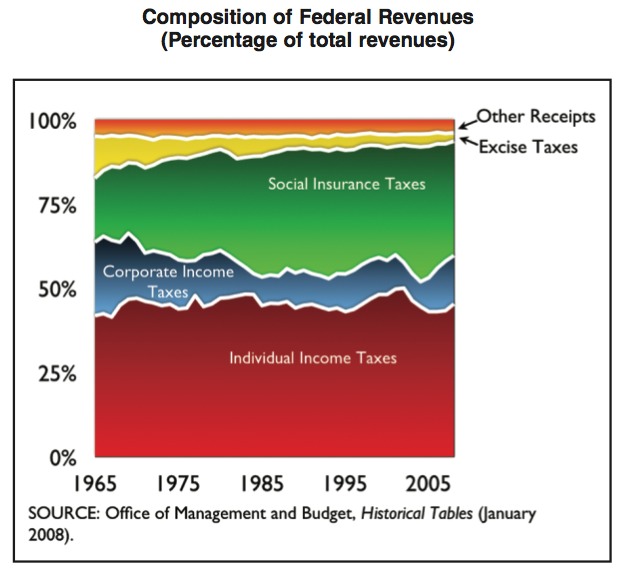
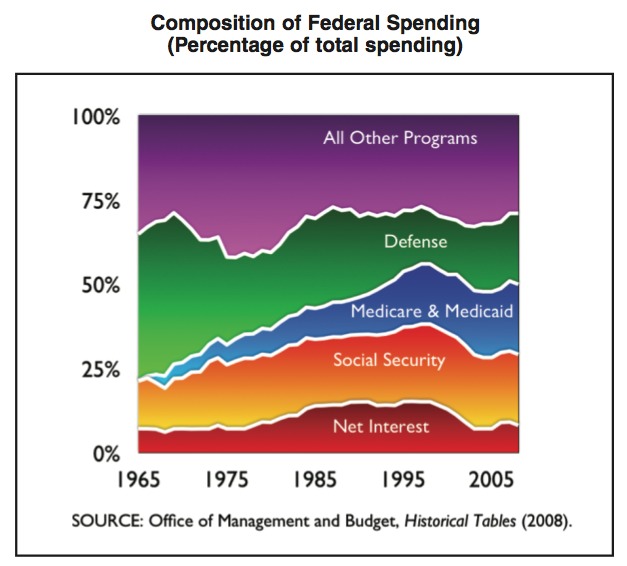
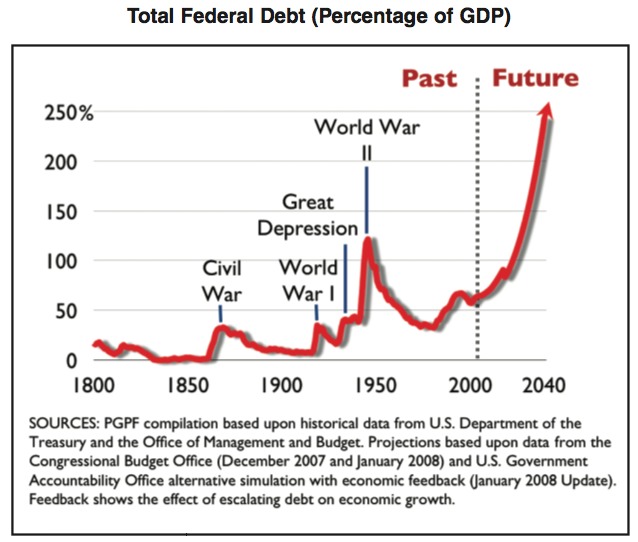
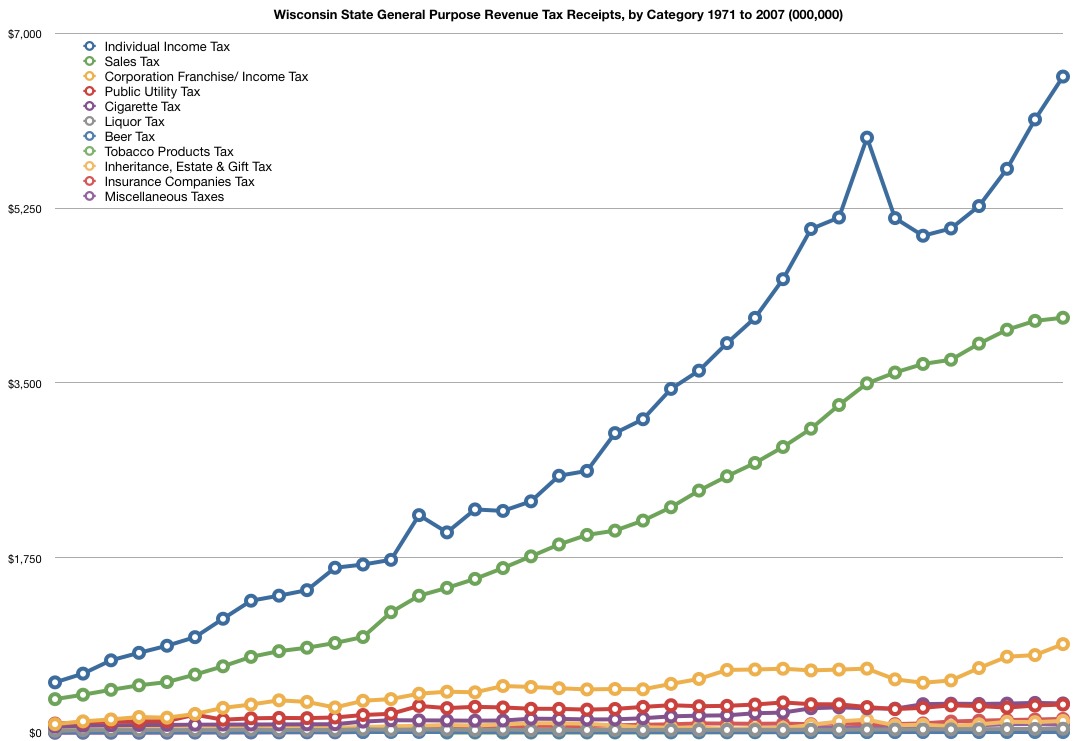
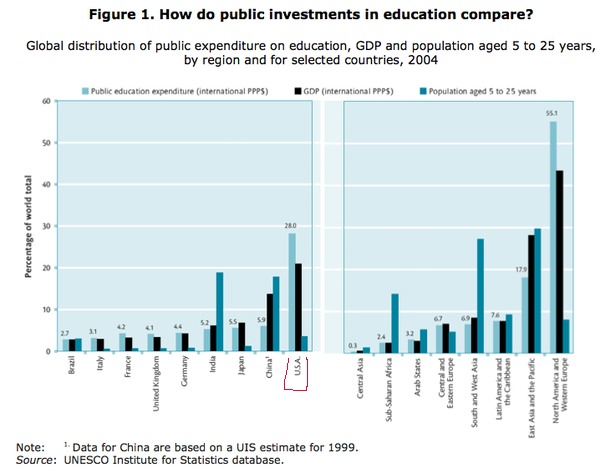
Variations of this question are often asked: "Are we spending too much, too little or just the right amount on education?" I thought it might be useful to have a look at some local, state, federal and global information. Click to view the charts in detail:
Data via the
Madison School District (various budget documents and statistics),
The Wisconsin Taxpayers Alliance,
I.O.U.S.A: One Nation, Under Stress, in Debt and the
UNESCO Institute for Statistics Database.
US Bureau of Labor Statistics: Consumer Price Index. $1000 in 1995 requires $1443.33 according to their inflation calculator, while $1000 in 1972 requires $5,262.30 in 2008.
November Madison School District Planned November, 2008 Referendum notes & links. Tax climate notes & links: When is a Tax Cut Really a Tax Hike by Gene Epstein, 20 Reasons to Kill Corporate Taxes by James Pethokoukis, I.O.U.S.A the Movie, the Economist: Inflation's Last Hurrah and Dave Blaska on the proposed referendum.
Posted by Jim Zellmer at August 25, 2008 6:30 AM
Subscribe to this site via RSS/Atom:  Newsletter signup | Send us your ideas