2006 MMSD WKCE Scores: A Closer Look
Test scores from the November 2006 Wisconsin Knowledge and Concepts Examination (WKCE) and companion Wisconsin Alternate Assessment (WAA) were released by the state Department of Public Instruction this week. The MMSD press release on Madison students’ scores (“Despite changes and cuts, Madison students test well”) reports the following “notable achievements”:
- that reading scores have remained steady and math scores have gone up;
- that non-low income MMSD students score better than their non-low income peers statewide;
- that a higher percentage of MMSD African-American students perform at the highest proficiency level than do other African-American students across the state as a whole; and
- that a consistently higher percentage of MMSD students perform at the highest proficiency level than do students across the state as a whole.
Let’s take a closer look at the PR and the data:
1: “Reading scores have remained steady and math scores have gone up.”
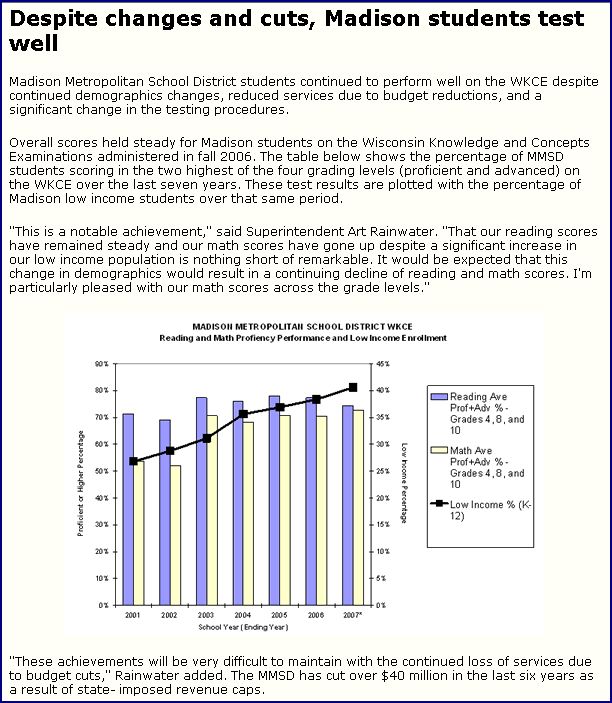
[boxed text and charts excerpted from MMSD press release]
This chart is misleading. In 2002, the Wisconsin Department of Public Instruction revamped the scoring scale for the WKCE to lower the cut score (or threshold) for the “proficient” category (which is apparent in the jump between pre-2002 and post-2002 scores, as shown above). The DPI web site clearly states that “Proficiency data for November 2002 and later are not comparable to earlier years.”
To provide an accurate basis for comparison, the chart should have looked like this:
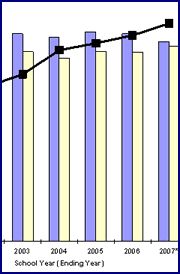
The corrected chart shows that the percentage of MMSD students scoring at the advanced+proficient levels in reading declined from 2003 to 2006, and that the increase in the percentage of MMSD students scoring at the advanced+proficient level in math increased only slightly from 2003 to 2006. Although numeric percentages aren’t specified, it’s apparent that the percentage decline in reading exceeded the percentage increase in math. (So, if reading proficiency levels are being described as having remained “steady” because the decline wasn’t statistically significant, the minimal change in math proficiency levels can’t be touted as a noteworthy increase.)
2: “Non-low income MMSD students score better than their non-low income peers statewide.”
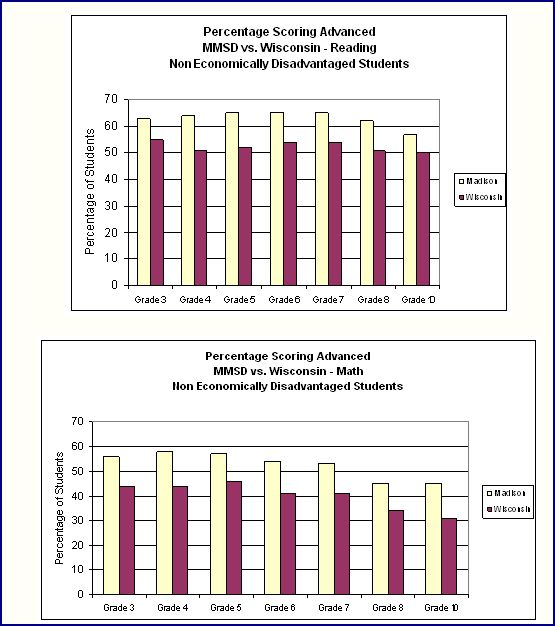
There’s no question about the data here. But what about the rest of the picture?
In reading and math, a greater percentage of MMSD low-income students scored at the basic+minimal levels (i.e. below grade level) than their peers statewide this year (scores below are for combined grades).
| MMSD | State | |
| Reading | 43.3% | 32.7% |
| Math | 49.2% | 43.0% |
Table 1: 2006 low-income, basic+minimal, combined grades
(This and all data are from the DPI web site, using WKCE+WAA scores.)
Looking at 4th grade scores, the percentages of low-income MMSD students performing below grade level in reading and math grew from 2003 to 2006, and grew at a faster rate than statewide peers.
| MMSD | State | |
| 2003 | 33.1% | 29.6% |
| 2006 | 43.2% | 31.8% |
Table 2: 2003 and 2006 reading, low-income, basic+minimal, 4th grade
| MMSD | State | |
| 2003 | 47.5% | 41.4% |
| 2006 | 48.7% | 38.2% |
Table 3: 2003 and 2006 math, low-income, basic+minimal, 4th grade
Looking at more 4th grade scores, a greater percentage of non-low income MMSD students score at the advanced level in reading and math than low income MMSD students, and this gap between high-performing non-low income and low income MMSD students grew from 2003 to 2006.
| Low income | Non-low income | Gap | |
| 2003 | 19.1% | 56.7% | 37.6% |
| 2006 | 16.8% | 64.5% | 47.7% |
Table 4: 2003 and 2006 reading, advanced, MMSD 4th grade
| Low income | Non-low income | Gap | |
| 2003 | 9.7% | 43.4% | 33.7% |
| 2006 | 15.0% | 57.8% | 42.8% |
Table 5: 2003 and 2006 math, advanced, MMSD 4th grade
This gap between low and non-low income performance at the advanced level exists across the state, but MMSD’s gap grew at a faster rate.
| MMSD | State | |
| 2003 | 37.6% | 27.8% |
| 2006 | 47.7% | 29.2% |
Table 6: 2003 and 2006 reading, advanced, 4th grade, gap between low-income and non-low income
| MMSD | State | |
| 2003 | 33.7% | 21.5% |
| 2006 | 42.8% | 25.3% |
Table 7: 2003 and 2006 math, advanced, 4th grade, gap between low-income and non-low income
3: “A higher percentage of MMSD African American students perform at the highest proficiency level than do other African American students across the state as a whole.”
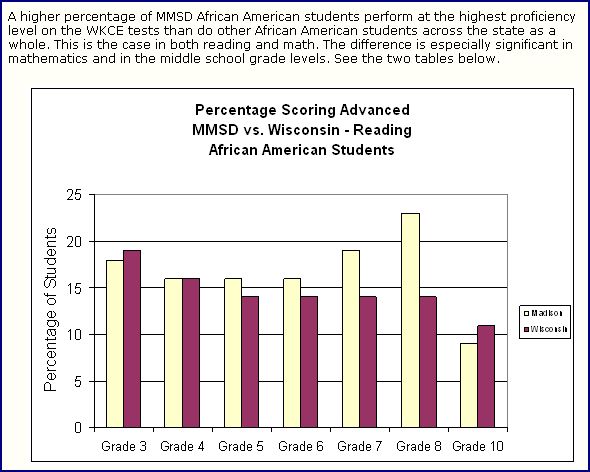
The scale of the percentage range (y-axis) in this chart is magnified in a way that exaggerates this “achievement”. (Even so, it’s clear that grade by grade, black students don’t outperform their state peers in grades 3, 4, or 10.)
| MMSD | State | Difference | |
| Combined grades | 17.1% | 15.0% | 2.1% |
| 4th grade | 16.3% | 16.3% | 0.0% |
Table 8: 2006 reading, advanced, African-American
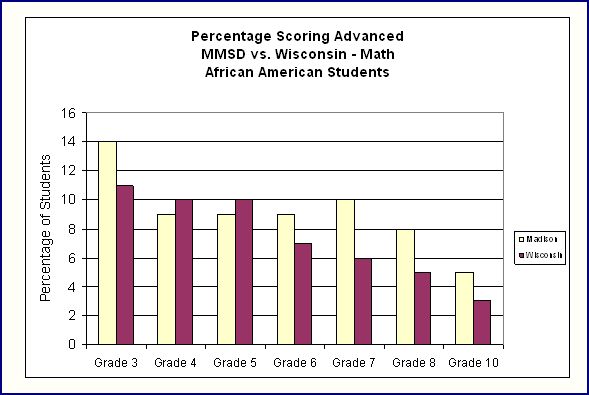
The scale for math is even more exaggerated, and the achievement somewhat less than “especially significant.”
| MMSD | State | Difference | |
| Combined grades | 9.7% | 7.9% | 1.8% |
| 4th grade | 9.0% | 10.5% | -1.5% |
Table 9: 2006 math, advanced, African-American
What is especially significant, however, is the achievement gap between black and white students at the advanced level. MMSD’s achievement gap exceeds that for the state, and has grown at a significantly faster rate.
| MMSD | State | |
| 2003 | 38.1% | 31.7% |
| 2006 | 48.9% | 31.9% |
Table 10: 2003 and 2006 reading, advanced, 4th grade, gap between white and black students
| MMSD | State | |
| 2003 | 36.5% | 24.4% |
| 2006 | 48.6% | 30.3% |
Table 11: 2003 and 2006 math, advanced, 4th grade, gap between white and black students
4: “A consistently higher percentage of MMSD students perform at the highest proficiency level than do students across the state as a whole.”
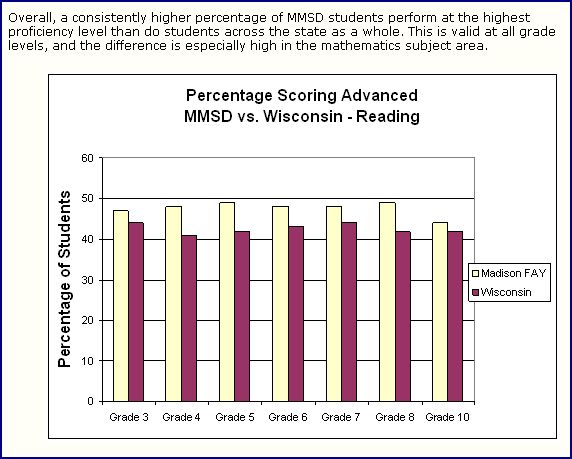
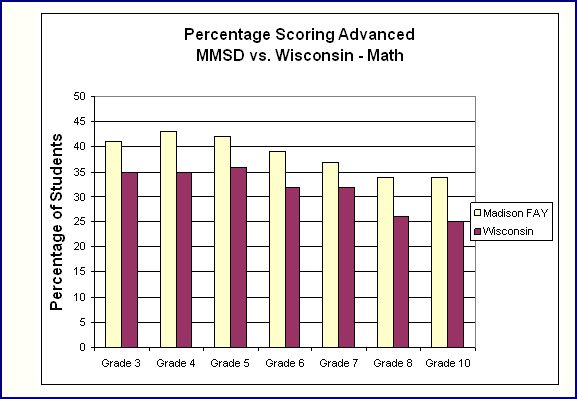
However, MMSD’s racial and economic achievement gaps at the advanced level exceed those for the state.
| MMSD | State | |
| Reading | 46.1% | 34.8% |
| Math | 41.4% | 29.2% |
Table 12: 2006, advanced, combined grades, gap between white and black students
| MMSD | State | |
| Reading | 45.0% | 29.8% |
| Math | 39.7% | 24.5% |
Table 13: 2006, advanced, combined grades, gap between non-low income and low income students
5: “A significant change in testing procedures resulted in a significantly increased percentage of students scoring in the lowest proficiency category.”
Without more data (Exactly how much of the percentage increase in this category was attributable to this testing procedure change? How did this increase compare to other districts and the state as a whole, since they were also affected by this same testing procedure change?), this is not sufficient to explain away the increase in the below-grade level category.
Further thoughts:
- Curriculum Effectiveness: It’s reasonable to assume that students in outperforming categories (white and non-low income) are more likely to have extracurricular educational support and supplementation than other students, and are more likely to be able to overcome curriculum deficiencies they encounter in the MMSD. Any inference that the MMSD deserves all the credit for such students’ achievements is misplaced. On the other hand, the success or failure of students at the bottom of the widening racial and economic achievement gaps (and who are likely to lack those extracurricular advantages) is highly dependent on the effectiveness of MMSD’s curriculum and instructional choices. For example, we might look at the schools that would have qualified for the Reading First funding that was rejected by the MMSD in 2004, and the percentages of students in 4th grade that are reading below grade level:
2003 2006 Increase Orchard Ridge 18.4% 28.6% 10.2% Hawthorne 30.6% 30.6% 0.0%% Glendale 20.6% 47.4% 27.4% Lincoln 25.0% 50.0% 25.0% MMSD 18.4% 22.7% 4.3% State 17.4% 18.1% 0.7% Table 14: Reading, basic+minimal, 4th grade
- Rigor of WKCE: NAEP scores for 2007 (when they’re released) should be compared against WKCE scores as a reality check on whether WKCE testing and standards are consistent or are softening.
- Hidden achievement gap: The WKCE scores in the “proficient” category should be examined on a disaggregated basis. If historically underperforming groups are clustered at the lower end of the category (yet are still being identified as “proficient” due to the lowering of the cut scores when the category standards were redefined in 2002), this is an achievement gap too, and shouldn’t be ignored.
Chan,
You did a terrific job in your analysis of the scores, but it was a waste of your time and energy. The administration and board members simply do not care about the scores. They’re enthusiastically content with the curriculum offered by the MMSD.
Nice job with the analysis.
Lawrie is now chair of the Performance and Achievement committee. I think she is likely to be substantially more dogged in pursuing data than prior board members.
One other thing to consider in this analysis is also the testing of special ed students. With the advent of NCLB, most special ed students are tested as well, when in the past many of those students were exempted from testing. If you can disaggregate the data for special ed as well, I would venture a guess that many of those students would fall in the basic/minimal categories. The requirement to test virually all kids does have some influence on lowering scores.
I agree with Larry that Lawrie will be much more pro-active than past board members on Performance and Achievement issues. She did a great job on the Finance committee last year, uncovering budget practices that no previous board member had ever questioned. She’s likely to do the same for performance and achievement.
Jill’s point is a good one. One of the problems with tracking trends over the past few years is that there have been so many changes. The test itself has changed. The time of year the test is given has changed. Special Education students are included in much larger numbers. And, just this last year, there was a change in policy about the inclusion of english language learners. Last year students who were below an language proficiency level “3” were assessed in an alternative way. This year, all english language learners had to take the WKCE. Given all of that, while I find it helpful to compare individual student performance from year to year, I am hesitant to accept group changes or trends (in either direction) at face value.
The most recent change made to WKCE test itself was for the 2005-2006 assessment. At that time, WKCE was changed from a “norm referenced” test to a “criterion referenced” test.
In theory, a criterion referenced test measures a student’s performance against an objective standard — in the WKCE case — against state academic standards. A norm-referenced test measures a student’s performance against other students.
Again, in theory, a norm-referenced test is made up of questions that distribute students’ scores along a bell curve (normal probability distribution). By construction, this means that 1/2 of all kids will score below average, and 1/2 will score above average, and 68% of all student scores will fall within one standard deviation from the average. The ACT/SAT tests are norm-referenced tests (and they are typically renormed every five years).
In theory, criteron-referenced tests don’t compare students with one another but against what students must, and should know in the Nth grade. The cut scores are supposed to tell you that.
Due to the change from norm-referenced to criterion-referenced, the WKCE tests were changed and so were the cut scores. For example, for 4th grade reading, here are the changes
2002-2005
Minimal: 591 and below
Basic: 592-620
Proficient: 621-657
Advanced: 657 and above
2005-Present
Minimal: 280-395
Basic: 396-439
Proficient: 440-488
Advanced: 489 and above
Notice also that the criterion-referenced WKCE now contains five categories of assessment, whereas the norm-referenced version had four. It is now possible to score BELOW minimal under the 2005-6 and 2006-7 tests.
In understanding of the significance of these scores, I would like to know more.
First, Wisconsin standards are vague and a laundry list of what kids ought to know, so the test makers had to make them more specific to actually write the test — the standards had to be interpreted. Because the standards are so vague, each school/district/teacher had to develop their own interpretation of the standards in order to know what to teach. Districts and schools and teachers then likely are at variance with the test in what they taught and the emphasis given to each.
Second, the test cannot assess every suggested item in the standards or even every standard. There is a limit of test time, limit of a student’s ability to sit for tests, a limit to the number of questions that can be asked, and limit to the number of questions that can be asked on a given standard (you need more than one question to create any confidence that your measuring something reliably). So, it would be useful to know what parts of the standards are actually being measured.
Then, implict in all this, is the question, “Of the list of standards, what critical knowledge must the student acquire, what knowledge is important but not critical, what knowledge is of lesser importance, and what knowledge would be nice to know if you have time to teach and learn it?” In this list, what is the WKCE testing?; how and what did they decide was critical, important, lesser, nice to know?; of the critical, important, lesser, nice to know, what did they not test?
Another point. Testing is simply not that accurate, even if we know what it’s (trying) to measure. Validity and reliability are the issues. Academic testing is simply not in the same league as the tests of your cholesterol level!
WKCE is being judged as a high stakes test that is subject to much political debate and comparison to NAEP, TIMSS, SAT/ACT, etc scores (all of which are subject to the same issues as I mentioned above for WKCE). So with high stakes testing, schools and curricula are being judged in the public arena only by the results of these high stakes tests. These tests determine AYP, funding, school takeovers, federal and state pressure, change in laws, teacher qualification and salaries, etc.
So to the extent that these pressures exist, what critical, important, lesser important, nice to know knowledge is not being taught to students or funded because schools, districts, and teachers are being forced to “teach to the test”, which as I hope you now understand, does not and cannot measure all that knowledge which is required at any grade to be considered an educated Nth grader?
Teaching to the test has already forced the following changes and proposed changes:
1) additional math and science requirements;
2) emphasis on computer literacy and calculators;
3) discussion of year-around schools;
4) cuts in art and music;
5) cuts in foreign language;
6) cuts in physical education;
7) cuts in library resources (don’t need librarians — just google it);
8) massive amount of funds going to testing instead of education;
9) national standards (tests);
10) massive amount of funds going to educational research (most of which is garbage);
11) school uniforms;
12) same-sex schools;
13) using statistics, formulae and numbers to lie about progress or lack thereof;
14) battles among public, charter, private school advocates, as though the business structure of a school has any bearing on educational quality;
I’m all in favor of assessments for student progress, but we have to know what assessments measure; what they don’t and can’t; what is important to know, though it can’t be measured; and the deleterious effects that all this is having on the general fabric of our society.
Thanks for putting all the analysis into perspective Larry. Maybe the district and board are looking at report cards, teacher experience and reasons kids drop out of school (among other measures) than in-depth analysis of standardized test scores. I would be surprised if a long term (or even short term) study of grades/graduation rate vs. performance on WKCE has ever been done. I agree with Larry. We need to know more about the tests before encouraging the BOE to make curriculum changes based on them.
To examine Wisconsin Standards, go to
http://dpi.wi.gov/standards/
The Model Academic Standards try to provide teachers with more information about what the standard means. Although not necessarily measurable, it indicates what the folks who design the WKCE may think is “critical” to determine students performance toward the standard.