| School Information System |
|
|
 | Newsletter signup | Send us your ideas
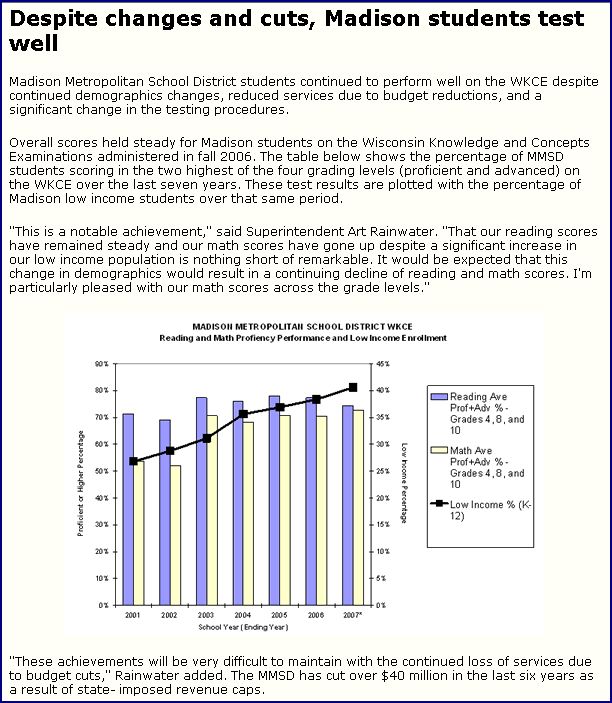
May 25, 20072006 MMSD WKCE Scores: A Closer LookTest scores from the November 2006 Wisconsin Knowledge and Concepts Examination (WKCE) and companion Wisconsin Alternate Assessment (WAA) were released by the state Department of Public Instruction this week. The MMSD press release on Madison students' scores ("Despite changes and cuts, Madison students test well") reports the following "notable achievements":
1: "Reading scores have remained steady and math scores have gone up."
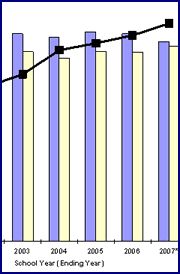
This chart is misleading. In 2002, the Wisconsin Department of Public Instruction revamped the scoring scale for the WKCE to lower the cut score (or threshold) for the "proficient" category (which is apparent in the jump between pre-2002 and post-2002 scores, as shown above). The DPI web site clearly states that "Proficiency data for November 2002 and later are not comparable to earlier years." To provide an accurate basis for comparison, the chart should have looked like this:
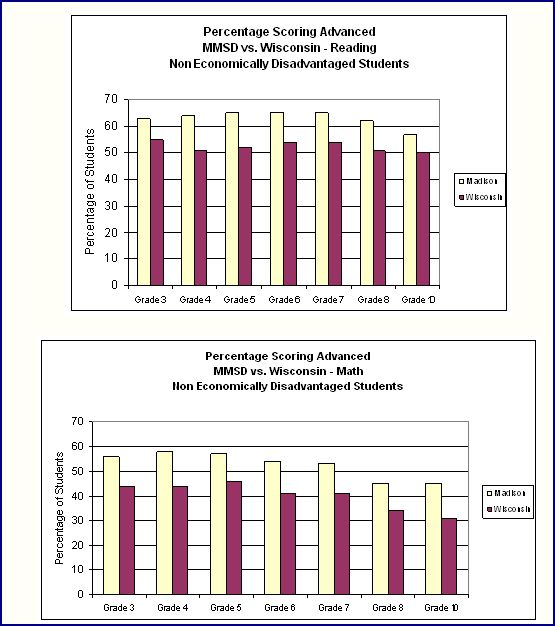
The corrected chart shows that the percentage of MMSD students scoring at the advanced+proficient levels in reading declined from 2003 to 2006, and that the increase in the percentage of MMSD students scoring at the advanced+proficient level in math increased only slightly from 2003 to 2006. Although numeric percentages aren't specified, it's apparent that the percentage decline in reading exceeded the percentage increase in math. (So, if reading proficiency levels are being described as having remained "steady" because the decline wasn't statistically significant, the minimal change in math proficiency levels can't be touted as a noteworthy increase.) 2: "Non-low income MMSD students score better than their non-low income peers statewide."
There's no question about the data here. But what about the rest of the picture? In reading and math, a greater percentage of MMSD low-income students scored at the basic+minimal levels (i.e. below grade level) than their peers statewide this year (scores below are for combined grades).
(This and all data are from the DPI web site, using WKCE+WAA scores.) Looking at 4th grade scores, the percentages of low-income MMSD students performing below grade level in reading and math grew from 2003 to 2006, and grew at a faster rate than statewide peers.
Looking at more 4th grade scores, a greater percentage of non-low income MMSD students score at the advanced level in reading and math than low income MMSD students, and this gap between high-performing non-low income and low income MMSD students grew from 2003 to 2006.
This gap between low and non-low income performance at the advanced level exists across the state, but MMSD's gap grew at a faster rate.
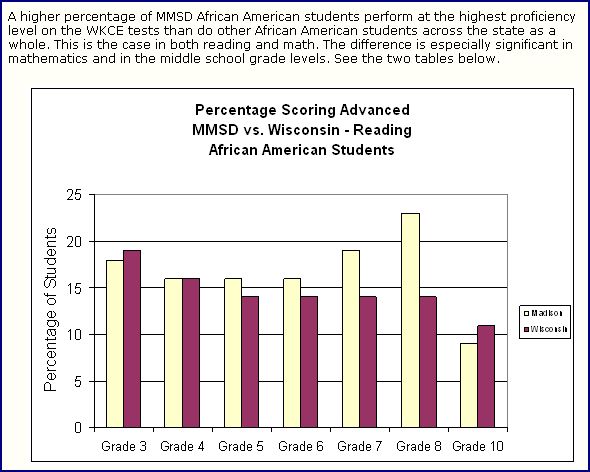
3: "A higher percentage of MMSD African American students perform at the highest proficiency level than do other African American students across the state as a whole."
The scale of the percentage range (y-axis) in this chart is magnified in a way that exaggerates this "achievement". (Even so, it's clear that grade by grade, black students don't outperform their state peers in grades 3, 4, or 10.)
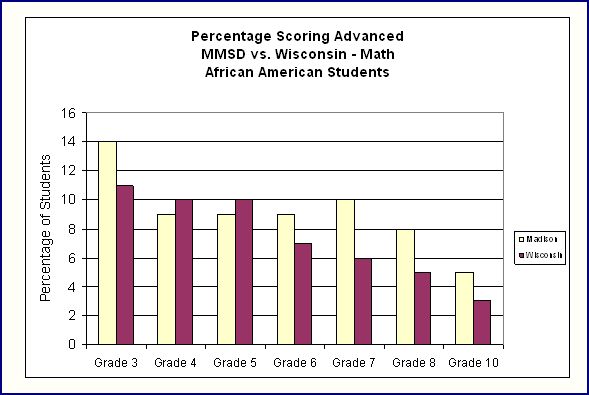
The scale for math is even more exaggerated, and the achievement somewhat less than "especially significant."
What is especially significant, however, is the achievement gap between black and white students at the advanced level. MMSD's achievement gap exceeds that for the state, and has grown at a significantly faster rate.
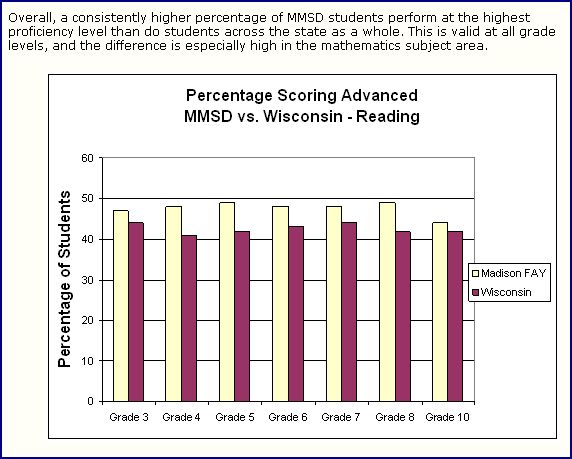
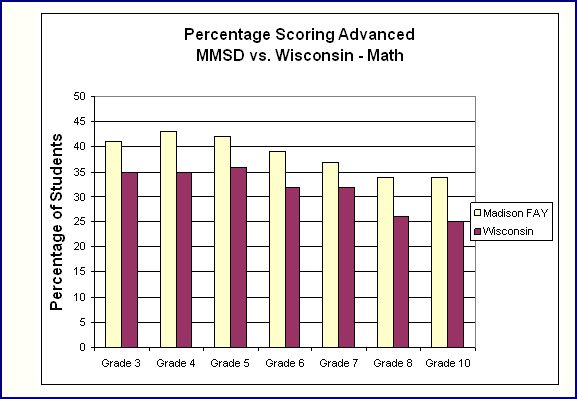
4: "A consistently higher percentage of MMSD students perform at the highest proficiency level than do students across the state as a whole."
However, MMSD's racial and economic achievement gaps at the advanced level exceed those for the state.
5: "A significant change in testing procedures resulted in a significantly increased percentage of students scoring in the lowest proficiency category."
Without more data (Exactly how much of the percentage increase in this category was attributable to this testing procedure change? How did this increase compare to other districts and the state as a whole, since they were also affected by this same testing procedure change?), this is not sufficient to explain away the increase in the below-grade level category. Further thoughts:
Subscribe to this site via RSS/Atom: Newsletter signup | Send us your ideas
|