Search Results for: Wistax k-12 tax
K-12 Tax & Spending Climate: For First Time in Modern Era, Living With Parents Edges Out Other Living Arrangements for 18- to 34-Year-Olds
Richard Fry: Broad demographic shifts in marital status, educational attainment and employment have transformed the way young adults in the U.S. are living, and a new Pew Research Center analysis of census data highlights the implications of these changes for the most basic element of their lives – where they call home. In 2014, for […]
New state budget raises taxes while borrowing $325,000,000
Tulsa Beacon: Higher education will be cut by 7.66 percent. The Oklahoma Health Care Authority (the state Medicaid provider) will get a 9.24 percent increase. The Oklahoma Department of Mental Health and Substance Abuse Services will get a 2.18 percent increase. Government (redistributed tax dollars) health care spending growth has long crowded out other expenditures. […]
Commentary On Wisconsin’s K-12 Tax & Spending Climate
WPR: Speaking on Wisconsin Public Radio’s “The Kathleen Dunn Show,” Brookfield Republican Rep. Dale Kooyenga downplayed those complaints, drawing a comparison to his experience serving in the U.S. Army. “You know, before I got into politics, I was in Baghdad, and I was there in 2008 when things were not going well. And you want […]
Commentary On Wisconsin’s K-12 Tax & Spending Climate
Todd Milewski: “There should be some room for inflationary increases, and our schools have been really constrained for several biennia now. So zero is not a win. Certainly, it’s better than what it was but, frankly, nothing has changed over the last six months so maybe the budget should have been put in place as […]
Property Tax Season: Comparing Madison Area Burdens in light of quarterly payments
The arrival of Thanksgiving means local homeowners will soon see their annual property tax bills. The chart below compares Madison area homes sold in 2012, ranging in price from $239,900 to $255,000 Tap to view a larger version. Excel. A Middleton home’s property tax burden is about 13% less than a similar property in Madison […]
Redux: Up, Down & Transparency: Madison Schools Received $11.8M more in State Tax Dollars last year, Local District Forecasts a Possible Reduction of $8.7M this Year; taxes up 9% a few years ago
Madison’s aid amount is about the same as it was in 2010-11. The district received a $15 million boost in aid last year mostly because 4-year-old kindergarten enrollment added about 2,000 students.
The Madison School Board taxed the maximum amount allowed last year, resulting in a 1.75 percent property tax increase. That amount was low compared to previous years because of the state aid increase. The additional funds allowed the district to spend more on building maintenance and a plan to raise low-income and minority student achievement.
Property tax increase coming
Cheatham said she hopes to propose a lower property tax increase than 6.8 percent when she introduces her budget on July 15. A group of local and national experts recently advised the district that it should reallocate more funding from the administration into classrooms. Cheatham expects to do a deeper review of district finances for the 2014-15 budget.
“I would not be reluctant to ask the taxpayers of Madison to support us with additional funding moving forward if I knew that we were spending every dollar in the best possible way to support the students in our school district,” Cheatham said. “I’ll know that next budget cycle.”
To reduce the budget, Cheatham said she doesn’t expect any major changes that will affect classroom learning.
Instead she could cut a 1.5 percent proposed increase in the employee salary schedule, reduce maintenance spending or make some previously recommended reductions in administrative positions.Much more in the 2013-2014 budget, here.
Related: Up, Down & Transparency: Madison Schools Received $11.8M more in State Tax Dollars last year, Local District Forecasts a Possible Reduction of $8.7M this Year.
Madison spends significantly more per student than most districts. Property taxes were increased 9% just a few years ago.
Finally the ongoing tax increases may play a role in Madison School Board member Mary Burke’s rumored race for Governor
Wisconsin K-12 Tax Spending Dominates Local Transfers
Click or tap for a larger version
Via Wistax.org Read more, here.
Related: WEAC: $1.57 million for Four Wisconsin Senators.
Wisconsin State Tax Based K-12 Spending Growth Far Exceeds University Funding.

K-12 Tax & Spending Climate: Dane County property taxes highest in state, taxpayer group reports
Seventeen of Wisconsin’s 72 counties reduced property tax levies. Dane County was one of five that increased them by more than 3 percent.
Median property taxes in Dane County have increased 32.8 percent in the last 10 years. Home values have grown at a similar rate — the median Dane County home is worth $230,800, an increase of 38.6 percent in the last decade.WISTAX 2011-2012 Property Tax Report.
Madison School District 2012-2013 Budget Update; Reduced3.47% Property Tax Increase due to Increased State Tax Dollar Spending.
K-12 Tax & Spending Climate: Our Share of Fannie Mae & Freddie Mac Losses: $1,300 Per Household
Fannie Mae said Wednesday it lost $2.4 billion during the fourth quarter of 2011 and $16.9 billion for the full year.
It has had worse years, remarkably. Fannie lost about $60 billion in 2008 and $72 billion the following year-two of the 10 largest corporate losses ever. Sibling Freddie Mac is responsible for a third, a $51 billion loss in 2008.
Fannie Mae was established in 1938 to promote home ownership by making federal funds available to lenders. In the 1950s and 1960s, it transformed into a profit-seeking corporation, with the goal of purchasing mortgages and selling them to investors, thereby replenishing funds to banks for fresh loans. Freddie Mac was created in 1970 to spur competition.Related:, via WISTAX:
Purchase the newsletter, which includes a discussion of the Wisconsin state budget, here.

K-12 Tax & Spending Climate: It’s Worse Than You Think
Regular readers know that state finances were worse than the Doyle administration admitted during its eight years of fiscal incompetence. But state finances are also worse than the Walker administration admits now.
The proof is the state’s Comprehensive Annual Fiscal Report, an inch-thick annual tree-killer that summarizes the differences between politicians’ claims about the state’s fiscal health, and the reality of the state’s fiscal health.
The differences lie in correctly measuring state finances, as the Wisconsin Taxpayers Alliance explains:A recent WISTAX publication mentioned that Wisconsin Medicaid spending increased 87% from 2006 to 2011!
On Wisconsin’s K-12 Tax & Spending Climate
Both the Associated Press (AP) and the Department of Public Instruction (DPI) today highlight the relationship between reductions in school aids across the state and the way school choice and charter programs are funded. The AP story notes “$110 million [was] taken from public schools to pay for an expansion of voucher and charter schools in Milwaukee and Racine.” Unfortunately the story fails to mention that the statewide aid reductions to pay for the charter program and the aid reductions in Milwaukee and Racine to pay for choice do not translate into less funding for school districts.
Why? Neither the charter nor choice aid reductions impact revenue limits. Districts can and do make up for the reduction with property taxes. In English, this means the Milwaukee Public Schools, Racine Unified, and the majority of school districts in the state that set their education levy at the highest permitted amount do not lose actual dollars because of these programs, they simply receive them from a different source.
School spending in Wisconsin, traditionally among the nation’s highest, was falling even before changes in the current state budget and may already be no more than the U.S. average.
The conservative-leaning Wisconsin Taxpayers Alliance reported last week that, while operational spending per pupil remained 5.5 percent above the national average in 2009, when debt and maintenance are figured in, overall spending was 1.6 percent below the U.S. average.
WISTAX estimated that, had the new state revenue limits been in place for 2009, instructional spending also would have been reduced to near the national average.
WISTAX researchers compared 2009 U.S. census data on school spending and revenues by state and also looked ahead to how recent state law and budget changes might affect Wisconsin’s ranking. (A PDF of the analysis accompanies this story.)Related: Wisconsin State Tax Based K-12 Spending Growth Far Exceeds University Funding
RSS Local Schools Madison schools losing $6.7 million in Redistributed State Tax Dollars
The Madison School District will lose $6.7 million in state aid next year — $2 million more than it anticipated — according to estimates released Friday by the Department of Public Instruction.
The 13.5 percent cut is third-highest in the state among K-12 districts and higher than the 10 percent cut the School Board used to calculate its preliminary budget last week.
The $43.2 million in aid is also nearly one-third less than the $60.8 million the district received from the state four years ago.
Superintendent Dan Nerad said continuous cuts in state aid are hurting the quality of public education.
“School districts like ours cannot continue to be in an environment like this with increased expectations for student performance, and yet we’re not willing to provide the resources,” Nerad said.Related: 1983-2007 Wisconsin K-12 Spending Growth via WISTAX:
Democrats Want to Direct Additional Wisconsin Taxes to K-12 Spending
Assembly Democrats today proposed using more than half of the new money in last week’s bolstered revenue projections to increase K-12 funding in the state budget, charging that Republicans have failed to distinguish between priorities that can wait and those that cannot.
“We are actually fighting for the very future of public education,” Rep. Fred Clark, D-Baraboo, said at a press conference outside the Capitol this morning. Clark is running against GOP Sen. Luther Olsen in a potential recall election.
Dems proposed directing $356 million more toward school aids in the budget after LFB projections added $636 million to state coffers over the next biennium last week. Their proposal would also reserve $200 million of that revenue to repay the Patients Compensation Fund, $100 million to pay down some state debt and $20 million to increase aid to technical colleges.
Wisconsin State Tax Based K-12 Spending Growth Far Exceeds University Funding.
Understanding UW Debate: Relative State Support Down, State Regs Remain.
K-12 Tax & Spending Climate: Wisconsin State budget preview leaves unanswered questions
Much of the state’s recurring deficit problems are due to short-term budget decisions made over the past 15 years. But revenue volatility has also played a role. During 1990-2000, annual growth in general purpose tax revenues (GPR) averaged 6.8%, and the average was still higher (7.0%) during 1995-2000. Even after the 2001 recession, state tax collections grew an average of 5.0% per year during 2003-2008. But that was followed by collections dropping 7.1% in 2008-09 and remaining stagnant the following year, despite tax increases.
How the 2011-13 budget ultimately fares depends in part on the revenue outlook. And the new forecast for 2010-13 shows tax revenues growing at annual (bars in graph above) and average (line) rates generally below the recent past. The table below provides forecast detail. Tax revenues are projected to grow 4.2% or less over the next biennium.
Wisconsin Education Superintendent Seeks 2-4% annual increases in redistributed state tax dollars, introduction of a poverty formula and a shift in Property Tax Credits
Many links as the school finance jockeying begins, prior to Governor Scott Walker’s January, 2011 inauguration. Wisconsin’s $3,000,000,000 deficit (and top 10 debt position) makes it unlikely that the K-12 world will see any funding growth.
Matthew DeFourEvers plan relies on a 2 percent increase in school aid funding next year and a 4 percent increase the following year, a tough sell given the state’s $3 billion deficit and the takeover of state government by Republicans, who have pledged budget cuts.
One major change calls for the transfer of about $900 million in property tax credits to general aid, which Evers said would make the system more transparent while having a negligible impact on property taxes. That’s because the state imposes a limit on how much a district can raise its total revenue. An increase in state aid revenue would in most cases be offset by a decrease in the other primary revenue — property taxes.
Thus the switch would mean school districts wouldn’t have such large annual property tax increases compared to counties, cities and other municipalities, even though tax bills would remain virtually the same, said Todd Berry, executive director of the Wisconsin Taxpayers Alliance.
“Distributing the money through the school aid formula, from a pure policy sense, is probably more equitable than distributing it in its current tax credit form,” Berry said. “The money will tend to help districts that tend to be poorer or middle-of-the-road.”Inequities in the current system tend to punish public schools in areas like Madison and Wisconsin’s northern lake districts because they have high property values combined with high poverty and special needs in their school populations. The current system doesn’t account for differences in kids’ needs when it doles out state aid.
Education policy makers as well as politicians on both sides of the aisle have talked school funding reform for over a dozen years but it’s been a tough sell because most plans have created a system of winners and losers, pitting legislator against legislator, district against district.
Evers’ plan, which calls for a 2 percent increase in school aid funding next year and a 4 percent increase the following year, as well as a transfer of about $900 million in property tax credits to general aid, addresses that issue of winners and losers. Over 90 percent of districts are receiving more funding under his proposal. But there aren’t any district losers in Evers’ plan, either, thanks to a provision that requests a tenth of a percent of the total state K-12 schools budget — $7 million — to apply to districts facing a revenue decline.Wisconsin State and Local Debt Rose Faster Than Federal Debt During 1990-2009 Average Annual Increase in State Debt, 7.8%; Local Debt, 7.3%
Rewrite of Wisconsin school aid formula has cost
Wisconsin Department of Public Instruction:
The following printout provides school district level information related to the impact of State Superintendent Evers’ Fair Funding proposal.
Specifically, the attachment to this document shows what each school district is receiving from the state for the following programs: (1) 2010-11 Certified General Aid; (2) 2009-10 School Levy Tax Credit; and (3) 2010-11 High Poverty Aid.
This information is compared to the potential impact of the State Superintendent’s Fair Funding proposal, which is proposed to be effective in 2012-13, as if it had applied to 2010-11.
Specifically, the Fair Funding Proposal contains the following provisions:But the plan also asks for $420 million more over the next two years – a 2% increase in funding from the state for the 2011-’12 school year and 4% more for the following year – making it a tough sell in the Legislature.
State Sen. Alberta Darling (R-River Hills), who will co-chair the powerful Joint Finance Committee, said she considered the proposal pretty much dead on arrival in the state Legislature, which will be under Republican control next year, without further changes.
“I think those goals are very admirable,” said Darling, who has been briefed on the plan. “But, you know, it’s a $6 billion budget just for education alone and we don’t have the new money. I think we have to do better with less. That’s just where we are.”
On Friday, Governor-elect Scott Walker said his office had only recently received the proposal from the DPI and he had not had time to delve into its details or to speak with Evers. He said he hoped to use his budget to introduce proposals that would help school districts to control their costs, such as freeing them from state mandates and allowing school boards to switch their employees to the state health plan.
K-12 Tax & Spending Climate: A Look at Wisconsin Gubernartorial Candidate Positions
Wisconsin’s approach to funding schools relies on a confusing and frequently misunderstood formula under which the state picks up the bulk of costs while capping how much districts can collect in state aid and local property taxes combined.
Districts have complained the caps, which are based largely on the number of students a district has, have not kept pace with expenses. In recent years, the state has reduced its share of aid to schools from two-thirds of total costs to slightly less than that, forcing districts to choose between two unpopular options: Cutting programs and services or raising property taxes.Wisconsin K-12 spending via redistributed taxes has grown substantially over the past 20+ years, as this WISTAX chart illustrates:
More here, via a 2007 look at K-12 tax & spending growth:MMSD is one of the most expensive public school districts in the state (per pupil spending is highest among the largest school districts). It has been for decades. However, the annual rate of increase in per pupil spending has been very close to the Wisconsin average. While per pupil spending for the average Wisconsin public school district has increased at an annual rate of 5.10%, it has increased by an annual rate of 5.25% in MMSD (see table below). That MMSD costs have risen more should be no surprise, because of cost of living, the loss of students to the growing suburbs (subsidized by state taxes), and the relative portion of special education needs and classroom support needs have risen significantly.
The “great recession” has certainly affected many organizations, including public school districts via slower tax collection growth and flat or reduced property values (which further increases taxes, such as the 2010-2011 Madison School District budget, which will raise them by about 10%).
K-12 Tax & Spending Climate: Federal Bailout Spending up to 3,700,000,000,000; A Look at Wisconsin’s Taxes and the British PM Flies Commercial
Increased housing commitments swelled U.S. taxpayers’ total support for the financial system by $700 billion in the past year to around $3.7 trillion, a government watchdog said on Wednesday.
The Special Inspector General for the Troubled Asset Relief Program said the increase was due largely to the government’s pledges to supply capital to Fannie Mae (FNMA.OB) and Freddie Mac (FMCC.OB) and to guarantee more mortgages to the support the housing market.
Increased guarantees for loans backed by the Federal Housing Administration, the Government National Mortgage Association and the Veterans administration increased the government’s commitments by $512.4 billion alone in the year to June 30, according to the report.The Wisconsin Budget Project (“An Initiative of the Wisconsin Council on Children & Families“).
The Wisconsin Budget Project is a WCCF initiative engaged in analysis and education on the state budget and tax issues, particularly those relating to low and moderate income families. The budget project seeks to broaden the debate on budget and tax policy through public education and the encouragement of civic engagement on these issues.
Quick Facts about the Wisconsin Budget:
- Based on the most recent national data (from 2007), Wisconsin ranked 29th in total state and local spending (measured as a percentage of income).
- Contrary to the perception that our state has a large government bureaucracy, Wisconsin ranked 44th (7th lowest) in 2008 in the number of state employees relative to population, and 41st (10th lowest) in total state and local government employees relative to population.
Clusty Search: Wisconsin Budget Project & WISTAX (Wisconsin Taxpayer’s Alliance).
Setting a great example for our political class, British Prime Minister David Cameron flew commercial on a recent trip to the United States. Congressional use of military jets continues to be controversial (to his credit, US Senator Russ Feingold can often be seen flying commercial).
K-12 Tax & Spending Climate: Wisconsin State and Local Debt Rose Faster Than Federal Debt During 1990-2009 Average Annual Increase in State Debt, 7.8%; Local Debt, 7.3%
State and local debt in Wisconsin grew faster than federal debt over the last 19 years. State debt rose 316%, an average of 7.8% per year, from $2.71 billion in 1990 to $11.25 billion in 2009. Local general obligation debt was up 284%, a 7.3% average, from $3.41 billion in 1989 to $13.1 billion in 2008. Federal debt held by the public averaged annual increases of 6.2% per year for a total increase of 212.8% from 1990 through 2009. The figures come from a new study from the Wisconsin Taxpayers Alliance (WISTAX), a nonprofit, nonpartisan public policy research organization dedicated to citizen education.
Governments borrow for many reasons, including buildings, roads, sewers, and environmental cleanup. However, WISTAX researchers found that about 40% of the state increase was due to $1.6 billion of tobacco bonds issued in fiscal 2002 that were funded by a stream of payments from tobacco companies, as well as $1.8 billion in appropriation bonds issued in fiscal 2004 to pay unfunded state pension and sick-leave liabilities. The tobacco bonds were issued to help balance the 2001-03 state budget. The bonds were refinanced in fiscal 2009, generating an additional $300 million that was used to balance the 2008-09 general fund. Originally expected to be paid off in 2018, the refinanced bonds will not be paid off until 2029.
K-12 Tax & Spending Climate: Wisconsin Government Employment Per Capita 8.2% Smaller Than U.S. Average
Wisconsin had 8.2% fewer state and local government employees per capita than the national average in 2008. The state had 50.35 full-time equivalent (FTE) employees for every 1,000 state residents vs. 54.82 for the U.S. and ranked 41st nationally, according to a new study from the Wisconsin Taxpayers Alliance (WISTAX). The study, “Wisconsin’s Public Workforce,” details public employment and pay using 2008 Census figures, the most recent available. WISTAX is a nonprofit, nonpartisan organization dedicated to public policy research and education.
The study also compares public employee salaries and total compensation (salaries plus benefits) at the state and local levels. The average salary for a Wisconsin state employee was $53,703, 4.3% higher than the national average ($51,507). State salaries here were above those in Michigan but below salaries in Minnesota, Iowa, and Illinois. When estimated benefits were added to salaries, total compensation averaged $71,000. That was 5.9% above the national average, but still below Iowa and Minnesota.
K-12 Tax & Spending Climate: Wisconsin’s Budget Deficit Climbs to $2.71Billion
The state of Wisconsin ended its fiscal year last June with a $2.71 billion budget deficit, a new state report shows.
That’s an 8 percent increase over last year’s deficit of $2.5 billion. The report shows the financial challenges ahead for the next state leader who will take over in January 2011 after Gov. Jim Doyle leaves office.
The figures on the shortfall in the state’s main account differ from those in most state reports, which simply figure how much cash the state has. This report, which is prepared according to generally accepted accounting rules, also takes into account spending that the state has promised to make in the future.A week before Christmas, an important report appeared on a Wisconsin government website. There were no press releases from Madison politicians. No headline news stories.
Yet no public official, taxpayer, or citizen can afford to ignore the report’s bottom line: According to its just-released financial statements, state government closed its 2008-09 books with a $2.71 billion deficit in its general fund.
To many readers, this might come as a surprise. By law, state government is supposed to balance its budget. On paper, it does. However, for more than a decade, governors and legislators of both parties have “balanced” budgets through use of accounting maneuvers, timing delays, borrowing, and billions in one-time money.
When the state controller, a CPA, prepares the state’s official financial statements, he must follow generally accepted accounting principles, or GAAP. That means he must reverse the budget gimmicks and accurately represent the state’s true financial condition. When he does this, the budget’s black ink turns red.
Wisconsin School Property Tax Levies Set for 2009-10 Tax Bill, Up 6.0%
School property tax levies for 2009-10 are up 6.0%, from $4.28 billion last year to $4.54 billion this year, according to the Wisconsin Taxpayers Alliance (WISTAX), a nonprofit, nonpartisan research organization. The rise in school taxes exceeded last year’s increase of 5.2%, due principally to state budget cuts in aid to K-12 schools.
According to WISTAX, tax changes ranged from increases of 41.2% in Seneca and 32.8% in Gilmanton to reductions of more than 19% in Ladysmith and Sharon J1. However, increases larger than those in prior years were the norm, and 116 districts (27%) of the state’s 425 districts had increases of 10% or more. In another 151 districts, levies were up between 5% and 10%. Only 42 districts cut property taxes.
“Although state budget reductions and tighter school revenue limits have made the headlines,” noted WISTAX President Todd A. Berry, “the more telling stories are coming from budget details.”
For example, schools raised their general fund levies more than 8%, well above the overall 6% increase. They pared back the overall increases by retiring or refinancing debt and by rearranging expenditures formerly charged to a little-known fund exempt from state revenue limits: fund 80, or the community services fund. This fall, 78 of 425 districts trimmed community service levies that fund such items as community recreation and adult classes; 10 districts eliminated the tax altogether. These actions served to reduce what would otherwise have been an 8.2% tax increase.
K-12 Tax & Spending Climate: Attack high tax burden on Wisconsin homes
Wisconsin State Journal Editorial:
If you own a home or business in Wisconsin, you already know your property taxes are high.
But now it’s official.
So let’s keep the pressure on government at all levels to try to ease the burden.
Wisconsin has the ninth highest property tax in the nation, a nonprofit research group reported this week. The Tax Foundation, based in Washington, D.C., used new Census Bureau data to rank the best and worst real estate tax burdens across the country.
Wisconsin’s median property tax last year was $2,963, compared to the national median of $1,897, the group reported.
When home values are factored in, Wisconsin moves up the list to fourth highest among the 50 states. By this measure, our burden is almost twice as heavy as the national median.Notes and links from former Madison Mayor Paul Soglin along with Paul Caron. WISTAX:
Wisconsin’s two largest taxes, the income tax and property tax, generate more than $15 billion for state and local governments.
In 2008, income tax collections totalled $6.71 billion. At 3.3% of personal income, Wisconsin’s income tax collections ranked 10th highest nationally. On a per capita basis ($1,137), the Badger state was 13th.
Recent income tax law changes reduced the capital gains exclusion from 60% in 2008 to 30% in 2009 and added a fifth tax bracket (7.75%). In 2008, the top tax rate was 6.75%Ted Kolderie urges “dramatic change” in the public sector.
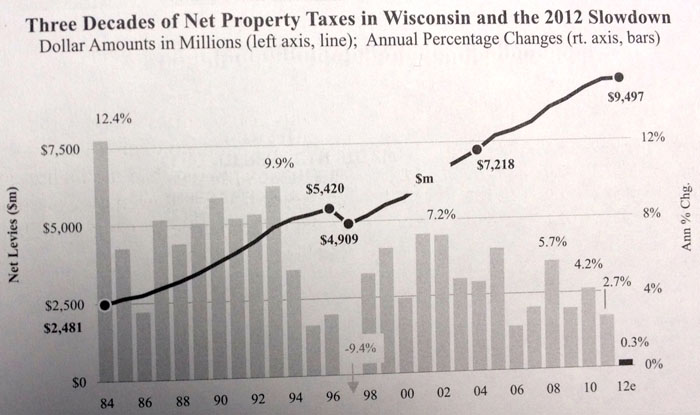
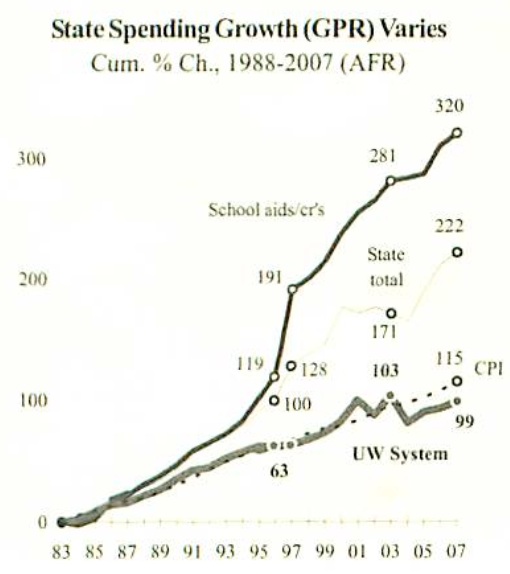
Wisconsin State Tax Based K-12 Spending Growth Far Exceeds University Funding
via WISTAX
WISTAX published a fascinating chart in their most recent issue of FOCUS [Page 1, Page 2]:However, the state pledge to provide two-thirds of schools revenues in 1996-97 changed the budget landscape. By 2006-07, state-tax support for the UW System had almost doubled during Ihe 25 years prior. However, inflation (CPI, up 115%). school aids/credits (320%). and overall slate GPR expenditures (222%) rose more.
Related:
- Referendum Climate: Charts – Enrollment; Local, State, Federal and Global Education Spending
- Property Tax Effect – Madison School District
- K-12 Tax & Spending Climate
- The subject of local property taxes, state and federal income taxes and fees vis a vis school spending was discussed at Madison Superintendent Dan Nerad’s recent appearance at the Dane County Public Affairs Council
Further proof that there is no free lunch. The ongoing calls for additional state redistributed tax dollars for K-12 public education will likely have an effect on other programs, as this information illustrates. I do think that there should be a conversation on spending priorities.
Property taxes jump 3.8%, most in 3 years
The property tax bill on the typical Wisconsin home rose 3.8% last year – the biggest increase in three years, officials said Monday.
But fall levy limits on local governments, more state aid and slowing home values should prevent another boost like that this December, they said.
The Legislative Fiscal Bureau told legislators that property taxes on the median-valued home, which was assessed at $170,305 last year, totaled $2,838 – a $105 increase over the previous year. In each of the previous two years, the increase was less than 1%.
The $105 increase was up by about $10 from what lawmakers and Gov. Jim Doyle expected in October when they adopted the current state budget.
But the 3.8% increase was more than the inflation rate last year, which the U.S. Bureau of Labor Statistics estimated at 2.8%.
State Budget Director Dave Schmiedicke said he expects the owner of a typical Wisconsin home to open a December tax bill that will go up less than 1%, which he called “a very small increase.”Related Links:
- Wisconsin Taxpayers Alliance:
Compared to the prior year (fiscal 2005), Wisconsin taxes were up slightly, from 12.1% to 12.3% of income, but the 50-state rank fell from eighth to 11th. The state’s tax burden was 5.5% above the U.S. average (11.6%). Since the late 1950s (see diagram, over), the Badger State’s tax burden and rankings have ranged from lows of 9.7% (1958) and 18th (1960) to highs of 15.8% (1973) and first (1964).
- Wisconsin Legislative Fiscal Bureau Memorandum – 32K PDF. TJ Mertz comments on the tax increase.
- Channel3000:
Taxes paid to schools are by far the largest chunk of a homeowner’s tax bill. They increased 7.4 percent this year.
The next two largest parts of a tax bill also went up: Municipal tax levies increased 5 percent, and county levies grew 4.5 percent.- K-12 Tax & Spending Climate
- New York Governor proposes 4% cap on annual school property tax increases.
Two longtime nonpartisan Wisconsin research groups announce merger
Matthew DeFour: Two of Wisconsin’s oldest nonpartisan research organizations — which combine for nearly 200 years of distilling state and local fiscal and policy issues — are joining forces at the end of the year. The Madison-based Wisconsin Taxpayers Alliance, founded in 1932, and the Milwaukee-based Public Policy Forum, founded in 1913, plan to merge […]
Wisconsin Act 10, Outcomes, Spending And Rhetoric
Molly Beck: A spokeswoman for Senate Majority Leader Scott Fitzgerald, R-Juneau, said Act 10 has been an “undisputed victory for Wisconsin taxpayers.” “Wisconsin’s declining union membership since the passage of right-to-work legislation only reflects that workers now have the ability to make their own decision about the costs and benefits of union membership,” said spokeswoman […]
Madison School District’s 2015-2016 Budget Goals & Priorities (Publish Total Spending?)
Madison School District (PDF): A. Alignment to Strategic Framework- In our vision to make every school a thriving school that prepares every student to be ready for college, career and community, these budget resources support the district’s goals and priorities as defined in our Strategic Framework. B. More equitable use of resources- As opposed to […]
Commentary and Results of the Madison School District’s Maintenance Referendum Survey (3% Response)
Madison School District Administration (PDF): MMSD received a total of 3,081 responses to the online survey. However, only Question #1 received the maximum number of responses; Questions #2-13 averaged around 2,200 respondents. Normally, a response rate is calculated by dividing the number of responses by the number of invitations to complete the survey. However, it […]
Wisconsin’s DPI Lags again: Minnesota Publicly Links High School Graduation to College Achievement Data
Mila Koumpilova Six years ago, 225 students graduated from St. Paul’s Como Park High School. More than 70 percent went to college. Almost 40 percent got a degree. That’s the sort of information Minnesota educators and parents have long wished they had. Now, it is readily available for the first time on a newly launched […]
Madison Schools’ 2013-2014 Budget Charts, Documents, Links, Background & Missing Numbers
Sources:
- General and Categorical Aid – Payments to School Districts
- WISTAX Facts & Figures
- Madison Schools 2013-2014 June 10, 2013 Budget Discussion Document (PDF)
- Wisconsin State Tax Based K-12 Spending Growth Far Exceeds University Funding
- Up, Down & Transparency: Madison Schools Received $11.8M more in State Tax Dollars last year, Local District Forecasts a Possible Reduction of $8.7M this Year – March, 2013. The June 10, 2013 District budget document (PDF) fails to mention the previous year’s large increase in redistributed State of Wisconsin tax dollars:
Like all Wisconsin school districts, MMSD relies upon a state-local funding partnership. The actions of one partner greatly impact the other partner. The 2013-14 MMSD budget anticipates a major funding loss for MMSD (a loss of $8.7 in equalization aid) which shifts the funding burden onto the local property taxpayer.
The charts reveal several larger stories:
First, the State of Wisconsin “committed” to 2/3 K-12 funding in the mid-1990’s. The increase in redistributed state tax dollars is apparent. [Wisconsin Legislative Fiscal Bureau: State Aid to School Districts (PDF)]
Second, Madison’s substantial real estate growth during the 2000’s supported growing K-12 spending while reducing the property tax rate (the overall pie grew so the “rate” could fall somewhat). The real estate music stopped in the late 2000’s (“Great Recession) and the tax rate began to grow again as the District consistently raised property taxes. *Note that there has been justifiable controversy over Madison’s large number of tax exempt properties. Fewer exemptions expands the tax base and (potentially) reduces individual homeowner’s taxes.
Third, Madison has long spent more per student than most public schools.
Fourth, the District’s June 10, 2013 budget document fails to address two core aspects of its mission: total spending and program effectiveness. The most recent 2012-2013 District budget number (via a Matthew DeFour email) is $392,789,303. This is up 4.4% from the July, 2012 District budget number: $376,200,000. The District’s budget has always – in my nine years of observation – increased throughout the school year. The late, lamented “citizen’s budget” was a short lived effort to create a standard method to track changes over time.
Fifth, the June 10, 2013 document does not include the District’s “Fund balance” or equity. The balance declined during the 2000’s, somewhat controversially, but it has since grown. A current number would be useful, particularly in light of Madison’s high property taxes.
Sixth, I took a quick look at property taxes in Middleton and Madison on a $230,000 home. A Middleton home paid $4,648.16 in 2012 while a Madison home paid 16% more, or $5,408.38. Local efforts to significantly increase property taxes may grow the gap with Middleton.
Finally, years of spending and tax growth have not addressed the District’s long term-disastrous reading results. Are we doing the same thing over and over?


Wisconsin School Superintendent Election: Tony Evers & Don Pridemore Word Cloud
Tony Evers WISTAX 2013 Election Interview Word Cloud:
Don Pridemore WISTAX 2013 Election Interview Word Cloud:
Links: A recent Wisconsin State Journal Evers endorsement.
wuwm.comThree weeks from today, Wisconsin voters will decide who will oversee K-12 public education for the next four years. Incumbent state Superintendent Tony Evers faces a challenge from Republican state Rep. Don Pridemore.
Evers says he’s proud of his accomplishments over the past four years. He highlights the implementation of Common Core Standards. The national initiative sets benchmarks for students to meet in English, Language Arts and Math, to make sure they’re prepared for the workforce.
“We’re developing new assessment systems and accountability systems. We have a new reading screener we’ve implemented at kindergarten that’s been very good as far as providing information for classroom teachers to intervene early,” Evers says.
Evers says his biggest challenge has been competing with choice or voucher schools for state funding. Students in Milwaukee and Racine can attend private schools – taking with them, the tax money that would have gone to the public system. Evers opposes Gov. Walker’s plan to expand the voucher program to nine more school districts and increase funding for participating students.
“There’s a zero dollar increase for our public schools per pupil and then on the voucher side there’s a $1,400 per student increase for $73 million. To me that’s a concept that isn’t connected in any good way for our public schools,” Evers says.
Evers opponent, Republican Rep. Don Pridemore of Hartford supports the expansion of choice. He says there would not to be need for it, if public schools better prepared students. Pridemore says if he’s elected, he’ll work to expand the program statewide.


4K Inches Forward in Madison, Seeks Funding
Listen to the Madison School Board Discussion via this 32MB mp3 audio file (and via a kind reader’s email).
Financing this initiative remains unsettled.
I recommend getting out of the curriculum creation business via the elimination of Teaching & Learning and using those proceeds to begin 4K – assuming the community and Board are convinced that it will be effective and can be managed successfully by the Administration.
I would also like to see the Administration’s much discussed “program/curricular review” implemented prior to adding 4K.
Finally, I think it is likely that redistributed state tax programs to K-12 will decrease, given the State’s spending growth and deficit problems. The financial crunch is an opportunity to rethink spending and determine where the dollars are best used for our children. I recommend a reduction in money spent for “adults to talk with other adults”.
Board member Beth Moss proposed that 4K begin in 2010. This motion was supported by Marj Passman and Ed Hughes (Ed’s spouse, Ann Brickson is on the Board of the Goodman Center, a possible 4K partner). Maya Cole, Lucy Mathiak and Arlene Silveira voted no on a 2010 start. The Board then voted 5-1 (with Ed Hughes voting no) for a 2011 launch pending further discussions on paying for it. Retiring Board member Johnny Winston, Jr. was absent.
I appreciate the thoughtful discussion on this topic, particularly the concern over how it will be financed. Our Federal Government, and perhaps, the State, would simply plow ahead and let our grandchildren continue to pay the growing bill.
Links:
- Gayle Worland:
“I’m going to say it’s the hardest decision I’ve made on the board,” said board member Marj Passman, who along with board members Beth Moss and Ed Hughes voted to implement four-year-old kindergarten in 2010. “To me this is extremely difficult. We have to have 4K. I want it. The question is when.”
But board president Arlene Silveira argued the district’s finances were too unclear to implement four-year-old kindergarten — estimated to serve 1,573 students with a free, half-day educational program — this fall.
“I’m very supportive of four-year-old kindergarten,” she said. “It’s the financing that gives me the most unrest.”
Silveira voted against implementation in the fall, as did Lucy Mathiak and Maya Cole. Board member Johnny Winston, Jr. was absent.
On a second vote the board voted 5-1 to approve 4K for 2011-12. Hughes voted against starting the program in 2011-12, saying it should begin as soon as possible.- Channel3000:
The plan will begin in September 2011. Initially, the board considered a measure to start in 2010, but a vote on that plan was deadlocked 3-3. A second motion to postpone the beginning until the 2011-2012 school year passed by a 5-1 vote.
The board didn’t outline any of the financing as yet. District spokesman Ken Syke said that they’re working on 2010 budget first before planning for the 2011 one.
The board’s decision could have a large impact on the district and taxpayers as the new program would bring in federal funds.- WKOW-TV:
This is the first real commitment from MMSD to establish comprehensive early childhood education.
What they don’t have yet is a plan to pay for it.
It would’ve cost about $12.2 million to start 4k this fall, according to Eric Kass, assistant superintendent for business services.
About $4.5 million would come from existing educational service funds, $4.2 million from a loan, and about $3.5 million would be generated thru a property tax increase.
Some board members said they were uncomfortable approving a funding plan for 4k, because there are still a lot of unanswered questions about the district’s budget as a whole.- NBC15:
Members first deadlocked in a three-to-three tie on whether to start 4-K this fall, then voted five-to-one to implement it the following year.
The cost this year would have been more than $12 million. The decision to delay implementation is due to serious budget problems facing the Madison District.
Nearly 1600 4-year-old students are expected to participate in the half-day kindergarten program.- Don Severson:
The Board of Education is urged to vote NO on the proposal to implement 4-year old Kindergarten in the foreseeable future. In behalf of the public, we cite the following support for taking this action of reject the proposal:
The Board and Administration Has failed to conduct complete due diligence with respect to recognizing the community delivery of programs and services. There are existing bona fide entities, and potential future entities, with capacities to conduct these programs
Is not recognizing that the Constitution and Statutes of the State of Wisconsin authorizes the provision of public education for grades K-12, not including pre-K or 4-year old kindergarten
Has not demonstrated the district capacity, or the responsibility, to manage effectively the funding support that it has been getting for existing K-12 programs and services. The district does not meet existing K-12 needs and it cannot get different results by continuing to do business as usual, with the ‘same service’ budget year-after-year-after-year
A Primer on Wisconsin School Revenue Limits
The Wisconsin Taxpayer 3.4MB PDF:
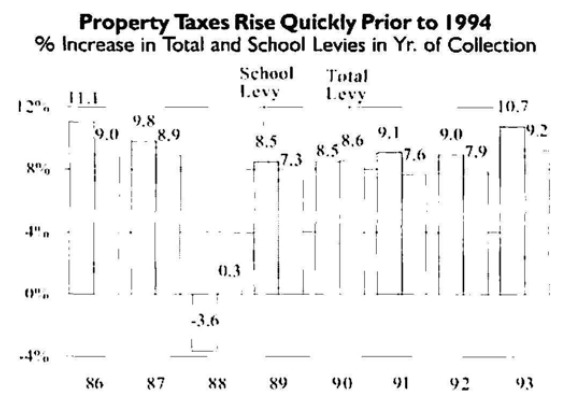
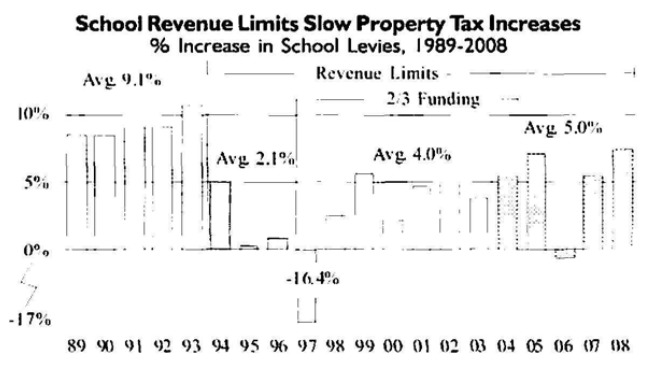
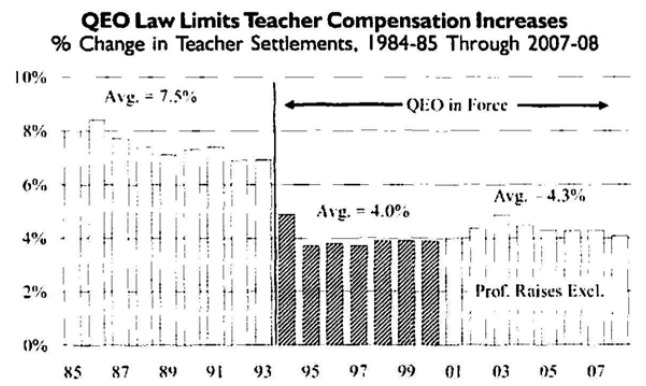
Since 1994, Wisconsin school districts have operated under state-imposed revenue limits and the associated qualified economic offer (QEO) law.
- Revenue limits have helped reduce school property tax increases to less than 5% per year from more than 9% annually prior to the caps.
- The limits have had \aried impacts on school districts, with growing districts experiencing the largest revenue gains. Low-spending districts prior to the caps have seen the largest per student gains.
- The QEO law has helped school districts keep compensation costs somewhat in line with revenue limits. However, since benefits are given more weight, teacher salary increases have slowed.
Since 1994. Wisconsin school districts have operated under slate-imposed revenue limits, which arc tied to inflation and enrollments. The associated qualified economic offer (QEO) law limits staff compensation increases to about 4% annually. With declining student counts, fluctuations in stale school aid. and various concerns over teacher pay. revenue limits and the QEO have attracted increasing debate.
The governor, in his proposed 2009-11 state budget, recommends eliminating the QEO. I le has also talked about providing ways for school districts to move away from revenue limits. This report does not address these specific proposals. Rather, it seeks to help inform discussions by examining the history of revenue limits and the QEO, legislative attempts to fix various issues, and the impacts of limits on schools, educators, and taxpayers.
THE REVENUE LIMIT LAW
School districts collect revenue from a variety of sources. The two largest sources are the property tax and state general (or equalization) aid, General aid is distributed based on district property wealth and spending. Combined, these two revenue sources account for about 75% of an average district’s funding. The remainder is a combination of student fees, federal aid. and state categorical aids. such as those for special education and transportation.
The revenue limit law was implemented in 1994 (1993-94 school year) and caps the amount districts can collect from property taxes and general aid combined. It does not restrict student fees, federal aid. or state categorical aid. A district’s revenue limit is determined by its prior-year cap, an inflation factor, and enrollments. There is an exception to the limit law for districts defined as “low-revenue.” Currently, districts with per student revenues less than S9.000 are allowed to increase their revenues to that level.
Background
While Wisconsin’s revenue limit law began in 1994. its roots date back to several teacher strikes in the early 1970s, culminating with the 1974 Hortonville strike during which 86 teachers were fired. That strike gained national attention.
Related: K-12 tax & spending climate. A number of links on local school spending and tax increases before the implementation of State limits on annual expenditure growth. The Madison School District spent $180,400,000 during the 1992-1993 school year. In 2006, the District spent $331,000,000. The 2009/2010 preliminary Citizen’s Budget proposes spending $367,912,077 [Financial Summary 2.1MB pdf], slightly down from 2008/2009’s $368,012,286.
Picturing Wisconsin School Trends
Wisconsin schools budgeted to spend $9.94 billion last year, or $11,522 per pupil. About 58% of that went to instruction. Over the past decade, increases in per pupil spending have averaged 4.0% per year. Meanwhile, statewide enrollments have dropped for five consecutive years.
T he world in which Wisconsin public schools operate today is markedly different from the one in the early 1990s. Enrollments and expenditure trends, and spending and staffing patterns, have all changed–in some cases, dramatically. But, simple pictures often tell the story.
One of the most noticeable developments over the past 20 years has been the ebb and flow of student numbers. The “baby boom echo” led to K-12 enrollments rising from 757,050 in 1990 to 874,042 in 2003. Since then, however, the student count dropped to 863,660 in 2008, the fifth consecutive year of decline.
Wisconsin State & School Finance Climate Update
I recently had an opportunity to visit with Todd Barry, President of the Wisconsin Taxpayers Alliance [29 minute mp3]. A summary of this timely conversation follows:
[2:25] Post Retirement Liabilities: Milwaukee Public Schools Post Retirement Health Care Liabilities: $2.2 to $2.5 billion
[3:01] Wisconsin’s $2.44 Billion structural deficit. The State debt load ($4billion to $9billion from 2000 to 2007) is now among the top 10.
[7:48] On property values and assessment changes. Two years ago, property values grew 9%, last year 6%, 3% this year with most of the recent growth coming from commercial properties.
[8:57] Wisconsin Income Growth: Per Capita personal income “The canary in the mineshaft” and how we lag the national average by 6% or more.
Why?
The population is aging. Senior population will double by 2030. School age population is stagnant.
Employment growth peaked before the nation (04/05)
Wisconsin wages per worker is about 10% less than the national average. 1969; 4% below national average, 1980’s; 10 or 11% below national average. Wisconsin wagers per worker are now 14% below national average. We’ve been on a 40 year slide.
We’ve hid this because the labor force participation of women has increased dramatically.
Wisconsin is losing corporate headquarters.
[18:18] What does this all mean for K-12 spending?
“If there is going to be growth in any state appropriation,it is going to be schools and Medicaid“. The way the Legislature and Governor have set up these two programs, they are more or less on auto-pilot. They will grab whatever money is available and crowd out most everything else. So you get this strange situation where state aid to schools has tripled in the last 25 years while funding for the UW has barely doubled. That sounds like a lot, but when you look at it on a year by year basis, that means state funding for the University of Wisconsin System has grown less than the rate of inflation on an annual average basis while school aids has outpaced it (inflation) as has Medicaid.”
Is there anything on the horizon in terms of changes in school finance sources? A discussion of shifting state school finance to the sales tax. “It’s clear that in states where state government became even more dominant (in K-12 finance) than in Wisconsin, the net result, in the long run, was a slowing of state support for schools. The legislature behaves like a school board, micromanaging and mandating. California is the poster child.
[20:52] On why the Madison School District, despite flat enrollment and revenue caps, has been able to grow revenues at an average of 5.25% over the past 20 years. Barry discussed: suburban growth around Madison, academic competition amongst Dane County high schools. He discussed Madison’s top end students (college bound kids, kids of professionals and faculty) versus the “other half that doesn’t take those (college entrance) tests” and that the “other half” is in the bottom 10 to 20% while the others are sitting up at the top on college entrance exams.
[23:17]: This is a long way of saying that Madison has made its problem worse and has put itself on a course toward flat enrollment because of social service policies, school boundary policies and so forth that have pushed people out of the city.
[23:42] “If there is a way within state law to get around revenue caps, Madison has been the poster child”. Mentions Fund 80 and frequent and successfully passing referendums along with Madison’s high spending per pupil.
People think of the Milwaukee Public Schools as a high spending District. When you really look start to dig into it, it is above average, but Madison is way out there compared to even MPS. People argue that argue that MPS is top heavy in terms of administrative costs per student, Madison actually spends more in some of those categories than Milwaukee. (See SchoolFacts, more)
[26:45] On K-12 School finance outlook: The last time we blew up the school finance system in Wisconsin was in 1994. And, it happened very quickly within a span of 2 to 3 months and it had everything to do with partisan political gotcha and it had nothing to do with education.
[28:26] “Where are the two bastians of Democratic seats in the legislature? Madison and Milwaukee. Madison is property rich and Milwaukee is relatively property poor. Somehow you have to reconcile those two within a Democratic environment and on the Republican side you have property rich suburbs and some very property poor rural districts.
Referendum Climate: Charts – Enrollment; Local, State, Federal and Global Education Spending
Variations of this question are often asked: “Are we spending too much, too little or just the right amount on education?” I thought it might be useful to have a look at some local, state, federal and global information. Click to view the charts in detail:
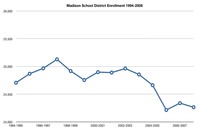
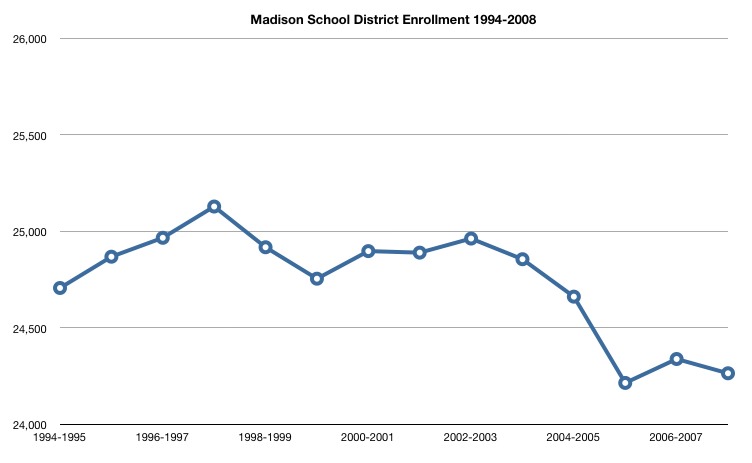
Madison School District Enrollment: 1994-2007 (the demographics have changed during this time)
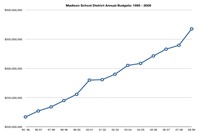
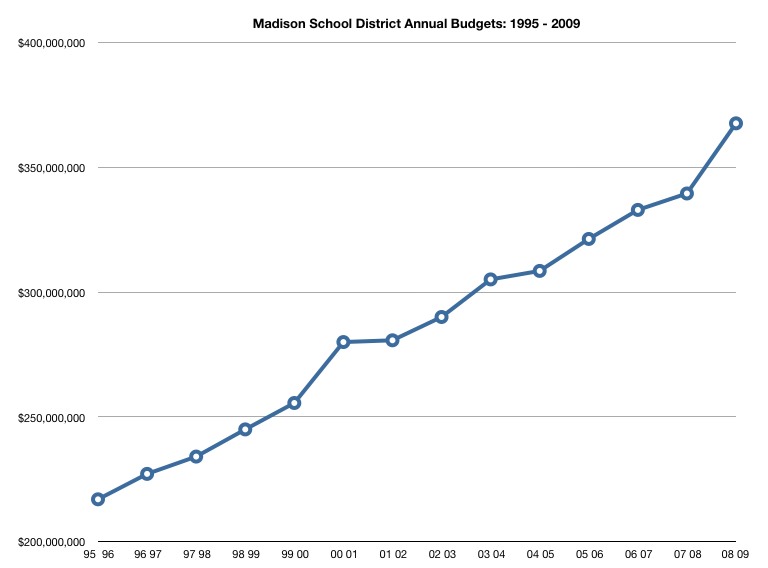
Madison School District Budgets: 1995-2009

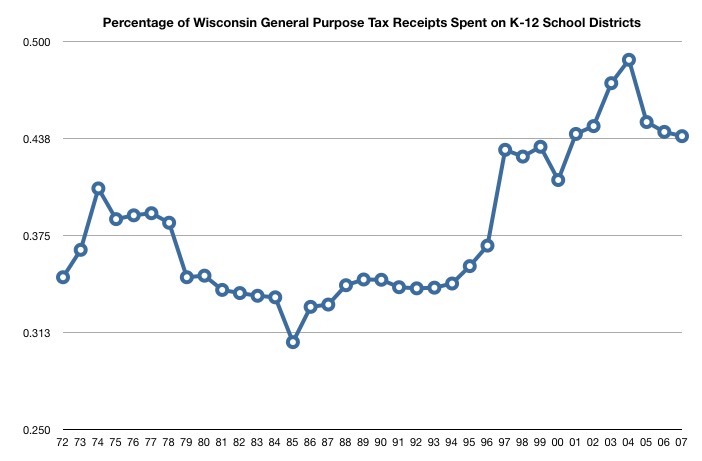
Percentage of Wisconsin General Purpose State Tax Revenue Spent on K-12 School Districts: 1972-2007
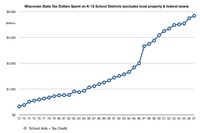
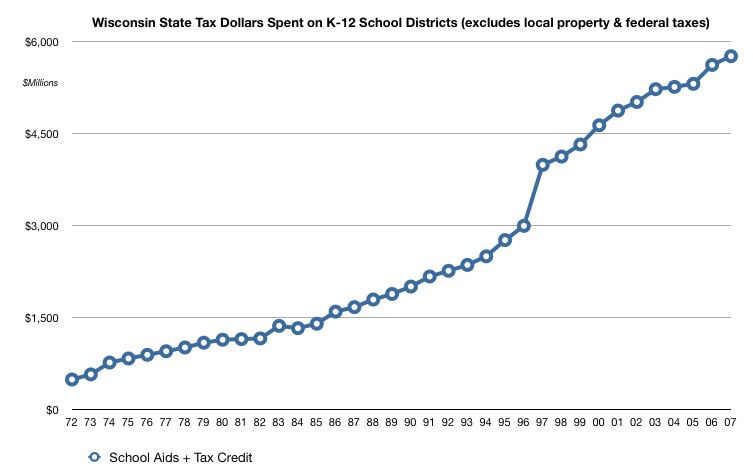
Wisconsin State Tax Dollars Spent on K-12 School Districts: 1972-2007
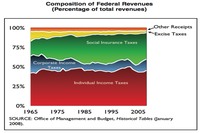
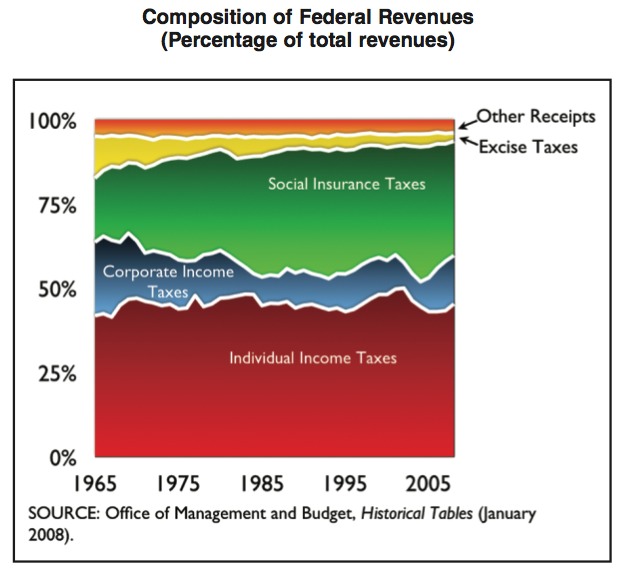
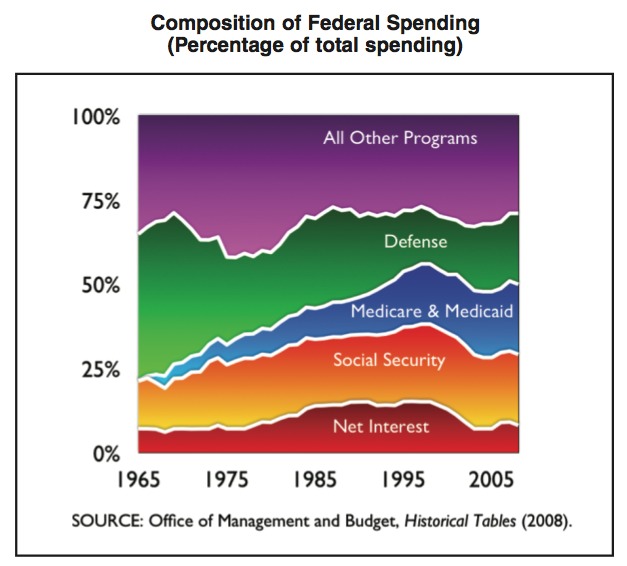
US Government Tax Revenue, by Source: 1965-2005

Composition of US Government Spending: 1965-2005
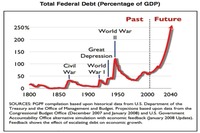
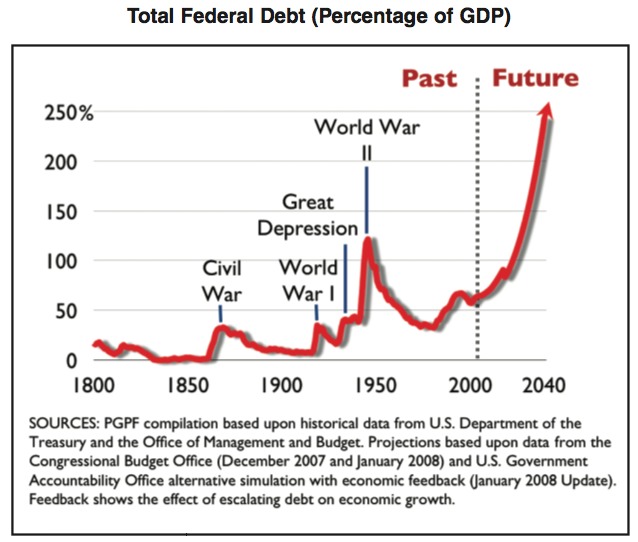
Total US Governement Debt, as a percentage of GDP
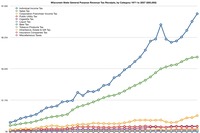
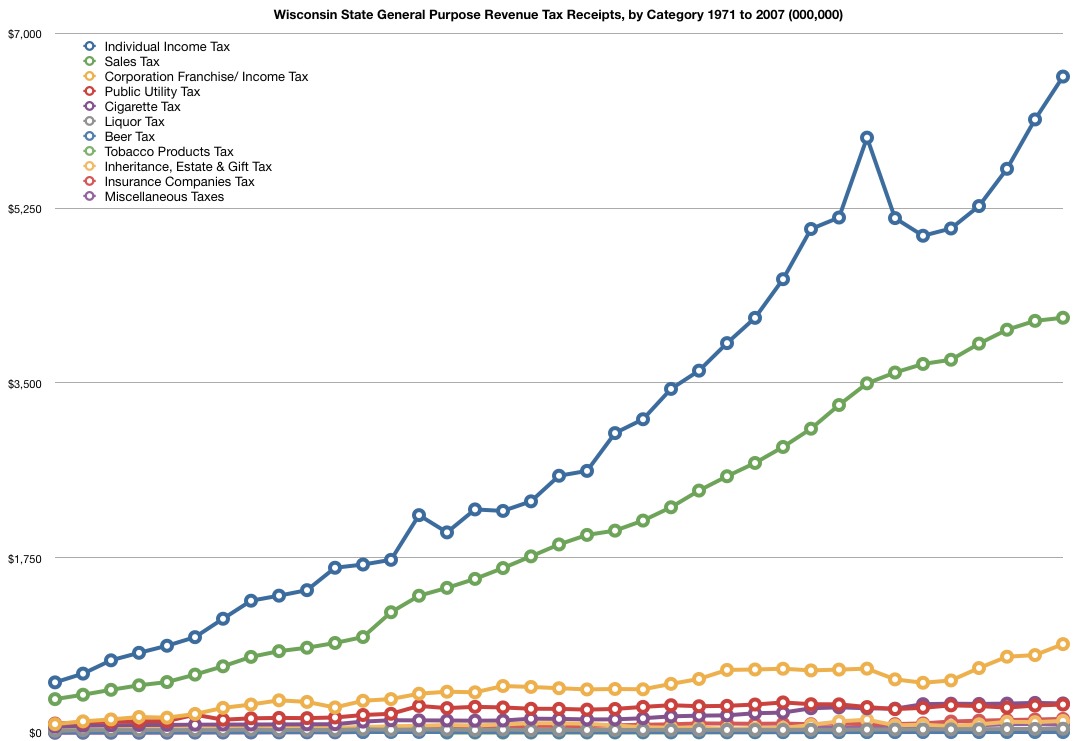
Wisconsin General Purpose Revenue Tax Receipts by Category: 1971-2007

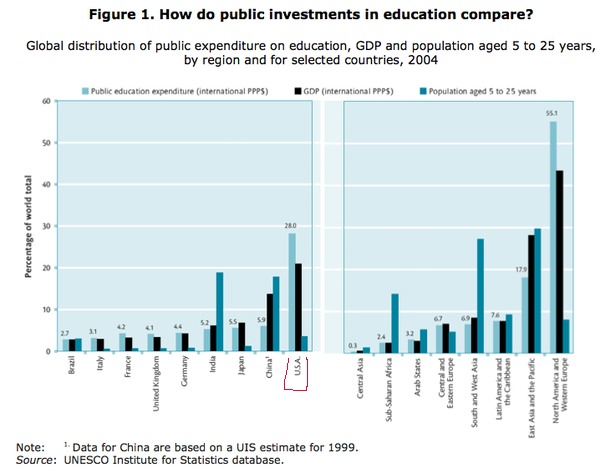
Global Distribution of public expenditure on Education: ages 5 to 25
Data via the Madison School District (various budget documents and statistics), The Wisconsin Taxpayers Alliance, I.O.U.S.A: One Nation, Under Stress, in Debt and the UNESCO Institute for Statistics Database.
US Bureau of Labor Statistics: Consumer Price Index. $1000 in 1995 requires $1443.33 according to their inflation calculator, while $1000 in 1972 requires $5,262.30 in 2008.
November Madison School District Planned November, 2008 Referendum notes & links. Tax climate notes & links: When is a Tax Cut Really a Tax Hike by Gene Epstein, 20 Reasons to Kill Corporate Taxes by James Pethokoukis, I.O.U.S.A the Movie, the Economist: Inflation’s Last Hurrah and Dave Blaska on the proposed referendum.
What is Public Education?
Lisa Graham Keegan – an adviser to McCain’s 2008 campaign:
One constant cry in the debate over educational reform is that we must save our public schools. But proponents of that argument assume that a public school system must be exactly what we have today: schools clustered in districts governed by centralized bureaucracies that oversee every detail of what goes on in individual schools, from budgets to personnel to curricula. That’s like saying that our steel industry should center on open-hearth furnaces and giant corporations rather than the nimble mini-mills that have largely superseded them. Let’s agree, for argument, that a public school system is a good thing: but why should it look just like it does today—which is what it looked like 50 years ago?
There’s nothing sacrosanct, after all, about the current structure of our public education system. Its roots go back to the nineteenth century, when a geographical community would club together to hire and pay a teacher and later, when things got more complicated, would tax property to provide a local school and then appoint or elect a few people to a small board that would oversee it and hire its teacher. As the communities grew into towns and cities, it seemed logical to expand the governing mechanisms already in place. Tiny school boards slowly swelled into today’s bloated and dysfunctional school districts, responsible for running not one but 5 or 25 or 50 schools.
If we want to save the public schools, we mustn’t confuse the ideal of public education—that every child has the right to a good K-12 education at public expense—with any particular system, including the one we’ve got. Surely we can come up with a modernized definition of public education fit for a new millennium. In Arizona, where I’m Superintendent of Public Instruction, that’s just what we’re trying to achieve. Our new approach, aimed at shifting power from bureaucrats to students and families, has three key, equally essential parts: student-centered funding, parental choice, and tough, objectively measurable, standards.
Start with student-centered funding. In Arizona, we’ve all but replaced an older and more typical system, in which school districts assess and use local property taxes to fund schools, with one in which the state raises the money (including for capital construction) through a statewide tax, straps an equal amount of it to each student’s back, and releases it only when he walks into the school of his choice.
Today’s district is a rigid command-and-control system that offers dissatisfied parents no choices except, if they don’t like the district school, to send their kids to private school or to home-school them. Moreover, like the Soviet Union with its five-year plans, the districts do a poor job of management, for the reason F. A. Hayek pointed out: command-and-control systems suffer from an information deficit. How can a distant district office bureaucrat know how to run a school better than the principals and teachers who work there? Too often, the district just lays down a single set of policies to govern all its schools, imposing one-size-fits-all curricula and disciplinary policies on schools that may have very different needs. The system also seems impervious to reform from within. In my experience, those who join district boards, even those who start out reform-minded, eerily become co-opted and wind up defending the system tooth and nail. It’s just like watching Invasion of the Body Snatchers.
If you need an additional reason to abolish the traditional property-tax funding system, consider this: it’s unfair. Funding education through local property taxes is deeply regressive. It lets rich districts spend more per pupil, at much lower tax rates, than poor districts. After all, a rich district’s citizens who pay $3,000 per year on their $300,000 houses are paying 10 percent in taxes; the poor district’s citizens who pay $1,200 on their $100,000 houses are paying 12 percent.The Green Bay School District, currently run by incoming Madison Superintendent Dan Nerad spent $11,441 per student ($232,232,000 total budget) in 2006/2007 while Madison spent $12,422 per student ($329,596,000 total budget) during the same period according to School Facts 2007 by WISTAX.
A few other interesting comparisons between the Districts (2006/2007):
Equity Fund Balance Enrollment Low Income Staff % Revenues from Property Taxes Green Bay $21,900,000 (9.3%) 19,863 44.9% 2445.6 31.8% Madison $18,437,000 (6%) 24,908 44.1% 3544.6 67.9%
