Search Results for: "MAP" Assessment
Linking the Wisconsin Forward Assessments to NWEA MAP Growth Tests*
NWEA.org (PDF): The results in Table 5 demonstrate that MAP reading scores can consistently classify students’ proficiency (Level 3 or higher) status on Forward ELA test 81-83% of the time and MAP math scores can consistently classify students on Forward math test 86-88% of the time. Those numbers are high suggesting that both MAP reading […]
An Update on Madison’s Use of the MAP (Measures of Academic Progress) Assessment
Madison Superintendent Jane BelmoreUnlike other assessments, MAP measures both student performance and growth through administering the test in both fall and spring. No matter where a student starts, MAP allows us to measure how effective that student’s school environment was in moving that student forward academically.
This fall’s administration serves as a baseline for that fall to spring growth measure. It also serves as an indicator for teachers. As we continue professional development around MAP, we will work to equip schools to use this data at the classroom and individual student level. In other words, at its fullest use, a teacher could look at MAP data and make adjustments for the classroom or individual students based on where that year’s class is in the fall, according to these results.
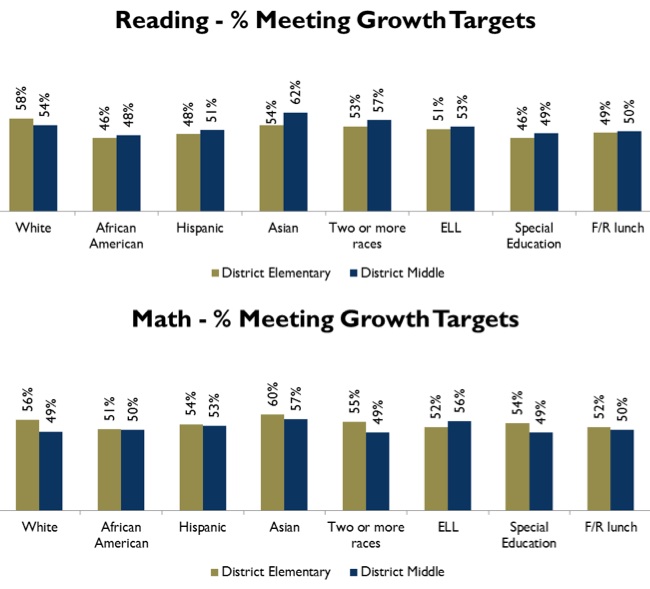
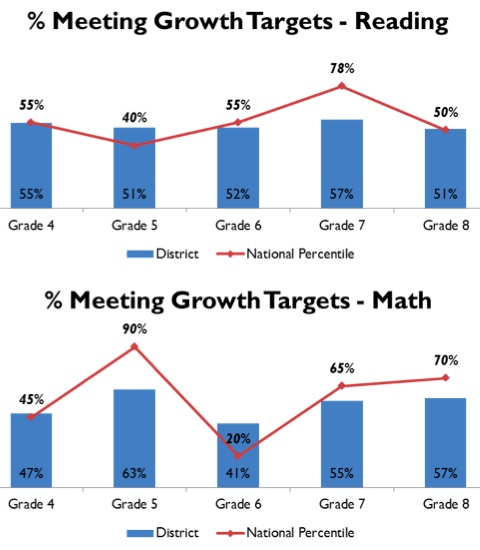
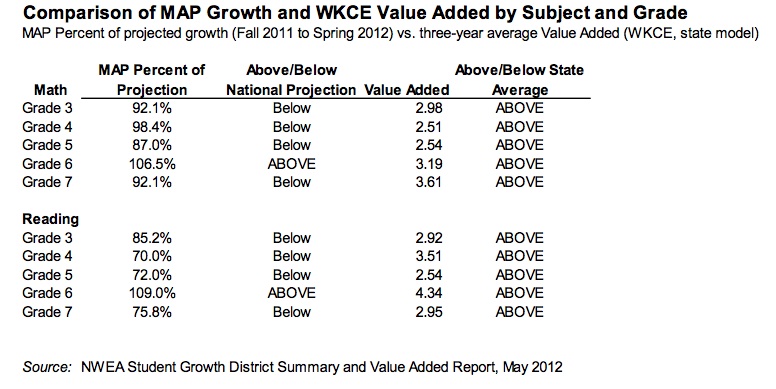
Meeting growth targets on the fall administration indicates that a student met or exceeded typical growth from Fall 2011 to Fall 2012. Typical growth is based on a student’s grade and prior score; students whose scores are lower relative to their grade level are expected to grow more than students whose scores are higher relative to their grade level.
In Reading, more than 50% of students in every grade met their growth targets from Fall 2011 to Fall 2012. In Mathematics, between 41% and 63% of students at each grade level met their growth targets. The highest growth in Mathematics occurred from fourth to fifth grade (63%) and the lowest growth occurred from fifth to sixth grade (41%).
It is important to note that across student groups, the percent of students making expected growth is relatively consistent. Each student’s growth target is based on his or her performance on previous administrations of MAP. The fact that percent of students making expected growth is consistent across student subgroups indicates that if that trend continues, gaps would close over time. In some cases, a higher percentage of minority students reached their growth targets relative to white students. For example, at the middle school level, 49% of white students met growth targets, but 50% of African American students and 53% of Hispanic students met their growth targets. In addition, English Language Learners, special education students, and students receiving free and reduced lunch grew at similar rates to their peers.
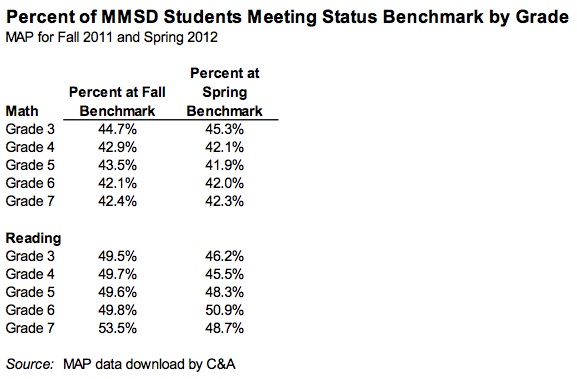
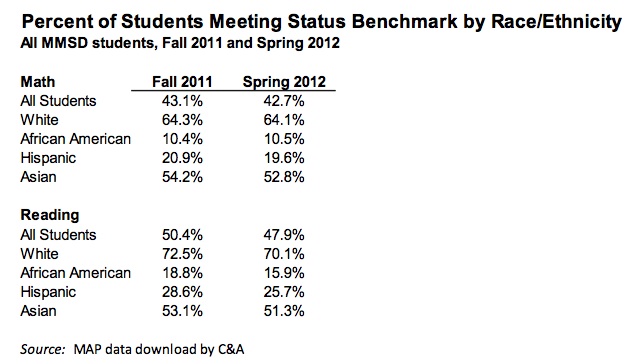
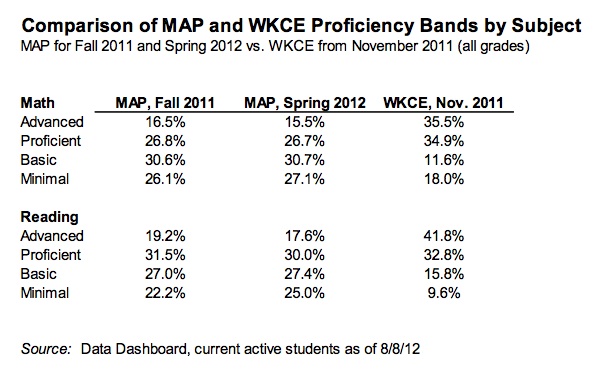
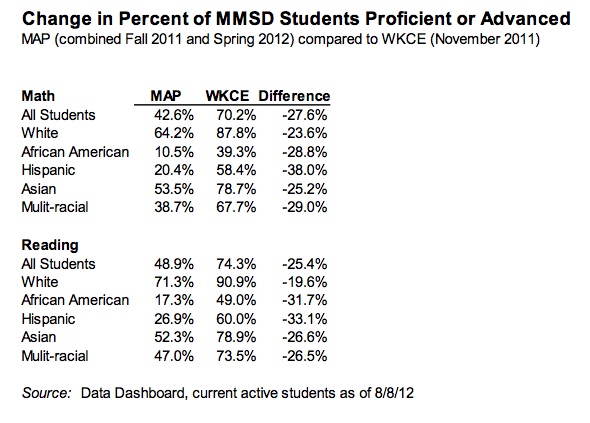
MAP also provides status benchmarks that reflect the new, more rigorous NAEP standards. Meeting status benchmarks indicates that a student would be expected to score “Proficient” or “Advanced” on the next administration of the Wisconsin Knowledge and Concepts Examination (WKCE).
That means that even though overall scores haven’t changed dramatically from last year, the percent of students identified as proficient or advanced will look different with these benchmarks. That is not unique for MMSD – schools around the state and nation are seeing this as they also work toward the common core.
While these scores are different than what we have been used to, it is important to remember that higher standards are a good thing for our students, our districts and our community. It means holding ourselves to the standards of an increasingly challenging, fast-paced world and economy. States all around the country, including Wisconsin, are adopting these standards and aligning their work to them.
As we align our work to the common core standards, student achievement will be measured using new, national standards. These are very high standards that will truly prepare our students to be competitive in a fast-paced global economy.
At each grade level, between 32% and 37% of students met status benchmarks in Reading and between 36% and 44% met status benchmarks in Mathematics. Scores were highest for white students, followed by Asian students, students identified as two or more races, Hispanic students, and African-American students. These patterns are consistent across grades and subjects.
Attachment #1 shows the percentage of students meeting status benchmarks and growth targets by grade, subgroup, and grade and subgroup. School- and student-level reports are produced by NWEA and used for internal planning purposes.Related: 2011-2012 Madison School District MAP Reports (PDF Documents):
- District Summary
- District Growth Summary
- Growth by Ethnicity
- Allis Elementary
- Black hawk Middle School
- Chavez Elementary School
- Cherokee Middle School
- Crestwood Elementary School
- Elvehjem Elementary School
- Emerson Elementary School
- Falk Elementary School
- Glendale Elementary School
- Gompers Elementary School
- Hamilton Middle School
- Hawthorne Elementary School
- Huegel Elementary School
- Jefferson Middle School
- Kennedy Elementary School
- Lake View Elementary School
- Leopold Elementary School
- Mendota Elementary School
- Nuestro Mundo Elementary School
- O’Keeffe Middle School
- Olson Elementary School
- Orchard Ridge Elementary School
- Randall Elementary School
- Sandburg Elementary School
- Schenck Elementary School
- Sennett Middle School
- Sherman Middle School
- Shorewood Elementary School
- Spring Harbor Middle School
- Stephens Elementary School
- Thoreau Elementary School
- Toki Elementary School
- Van Hise Elementary School
- White Horse Middle School
- Wright Middle School
I requested MAP results from suburban Madison Districts and have received Waunakee’s Student Assessment Results (4MB PDF) thus far.
Madison Schools’ Measures of Academic Progress (MAP) Assessment Results Released
Interim Madison Superintendent Jane Belmore (175K PDF):
The Measures of Academic Progress (MAP) is a computer adaptive series of assessments from the North West Evaluation Association (NWEA). There are tests in reading, language usage and math.
When taking a MAP test, the difficulty of each question is based on how well a student answers all the previous questions. As the student answers correctly, questions become more difficult. If the student answers incorrectly, the questions become easier. In an optimal test, a student answers approximately half the items correctly and half incorrectly. The final score is an estimate of the student’s achievement level. Each test takes approximately 50 minutes to complete.
MMSD has chosen to administer MAP for the following reasons:
- It helps ensure technical infrastructure to support implementation of Smarter Balanced Assessment.
- Rapid turn-around of classroom, school and district level data.
- Nationally normed results give a more accurate picture of MMSD’s standing.
- MAP measures student achievement growth in content area and within strands in a content area.
- Beginning 2012-13, MAP will be aligned with the Common Core State Standards
- MAP is not high stakes. It is not reported to the state for accountability purposes, but rather for district and school improvement.
In 2011-12, MAP was administered for Grades 3 through 7. In 2012-13, it will be expanded to include Grade 8. The default is to provide the test to all students, but MMSD has the ability to use judgment for students with disabilities. So, not all special education students will take MAP. Also, MAP is not for ELL levels 1 or 2.
I’m glad the Madison Schools published this information, and that they are implementing a much more rigorous assessment than the oft-criticized WKCE. I look forward to seeing the District’s report on the EXPLORE assessment, as well.
Nearby Monona Grove has used the MAP assessment for a number of years. It would be interesting to see how the Districts compare.
Matthew DeFour and TJ Mertz comment.
This report-Make Our Children Healthy Again: Assessment— is a call to action
MAHA Commission It presents the stark reality of American children’s declining health, backed by compelling data and long-term trends. More importantly, it seeks to unpack the potential dietary, behavioral, medical, and environmental drivers behind this crisis. By examining the root causes of deteriorating child health, this assessment establishes a clear, evidence- based foundation for the […]
Madison School District MAP Scores Report 2015-2016
Madison School District Administration (PDF): 1. The percent of students that tested advanced or proficient on the math portion increased 1% (45% to 46%) and increased 2% on the reading portion (40% to 42%) of the spring MAP test. 2. Proficiency gaps exist between demographic groups on MAP reading and math scores. These gaps are […]
Madison Schools’ MAP Test Data Sharing Agreement
Madison School District PDF: Data Sources a) MMSD will sign NWEA’s release form allowing NWEA to transfer MMSD’s test data to Consultant. b) In signing this contract, MMSD authorizes DPI to disclose student-level information to the Consultant for the purpose of linking demographic, enrollment, and other necessary data elements to student test scores during the […]
Madison Schools’ Student Assessment Plan Proposed Changes
Madison School District 500K PDF Slideware: Phase Out: WKCE, Explore, and Plan Phase In: PALS 2, Smarter Balanced, Aspire, Work Keys Required State Assessments PALS (4K-2) WKCE Science & Social Studies (3-8) ACCESS for English Language Learners Aspire (9, 10) ACT + Writing (11) Work Keys (12) Related: Madison Schools’ MAP results
Madison Talented & Gifted Update & Interesting MAP Test Results, By School
Reminders of Best Practice
Current Practice
Data from MMSD
Review input from Focus Groups
Examine Implications for Policy
Examine Implications for PracticeRelated: Parent talented & gifted complaint, MAP Assessment results, English 10, credit for non-Madison school district courses and outbound open enrollment.
A road map for education reform
Frederick Hess & Carolyn Sattin-Bajaj:
As much as any city in America, Milwaukee has played a pioneering role in educational choice. More than two decades after establishing the nation’s first urban school voucher program, Milwaukee offers families a raft of options, including district schools, charter schools and publicly funded private school scholarships.
Yet, this dramatic expansion of options has not yet translated into dramatic improvement. Student performance and graduation rates have not moved as reformers once hoped, and the achievement of low-income students continues to languish. On the 2011 urban National Assessment of Educational Progress, just 10% of Milwaukee eighth-graders were judged proficient in math and just 12% in reading. Especially disturbing is that the vast majority of public and private high school graduates who go on to attend the University of Wisconsin-Milwaukee do not complete college.
But this should be cause for renewed energy, not despair. After all, the Milwaukee Public Schools district has displayed a willingness to find ways to turn around struggling schools and to tackle long-standing fiscal challenges. Milwaukee’s charter school authorizers have shown themselves willing to hold low-performing schools accountable. Schools in the Milwaukee Parental Choice Program increasingly have embraced accountability for performance. Across all three sectors, there are instances of high-performing schools where even Milwaukee’s most challenged pupils can excel.
The Road Map Project: A Road Map for Large-Scale Improvement of K-12 Geography Education
The Road Map Project brought together experts in geography, education, and research from across the U.S. to create a set of landmark reports focusing on key issues for educational improvement: instructional materials for students, education of teachers, assessment, research, and public attitudes. These road map reports will chart a course for the large-scale improvement of K-12 geography education in the U.S.
Funded by a 2-year, $2.2 million grant from the National Science Foundation, this project responds to the growing recognition among business leaders and policy makers that Americans lack the critical geographic understanding and reasoning skills that will be required for careers and civic life in the 21st century.
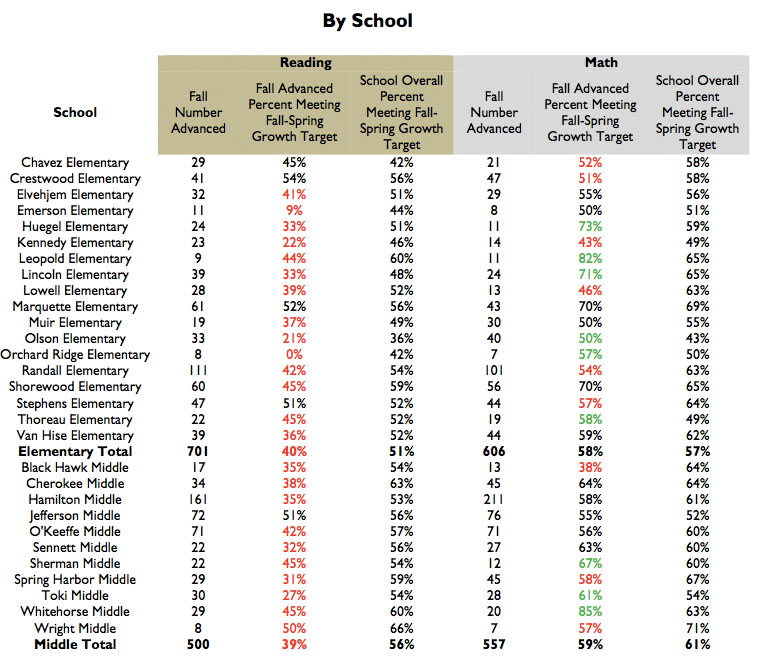
In Madison, poorer schools get less-experienced teachers; A Comparison of Randall & Sandburgs MAP Results
Randall Elementary School has one of the lowest poverty rates and some of the highest test scores in Madison. It also has the most experienced teaching staff in the district.
By contrast, Sandburg Elementary has one of the higher poverty rates and some of the lowest test scores. It also has the least experienced teaching staff.
Across the district, schools with higher concentrations of poverty are more likely to have teachers with less experience, according to a State Journal analysis of Madison School District data.
Experts say that while more experience doesn’t guarantee higher quality, teachers often need five to 10 years to reach their peak effectiveness.
“To consistently and disproportionately give the kids who need the most help people who aren’t at their best yet just disadvantages them,” said Sarah Almy, director of teacher quality for the Education Trust, a Washington, D.C.,-based group that advocates for raising student achievement.I quickly compiled the following charts (PDF version) from the 2011-2012 Madison School District’s MAP (Measurement of Academic Progress) math and reading results for Randall and Sandburg Elementary along with the District-wide results.
I added Randall, Sandburg’s and the Madison school district’s 3rd Friday, 2011 enrollment to the charts via the green rectangles. For example, the report states that 30 Sandburg 3rd grader’s took the MAP assessment while the District’s enrollment counts report 44 students in that class.

Madison School District Student Assessment Summary
Interim Superintendent Jane Belmore:
MAP often shows substantial declines in the percent of students identified as proficient or advanced as compared to past WKCE scores. This does not reflect a change in students’ abilities, but rather reflects a change to higher standards. MMSD’s WKCE results have been consistent for years.
- With 2011-12 being the first year that MMSD administered MAP, great caution must be exercised to avoid over-interpretation of results. One of the advantages of MAP is the ability to measure growth, and 2011-12 represent only a single data point. Plans for the immediate future include rigorous statistical analysis that will include significance tests to focus in on areas of excellence and possible concern.
- Student proficiencies are lower as measured by MAP than Wisconsin Knowledge Concepts Exam (WKCE). This is likely due to MAP being a more difficult and rigorous assessment than WKCE. MAP is also normed at the national level. MMSD has largely done well against other Wisconsin districts, but its results are not as strong when compared nationally.
Madison MAP Testing Shows They are Falling Short Too
Melissa Hammann, via a kind reader’s email:
So, the great and powerful Madison School District has started MAP testing and the results are, well, as they should have expected when viewed as a whole. White kids are above national averages and children of color are below them. MAP testing stands for Measures of Academic Progress. They are taken at the computer by each student and the questions are tailored to the individual student. They keep answering questions until they hit the wall of achievement level and the test is ended. Scores are known immediately and areas of strength and areas that need improvement are highlighted FOR EACH KID. It is supposed to be a tool for teachers to use in order to more adequately provide instruction in their classroom. This is called differentiated instruction, or DI in the education vernacular. MAP results are not really effective for national achievement comparison.
OK, I’m going out on a limb here and going to say to the critics of ECSD that we have been doing MAP testing in our district for 5 years now. My newly minted graduate was in the guinea pig group in 7th grade, so I am keyed in on this topic. We can thank Paula Landers for being ahead of the curve on implementing this tool. What seems to escape the writer of the article as well as our district is this. It’s very nice to know how one’s district stacks up as a whole against the state (WKCE) and nation (MAP, NAEP), but what exactly does this data provide in the way of improving individual student achievement? Exactly squat. In this world of inclusive learning, school districts must have tools to provide DI for all levels of learners. If you insist on teaching to some arbitrary mean that various test data indicates as the level of your class, you’ll lose the top 30 and bottom 30 percent of the curve. That’s 60 percent of the students being lost. Used properly, MAP results could be a very effective tool for the teaching arsenal to solve this problem.
Sadly, it is my experience that my kids’ teachers use it to verify what they already know about my kids, that they are above average, and use their MAP data to rationalize being satisfied with mediocre performance the rest of the year “because they are still above their peer average.” I have no data to indicate it is otherwise with other children. In fact, I have spoken to other parents with similar issues. In addition, over 35 percent of the students in the quadrant report that began the school year above their peer group in reading in our district in 10-11 did not reach the achievement goal the MAP test sets for them. It seems that the district thinks it’s OK that a child does not achieve to their potential. I am not of the same opinion.
……
Not only did my kid fail to reach his personal achievement goal set for him by the MAP test (gain less than they projected he should), but he ended 5th grade at a lower achievement level in reading than where he started. This loss of achievement happened while he got straight As all year long in language arts. I began a slow burn that has not stopped. I went to the principal, I went to the teacher and I went to the administrator in charge. “He started out so high that it was hard for him to achieve.” This is an unacceptable response. My child deserves to show some damn achievement after a year of instruction. I don’t care if he started out higher than the mediocre goals you set for the masses. This is thievery, plain and simple. That year, as I recall, the entire grade level failed to meet the 50% level, which basically says they have achieved grade level performance. Interpretation of MAP results is a bit confusing, so go with me here. Anything less than 50% for a grade level indicates they have not achieved a years worth of learning. There has been a shake up in the 5th grade teaching team, but I think it goes beyond individual teachers. If there is an endemic attitude that high achieving students are OK to ignore and an insistence on mistakenly using MAP data to compare to national averages (like the article in the Madison paper did) instead of using it for the amazing tool it could be, there will be no dang improvement in overall achievement.Related: Madison Schools’ Measures of Academic Progress (MAP) Assessment Results Released. Unfortunately, the Madison School District has not published the school by school MAP results, though the information made its way to Matthew DeFour’s Sunday article.
The Value-Add Map Is Not the Teaching Territory, But You’ll Still Get Lost without It
Since we’re so deep into the subject of value-added testing and the political pressures surrounding it, I thought I’d point out this recently published study tracking two and a half million students from a major urban district all the way to adulthood. (HT Whitney Tilson)
They compare teacher-specific value added on math and English scores with eventual life outcomes, and apply tests to determine whether the results are biased either by student sorting on observable variables (the life outcomes of their parents, obtained from the same life-outcome data) or unobserved variables (they use teacher switches to create a quasi-experimental approach).Much more on value added assessment, here.
Mapping State Proficiency Standards Onto the NAEP Scales: Variation and Change in State Standards for Reading and Mathematics, 2005-2009
US Department of Education, via a kind Chan Stroman email:
State-level National Assessment of Educational Progress (NAEP) results are an important resource for policymakers and other stakeholders responsible for making sense of and acting on state assessment results. Since 2003, the National Center for Education Statistics (NCES) has supported research that focuses on comparing NAEP and state proficiency standards. By showing where states’ standards lie on the NAEP scale, the mapping analyses offer several important contributions. First, they allow each state to compare the stringency of its criteria for proficiency with that of other states.
Second, mapping analyses inform a state whether the rigor of its standards, as represented by the NAEP scale equivalent of the state’s standard, changed over time. (A state’s NAEP scale equivalent is the score on the NAEP scale at which the percentage of students in a state’s NAEP sample who score at or above that value matches the percentage of students in the state who score proficient or higher on the state assessment.) Significant differences in NAEP scale equivalents might reflect changes in state assessments and standards or changes in policies or practices that occurred between the years. Finally, when key aspects of a state’s assessment or standards remain the same, these mapping analyses allow NAEP to substantiate state-reported changes in student achievement.
The following are the research questions and the key findings regarding state proficiency standards, as they are measured on the NAEP scale.Wisconsin’s oft criticized WKCE vis a vis NAEP:
WKCE “proficient” = 2009 NAEP Below Basic for grade 4 reading (along with 34 other states) and grade 8 reading (along with 15 other states)
= 2009 NAEP Basic for grade 4 math (along with 41 other states) and grade 8 (along with 35 other states)
WKCE results showed more positive changes than NAEP results for grade 4
reading from 2007 to 2009, grade 4 math from 2007 to 2009, and grade 4 math from 2005 to 2009
NAEP results showed more positive changes than WKCE results in grade 8
reading from 2005 to 2009.
How does Wisconsin compare? Learn more, here.
Dane County, WI Schools Consider MAP Assessement Tests After Frustration with State WKCE Exams
Waunakee Urges that the State Dump the WKCE
Andy Hall takes a look at a useful topic:
From Wisconsin Heights on the west to Marshall on the east, 10 Dane County school districts and the private Eagle School in Fitchburg are among more than 170 Wisconsin public and private school systems purchasing tests from Northwest Evaluation Association, a nonprofit group based in the state of Oregon.
The aim of those tests, known as Measures of Academic Progress, and others purchased from other vendors, is to give educators, students and parents more information about students ‘ strengths and weaknesses. Officials at these districts say the cost, about $12 per student per year for MAP tests, is a good investment.
The tests ‘ popularity also reflects widespread frustration over the state ‘s $10 million testing program, the Wisconsin Knowledge and Concepts Examination.
Critics say that WKCE, which is used to hold schools accountable under the federal No Child Left Behind law, fails to provide adequate data to help improve the teaching methods and curriculum used in the classrooms.
They complain that because the tests are administered just once a year, and it takes nearly six months to receive the results, the information arrives in May — too late to be of use to teachers during the school year.
The testing controversy is “a healthy debate, ” said Tony Evers, deputy state superintendent of public instruction, whose agency contends that there ‘s room for both WKCE and MAP.
….
“It ‘s a test that we feel is much more relevant to assisting students and helping them with their skills development, ” said Mike Hensgen, director of curriculum and instruction for the Waunakee School District, who acknowledges he ‘s a radical in his dislike of WKCE.
“To me, the WKCE is not rigorous enough. When a kid sees he ‘s proficient, ‘ he thinks he ‘s fine. ”
Hensgen contends that the WKCE, which is based on the state ‘s academic content for each grade level, does a poor job of depicting what elite students, and students performing at the bottom level, really know.
The Waunakee School Board, in a letter being distributed this month, is urging state legislators and education officials to find ways to dump WKCE in favor of MAP and tests from ACT and other vendors.
- More on WKCE scores – Missing Students
- 2006 MMSD WKCE Scores: A Closer Look
- “Schools should not rely on only WKCE data to gauge progress of individual students or to determine effectiveness of programs or curriculum”
- The Fordham Foundation has given Wisconsin’s state standards a “D”.
- Imperial College Ditches A Levels and Sets its own Entrance Exam
Madison Middle School Report Card/Homework Assessment Proposed Changes
Michael Maguire, via email:
I’m interested in gathering more information on this topic, as outlined in a message I received from a neighbor and PTO member. I appreciate more background info, if you have it (or a suggestion of where else I can go/with whom I can speak) to find out more: [“On Wednesday, February 20, at 7 pm Dr. Pam Nash and Lisa Wactel from MMSD will present the new format for middle school report cards. The meeting is in the LMC at Hamilton Middle School [Map].
The district is changing the middle school report cards to the same as the elementary: proficient, at grade level, needs improvement (or whatever those categories are). They will eliminate the letter grades: A, B, C, etc.
Another factor in the report cards is that homework will not count toward the grade. Teachers can still assign homework, but that will not count toward your child’s assessment.”]Michael Maguire
RugbyMaguires@aol.com
(608) 233-1235
I’ve heard that this model is also intended for the high schools. Related posts by Mary Kay Battaglia, “Can We Talk?
Student test scores drop as predicted during pandemic year in Missouri
Blythe Bernhard: Fewer than half of Missouri students performed at grade level or above in English (45%), math (35%) and science (37%) in the Missouri Assessment Program of standardized tests. In spring of 2019, the last time students were tested before the start of the pandemic, 49% of students scored proficient or advanced in English, […]
Wisconsin Legislators (some) attempt to address Our disastrous reading results
Mitchell Schmidt: However, committee chair Rep. Jeremy Thiesfeldt, R-Fond du Lac, challenged critics of the bill, including DPI, to come forward with a proposal to address reading readiness. “I’ve got to tell you, I’m getting tired of this. The current way we teach reading in the state of Wisconsin, almost across the entire board, that […]
Hearing Tuesday/Wednesday on Wisconsin’s Literacy Disaster
Public hearing is Tuesday at 10am, with the bill likely to be up around 10:30. Catch it on Wisconsin Eye. Lobbying information on Assembly Bill 446. Curiously, the League of Women Voters is against this legislation. Documents: Co-Sponsorship of LRB-1294 & 3781, Relating to: Reading Readiness Assessments and Granting Rule-Making Authority. Current Law vs. Roadmap […]
Do the Math…or Not
Shannon Watkins: When it comes to math performance, the United States has a pitiful record. Each year, about 1 million students enroll in college algebra and about 50 percent of those students fail to earn a “C” or better. And according to the Organization for Economic Cooperation and Development (OECD), the U.S. considerably underperforms in high school […]
Madison schools drop winter reading and math test for elementary and middle school students
Logan Wroge Given this, it was decided the winter MAP test is something the district doesn’t really need, Peterson said. Instead, district officials want to move to more formative assessments, which generally cover shorter time frames of learning, can come in more informal manners, such as asking students by a show of hands if they […]
Governance: Priorities and OUtcomes in Madison
Logan Wroge: Zirbel-Donisch said the plan is to have the condoms paid for by outside-partner organizations. While most four-year University of Wisconsin System colleges offer free condoms, doing so in Wisconsin high schools remains relatively rare. The state Department of Public Instruction estimated in 2016 that 6.9% of high schools in the state provided free […]
“The most politically intolerant people seem to be white, urban, highly educated, older and highly partisan themselves, according to the @PredictWise model”
Amanda Ripley Rekha Tenjarla Angela Y. He: In general, the most politically intolerant Americans, according to the analysis, tend to be whiter, more highly educated, older, more urban, and more partisan themselves. This finding aligns in some ways with previous research by the University of Pennsylvania professor Diana Mutz, who has found that white, highly […]
Fewer than half of all Wisconsin students scored proficient or above on state Forward Exam
Annysa Johnson: On the ACT exam, for example, he noted that students on vouchers scored an average 17.2 compared with 16.3 by MPS students overall and 15.6 for MPS students considered economically disadvantaged. Similarly, he said, students in the statewide voucher program, which accepts students from outside of Milwaukee and Racine, scored an average 21.3 […]
Wisconsin k-12 state examination results
Wisconsin DPI:
Commentary on Madison Schools $18k/student spending priorities
Jennifer Wang: Last November, the citizens of Madison supported a referendum to offset the drastic budget cuts forced upon our schools in recent years. The Madison Metropolitan School District has let class sizes expand for the past few years to cope with funding shortfalls. In this first budget cycle after the referendum, I ask the […]
Van Hise’s “Special Sauce”
Laurie Frost and Jeff Henriques, via a kind email: Dear Superintendent Cheatham and Members of the Madison School Board: We are writing as an update to our Public Appearance at the December 12 Board meeting. You may recall that at that meeting, we expressed serious concerns about how the District analyzes and shares student data. […]
Relaxing Wisconsin’s Weak K-12 Teacher Licensing Requirements; MTEL?
Molly Beck: A group of school officials, including state Superintendent Tony Evers, is asking lawmakers to address potential staffing shortages in Wisconsin schools by making the way teachers get licensed less complicated. The Leadership Group on School Staffing Challenges, created by Evers and Wisconsin Association of School District Administrators executive director Jon Bales, released last […]
Common Core Links
Richard Phelps, via a kind email: Drilling through the Core: “The federal Department of Education’s coercion of states to join Common Core sought to preempt a necessary debate at the state and local level. Nevertheless, that debate is now raging in state capitals across the country and Pioneer has been at the forefront of the […]
How High Are Property Taxes in Your State? (2016)
Vouchers, charters outscore public schools in latest data
Annysa Johnson: Third- through eighth-grade students in Milwaukee’s private voucher and independent charter schools outperformed their public school counterparts in math and language arts, according to statewide assessment data released Wednesday by the Department of Public Instruction. But Racine public school students overall outscored their voucher school counterparts. And on the ACT, voucher schools outscored […]
“In addition, we see that very few schools actually achieved growth improvements of 5% or more, with changes in growth generally clustering around 0%.” Slide updates on Madison’s $500M+ Government School System
PDF slides from a recent Madison School District Quarterly Board retreat. Readers may wish to understand “MAP” or “Measure of Academic Progress” [duck duck go SIS 2012 Madison and Waunakee results] Using MAP for Strategic Framework Milestones and SIP Metrics Feedback from various stakeholders has led us to examine the use of MAP (Measures of […]
The New Wisconsin Forward Exam
Wisconsin Reading Coalition: The Badger Exam lasted just one year, to be replaced this spring with the Wisconsin Forward Exam. Wisconsin contracted with Data Recognition Corporation (DRC) to develop the new test with input from Wisconsin teachers. In addition to rolling out the new assessment, DPI must complete the important process of setting proficiency standards. […]
The Unfortunate Trend Toward Opting Out of Standardized Tests
Ed Hughes: Ignore this. Parents should not opt their children out of the MAP test. That won’t accomplish anything but frustrate the school district’s assessment of our own performance and blur our vision of where we should be focusing our improvement efforts. There are plenty of ways to support our public schools but this isn’t […]
“The Plight of History in American Schools”
Diane Ravitch writing in Educational Excellence Network, 1989: Futuristic novels with a bleak vision of the prospects for the free individual characteristically portray a society in which the dictatorship has eliminated or strictly controls knowledge of the past. In Aldous Huxley’s Brave New World, the regime successfully wages a “campaign against the Past” by banning […]
Finland’s radical new plan to change school means an end to subjects
Max Ehrenfreund: Finland’s classrooms are very different from America’s — far more permissive, with less of an emphasis on academics. There are no standardized tests until high school, and children get 15 minutes of recess in between lessons — more than an hour of recess a day. “Play is important,” one Finnish teacher told the […]
Common Core Math Will Reduce Enrollment in High-Level High School Courses
Pioneer Institute via a kind Richard Phelps email: Study Finds Common Core Math Standards Will Reduce Enrollment in High-Level High School Math Courses, Dumb Down College STEM Curriculum Lower standards, alignment of SAT to Common Core likely to hurt low-income students the most Common Core math standards (CCMS) end after just a partial Algebra II […]
Commentary on Madison’s Long Term Achievement Gap Challenges; Single Year Data Points…
Pat Schneider: “It seems reasonable to attribute a good share of the improvements to the specific and focused strategies we have pursued this year,” Hughes writes. The process of improvement will become self-reinforcing, he predicts. “This bodes well for better results on the horizon.” Not so fast, writes Madison attorney Jeff Spitzer-Resnick in his Systems […]
2013 Madison Summer School Report
The district provided a comprehensive extended learning summer school program, K-Ready through 12th grade, at ten sites and served 5,097 students. At each of the K-8 sites, there was direction by a principal, professional Leopold, Chavez, Black Hawk and Toki, and oral language development was offered at Blackhawk and Toki. The 4th grade promotion classes were held at each elementary school, and 8th grade promotion classes were held at the two middle school sites.
Students in grades K-2 who received a 1 or 2 on their report card in literacy, and students in grades 3-5 who received a 1 or 2 in math or literacy, were invited to attend SLA. The 6-7 grade students who received a GPA of 2.0 or lower, or a 1 or 2 on WKCE, were invited to attend SLA. As in 2012, students with report cards indicating behavioral concerns were invited to attend summer school. Additionally, the summer school criterion for grades 5K-7th included consideration for students receiving a 3 or 4 asterisk grade on their report card (an asterisk grade indicates the student receives modified curriculum). In total, the academic program served 2,910 students, ranging from those entering five-year-old kindergarten through 8th grade.
High school courses were offered for credit recovery, first-time credit, and electives including English/language arts, math, science, social studies, health, physical education, keyboarding, computer literacy, art, study skills, algebra prep, ACT/SAT prep, and work experience. The high school program served a total of 1,536 students, with 74 students having completed their graduation requirements at the end of the summer.
All academic summer school teachers received approximately 20 hours of professional development prior to the start of the six-week program. Kindergarten-Ready teachers as well as primary literacy and math teachers also had access to job embedded professional development. In 2013, there were 476 certified staff employed in SLA.Jennifer Cheatham:
Key Enhancements for Summer School 2014
A) Provide teachers with a pay increase without increasing overall cost of summer school.
Teacher salary increase of 3% ($53,887).
B) Smaller Learning Environments: Create smaller learning environments, with fewer students per summer school site compared to previous years, to achieve the following: increase student access to high quality learning, increase the number of students who can walk to school, and reduce number of people in the building when temperatures are high. ($50,482)
C) Innovations: Pilot at Wright Middle School and Lindbergh Elementary School where students receive instruction in a familiar environment, from a familiar teacher. These school sites were selected based on identification as intense focus schools along with having high poverty rates when compared to the rest of the district. Pilot character building curriculum at Sandburg Elementary School. ($37,529)
D) Student Engagement: Increase student engagement with high quality curriculum and instruction along with incentives such as Friday pep rallies and afternoon MSCR fieldtrips. ($25,000)
E) High School Professional Development: First-time-offered, to increase quality of instruction and student engagement in learning. ($12,083)
F) Student Selection: Utilize an enhanced student selection process that better aligns with school’s multi-tiered systems of support (MTSS) so that student services intervention teams (SSIT) have time to problem solve, and recommend students for SLA. Recommendations are based on student grades and standardized assessment scores, such as a MAP score below the 25th percentile at grades 3-5, or a score of minimal on the WKCE in language arts, math, science, and social studies at grades 3-5. (no cost)
Estimated total cost: $185,709.00
Summer School Program Reductions
The following changes would allow enhancements to summer school and implementation of innovative pilots:
A) Professional development (PD): reduce PD days for teachers grades K-8 by one day. This change will save money and provide teachers with an extra day off of work before the start of summer school (save $49,344.60).
B) Materials reduction: the purchase of Mondo materials in 2013 allows for the reduction of general literacy curricular materials in 2014 (save $5,000).
C) Madison Virtual Campus (MVC): MVC is not a reimbursable summer school program as students are not in classroom seats. This program could be offered separate from summer school in the future (save $18,000).
D) Librarians: reduce 3 positions, assigning librarians to support two sites. Students will continue to have access to the expertise of the librarian and can utilize library resources including electronic equipment (save $12,903.84).
E) Reading Interventionists: reduce 8 positions, as summer school is a student intervention, it allows students additional learning time in literacy and math. With new Mondo materials and student data profiles, students can be grouped for the most effective instruction when appropriate (save $48,492).
F) PBS Coach: reduce 8 positions, combining the coach and interventionist positions to create one position (coach/interventionist) that supports teachers in setting up classes and school wide systems, along with providing individual student interventions. With smaller learning sites, there would be less need for two separate positions (save $24,408).
G) Literacy and Math Coach Positions: reduce from 16 to 5 positions, combining the role and purpose of the literacy and math coach. Each position supports two schools for both math and literacy. Teachers can meet weekly with literacy/math coach to plan and collaborate around curriculum and student needs (save $27,601.60).
Estimated Total Savings: $185,750.04
Strategic Framework:
The role of the Summer Learning Academy (SLA) is critical to preparing students for college career and community readiness. Research tells us that over 50% of the achievement gap between lower and higher income students is directly related to unequal learning opportunities over the summer (Alexander et al., 2007). Research based practices and interventions are utilized in SLA to increase opportunities for learning and to raise student achievement across the District (Odden & Archibald, 2008). The SLA is a valuable time for students to receive additional support in learning core concepts in literacy and math to move them toward MMSD benchmarks (Augustine et.al., 2013). SLA aligns with the following Madison Metropolitan School District (MMSD) Strategic Framework goals:
A) Every student is on-track to graduate as measured by student growth and achievement at key milestones. Milestones of reading by grade 3, proficiency in reading and math in grade 5, high school readiness in grade 8, college readiness in grade 11, and high school graduation and completion rate.
B) Every student has access to challenging and well-rounded education as measured by programmatic access and participation data. Access to fine arts and world languages, extra-curricular and co-curricular activities, and advanced coursework.
America’s best educated kids don’t go to school
Brian Ray, president of the National Home Education Research Institute, compared home schoolers and public school students on the results of three standardized tests — the California Achievement Test, the Iowa Test of Basic Skills and the Stanford Achievement Test — for the 2007-2008 academic year. With public school students at the 50th percentile, home schoolers were at the 89th percentile in reading, the 86th percentile in science, the 84th percentile in language, math, and social studies.
Socio-economic factors may have a lot to do with why home schoolers do so much better. Virtually all have a mother and a father who are living together. Nearly two thirds of fathers and 62 percent of mothers have a bachelor’s degree or higher.
The explosive growth in home schooling has been fueled by dissatisfaction with public schools.
We spend more per pupil than any other country, but among industrialized nations, American students rank near the bottom in science and math. Only 13 percent of high school seniors knew what high school seniors should know about American history, says the National Assessment of Education Progress. Half of 18 to 24 year olds in a National Geographic Society survey couldn’t locate New York state on a map.
The United States is only major country where young people will not know more than their parents, the education expert for the Organization of Economic Cooperation and Development told the BBC last year.
About 2 million children are home schooled. Since 1999, the number being home schooled has increased 7 percent a year. Enrollment in public schools fell 5 percent between 2005 and 2010.
The first students to leave public schools tend to be the better ones, because their parents care more about education, said University of Tennessee law professor Glenn Reynolds. “When they leave, the overall quality of the remaining students, and thus the schools, will drop.”
When enrollment declines, funding is cut. Because teacher unions are so powerful, first on the chopping block are music, art and athletic programs. (In Buffalo, N.Y., where teachers get free cosmetic surgery, music programs may be eliminated in half the schools.) These cuts make public schools less attractive, accelerating departures.
Madison school with steepest growth in poverty
How does an elementary school adjust to a steep and rapid rise in the number of poor children coming through its doors?
With programs to build language and technological literacy, resilient character, and ties to the community, says Brett Wilfrid, principal of Sandburg Elementary School, 4114 Donald Drive, on Madison’s far east side.
“When people come and spend time in this school, they see a lot of happy children and adults. It is a wonderful, thriving community,” Wilfrid told me in a phone interview Thursday.
I spoke with Wilfrid after a Cap Times data report published this week showed that Sandburg Elementary had the greatest increase in the Madison School District — 34.3 percentage points — in the number of children from low-income families in the past decade.
The percentage of low-income children, based on eligibility for free or reduced price lunch, rose from 37.9 percent of Sandburg enrollment in the 2003-2004 school year to 72.2 percent this year.
(One district evening program to help students who have left school to get their high school diplomas saw a slightly higher rate of increase, 35.4 percent, in the percentage of low-income students enrolled.)Related: Madison Schools’ Measures of Academic Progress (MAP) Assessment Results Released.
Seattle’s Low Stakes Testing Trap
Those with a mind for controversy or whimsy may recall the outrage last year over a certain talking pineapple on the New York State eighth-grade reading exam. The unfortunate pineapple passage was sliced, diced, and served up as an example of all that is wrong with standardized testing. Asking students to inhabit the shared mental landscape of some chatty anthropomorphized forest animals and tropical fruit, as the questions did, was deemed both ridiculous and unfair. The author of the excerpted passage criticized the exam’s adaptation of his story as “barely literate.” And the state quickly announced that it would not count on the test’s scoring.
And so the talking pineapple joined the long tradition of conflict and contention over educational reform in America, from Thomas Jefferson’s revolutionary plan for public education in Virginia, to the Texas State Board of Education’s recent demotion of Jefferson from its ranks of revolutionary thinkers. The current obsession with testing (and pineapples) belongs to the standards movement, which began in the nineteen-eighties. Now, one of its more unusual battles is being fought in Seattle, where, in December, teachers at Garfield High School voted to boycott the Northwest Evaluation Association’s Measures of Academic Progress (MAP) exam.
The Garfield teachers are not boycotting all standardized tests. Their complaints, as outlined by Kris McBride, the school’s testing coördinator, are focussed squarely on the MAP, which, as an assessment tool, can be categorized as a low-stakes test: according to the MAP-makers at the N.W.E.A., it is an “interim assessment.”
Syria’s education crisis, in three charts
A new assessment released today by the United Nations Children’s Fund estimates that some Syrian children have missed out on as much as two years of education in the midst of their country’s ongoing civil struggle.
“The education system in Syria is reeling from the impact of violence,” said Youssouf Abdel-Jelil, UNICEF’s Syria representative, in a statement. “Syria once prided itself on the quality of its schools. Now it’s seeing the gains it made over the years rapidly reversed.”
According to the report, schools are increasingly being used by armed groups and displaced persons seeking shelter. More than 1,500 schools have been damaged or converted into shelters, a problem illustrated in the map above.
Testing Teachers
There has been a lot of controversy about whether student assessments should be used to evaluate K-12 teachers. The media is full of debate about this topic (e.g., Wall Street Journal) and the Seattle Times has had many editorials pushing for the use of assessments such as MAP to evaluate teachers. And several foundations, supported by rich contributors, like the League of Education Voters and the Gates Foundation, are pushing teacher evaluation through student assessments.
I would like to argue that using student assessments to evaluate teachers not only has issues, but is putting the cart before the horse. First, we need to test teachers in a robust way to evaluate their knowledge of the subjects they are teaching and only allow teachers with strong subject knowledge to teach.
Accountability: Report card scores for most Madison schools take small hit
Matthew DeFour, via a kind reader’s email
The report card scores of nearly all Madison schools will be reduced slightly after the district discovered it had reported incorrect student attendance data to the state and revised it.
In most cases the new, lower scores — which the Department of Public Instruction plans to update on its website next week — have no impact on the rating each Madison school receives on the report card. But six schools will be downgraded to a lower category.
Randall and Van Hise elementaries, which were rated in the highest performance category, are now in the second-highest tier. Olson and Chavez elementaries are now in the middle tier. And Mendota and Glendale elementaries are in the second-lowest tier.
The corrections — prompted by a State Journal inquiry — have no immediate practical ramifications, though the implications are significant as state leaders contemplate tying school funding to the report card results.
Adam Gamoran, director of the Wisconsin Center for Education Research, said it’s “extremely important” that the data used to rate schools is accurate. The report cards are part of the state’s new school accountability system, and DPI has proposed directing resources to schools struggling in certain categories.
“The report cards are only as good as the data that goes into them,” he said.Props to DeFour and the Wisconsin State Journal for digging and pushing.
Related: Madison Mayor Paul Soglin: “We are not interested in the development of new charter schools”.
Where does the Madison School District Get its Numbers from?
Global Academic Standards: How we Outrace the Robots and www.wisconsin2.org.
An Update on Madison’s Use of the MAP (Measures of Academic Progress) Assessment, including individual school reports. Much more on Madison and the MAP Assessment, here.
I strongly support diffused governance of our public schools. One size fits all has outlived its usefulness.
Madison School District Excellence Gaps / Differentiation Range in Classrooms
Lorie Raihala, via a kind email:
At the recent WATG conference in Sheboygan, Wisconsin, Dr. Scott Peters from the UW Whitewater gave a presentation on “Data-Based Curriculum for RtI Implementation (Including Gifted Ed).” Dr. Peters spends a lot of time analyzing data. One thing he has discovered is just how wide the “excellence gaps” are in Madison. Take a look at this website, where you can view the breakdown of “advanced” WKCE scores for specific MMSD schools according to race/ethnicity and economic status: WINNS. You can also change variables to compare results by subject over the past several years.
For Dr. Peters’s “Data-Based Curriculum” presentation, he gave audience members sample MAP score reports for a sixth grade classroom, along with a sheet of sample MAP questions that showed what students at the various score levels can be expected to do. The range in “Reading” scores extended from the 1st to the 90th percentile, with all points between. This range in reading levels represents the difference between, for instance, this question:
Which is a toy?
1. chair
2. shirt
3. ball
4. cookie
and this question:
Read the passage.
Our database of more than 3,000 articles of documented investigations is an easy-to-use tool for scientific research. Users may look for a general topic or narrow their search through the use of three topic code parameters…[passage continues, and then there’s a chart].
How does the chart complement the text?
1. It summarizes the text.
2. It provides detail not in the text.
3. It serves to contrast information in the text.
4. It provides transition between the two parts of the text.
Can you imagine having to stretch this far to reach students in your classroom? Dr. Peters’s concluding recommendation was for schools to use assessment data to compose classrooms that would limit the range each teacher must stretch in order to reach most students.
* The “WINNS” information is based on the oft-criticized, weak WKCE.
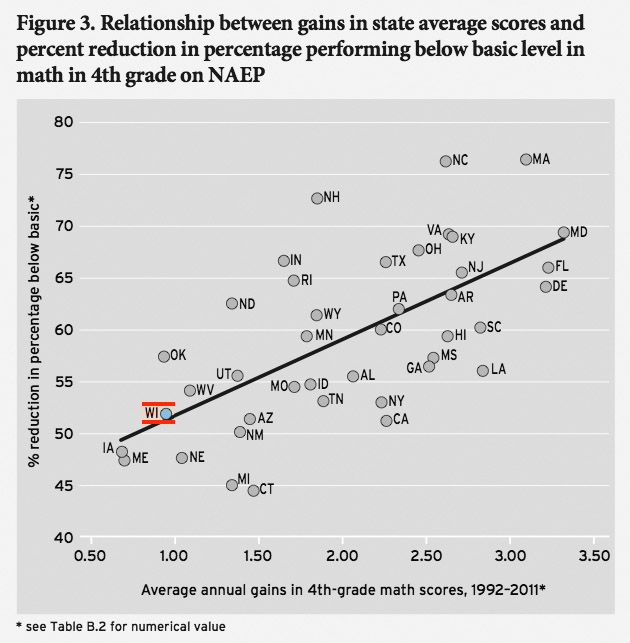
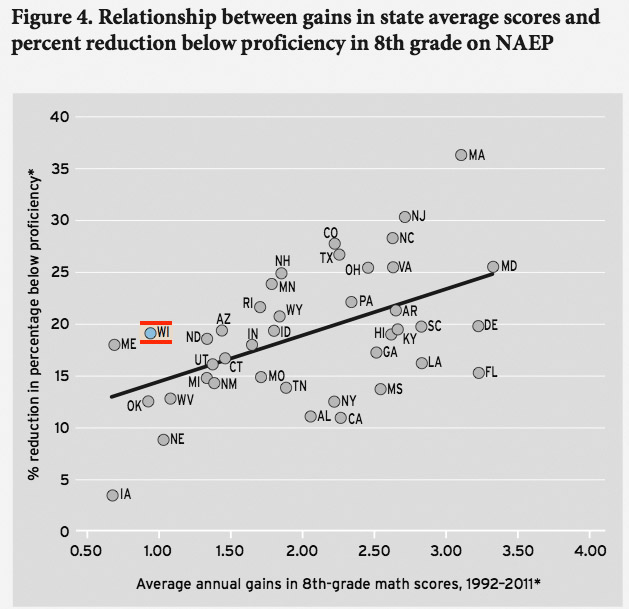
Achievement Growth: International and U.S. State Trends in Student Performance; Wisconsin near the bottom….
(Tap or click to view a larger version)
Eric A. Hanushek, Paul E. Peterson & Ludger Woessmann“The United States’ failure to educate its students leaves them unprepared to compete and threatens the country’s ability to thrive in a global economy.” Such was the dire warning recently issued by a task force sponsored by the Council on Foreign Relations.
Chaired by former New York City schools chancellor Joel I. Klein and former U.S. secretary of state Condoleezza Rice, the task force said that the country “will not be able to keep pace–much less lead–globally unless it moves to fix the problems it has allowed to fester for too long.”
The report’s views are well supported by the available evidence. In a 2010 report, only 6 percent of U.S. students were found to be performing at the advanced level in mathematics, a percentage lower than those attained by 30 other countries.ii Nor is the problem limited to top-performing students.
Only 32 percent of 8th- graders in the United States are proficient in mathematics, placing the United States 32nd when ranked among the participating international jurisdictions. Although these facts are discouraging, the United States has made substantial additional financial commitments to K-12 education and introduced a variety of school reforms.
Have these policies begun to help the United States close the international gap?
Progress was far from uniform across the United States, however. Indeed, the variation across states was about as large as the variation among the countries of the world. Maryland won the gold medal by having the steepest overall growth trend. Coming close behind, Florida won the silver medal and Delaware the bronze. The other seven states that rank among the top-10 improvers, all of which outpaced the United States as a whole, are Massachusetts, Louisiana, South Carolina, New Jersey, Kentucky, Arkansas, and Virginia.
Iowa shows the slowest rate of improvement. The other four states whose gains were clearly less than those of the United States as a whole, ranked from the bottom, are Maine, Oklahoma, Wisconsin, and Nebraska. Note, however, that because of nonparticipation in the early NAEP assessments, we cannot estimate an improvement trend for the 1992-2011 time period for nine states–Alaska, Illinois, Kansas, Montana, Nevada, Oregon, South Dakota, Vermont, and Washington.Related:

Advocating More Rigorous Wisconsin Academic Standards
Wisconsin State Journal Editorial:
Similarly, Wisconsin is now in the process of raising its academic standards and its ability to accurately gauge student, teacher and school performance.
This is a good thing, too — even though ratings for many students and some schools will fall when initially put into place. It’s not that students will be learning less. It’s that more rigorous instruction and assessments are coming on board.
Our students, parents, teachers and taxpayers deserve this more accurate picture of progress toward higher goals — the ones Wisconsin will need to meet to succeed in the knowledge-based, highly competitive global economy.Related: wisconsin2.org”: and Madison MAP Testing Shows They are Falling Short Too.
Big changes in the works for Madison’s 2012-13 school year
Wisconsin students, parents, teachers and property owners will feel the impact of major changes rolling out in Wisconsin’s public schools this school year.
This fall for the first time:
- The state will assign numerical ratings to schools based on various test score measures.
- Most students will start to see a new, more specific curriculum — in math and language arts, and with literacy incorporated in all subjects — in anticipation of a new state test in two years.
- And dozens of schools, including three in Madison, will take part in the state’s new teacher evaluation system, which takes into account student test scores.
“This is huge,” State Superintendent Tony Evers said. “I’ve been doing this for 37 years and I haven’t seen this level of reform efforts.”
The unifying reason for the changes is the end of the No Child Left Behind era and the national move toward a more rigorous set of standards for what students are expected to know at each grade level, said Adam Gamoran, director of the Wisconsin Center for Education Research at UW-Madison. In order to obtain a waiver from NCLB, Wisconsin had to adopt the accountability system, higher curriculum standards and a teacher evaluation system.
“This has nothing to do with the turmoil we experienced in Wisconsin last year,” Gamoran said. “This is happening in every state in the country.”Related:
- Education wake-up call is looming
- Madison Schools’ Measures of Academic Progress (MAP) Assessment Results Released
- 60% to 42%: Madison School District’s Reading Recovery Effectiveness Lags “National Average”: Administration seeks to continue its use
- Budget Cuts: We Won’t Be as Bold and Innovative as Oconomowoc, and That’s Okay.
- wisconsin2.org
Robots Are Grading Your Papers! The fact is: Machines can reproduce human essay-grading so well
“Insufficient number of supporting examples. C-minus. Meep.” (Photo by Flickr/CC user geishaboy500)
A just-released report confirms earlier studies showing that machines score many short essays about the same as human graders. Once again, panic ensues: We can’t let robots grade our students’ writing! That would be so, uh, mechanical. Admittedly, this panic isn’t about Scantron grading of multiple-choice tests, but an ideological, market- and foundation-driven effort to automate assessment of that exquisite brew of rhetoric, logic, and creativity called student writing. Without question, this study is performed by folks with huge financial stakes in the results, and they are driven by non-education motives. But isn’t the real question not whether the machines deliver similar scores, but why?
It seems possible that what really troubles us about the success of machine assessment of simple writing forms isn’t the scoring, but the writing itself – forms of writing that don’t exist anywhere in the world except school. It’s reasonable to say that the forms of writing successfully scored by machines are already – mechanized forms – writing designed to be mechanically produced by students, mechanically reviewed by parents and teachers, and then, once transmuted into grades and sorting of the workforce, quickly recycled. As Evan Watkins has long pointed out, the grades generated in relation to this writing stick around, but the writing itself is made to disappear. Like magic? Or like concealing the evidence of a crime?
The Pen is Advanced Technology
Of course all machines, from guitars to atom bombs, have no capacity to achieve any goals on their own. Nonetheless detractors of machine grading point out the obvious, that machines don’t possess human judgement, as if they possessed some other, alien form of reasoning. Computers can’t actually read the papers, they insist. Computers aren’t driven by selfless emotions, such as caring about students. Faced with proof that human test graders don’t always meaningfully read the papers or care about students, machine-grading detractors pull the blankets over their heads and howl: But they’re not human, damn it!
But the evidence keeps piling up. Machines successfully replicate human mass-scoring practices of simple essay forms, including the “source-based” genre. After reading reports released on the topic for nearly twenty years now, most working teachers of student writing grumble for a while, then return to the stack of papers at their elbow-and grade them mechanically.
The fact is: Machines can reproduce human essay-grading so well because human essay-grading practices are already mechanical.
To be sure, these results are usually derived from extremely limited kinds of writing in mass-scoring situations. They are easily defeated by carefully constructed “bad faith” responses. Since machines don’t read, they don’t comprehend the content, and cannot give feedback on rhetorical choices and many aspects of style. They can-and do-give feedback on surface features and what is sometimes called, more appropriately than ever, mechanical correctness. They cannot assess holistically, but can provide a probabilistic portrait by assembling numerous proxies, usually the same as those that human teachers use to substantiate holistic judgments, such as complexity of word choice and variety of sentence construction. Automated scoring can detect rhetorical dimensions of an essay, including the presence of evidence and the syntax used in simple argument.
Humans Acting Badly
Developers of these programs generally admit these limitations, primarily offering automation as an alternative to human graders in mass-assessment circumstances. When performed by humans, large-scale scoring of simple writing is commonly outsourced to poorly paid, under-qualified, overworked temps managed by incompetent greed-merchants in the scandal-ridden standardized testing industry.
Like the machines that replicate their efforts so well, the humans working in mass writing assessment are working to cookie-cutter specifications. They are not providing meaningful feedback on content. Spending a minute or two on a few hundred words, they are generally not “reading,” but scanning for many of the same characteristics that machine scorers are programmed to do. Like factory workers, they are providing results as quickly and cheaply as possible in order to line their employers’ pockets. Routinized, working to narrow formula, scanning superficially for prescribed characteristics at high speed, often incompetently managed and administered, most mass graders perform robotically.
Reading like a confessional “I was an economic hit man” for managed instruction, Making the Grades by Todd Farley chronicles one temp essay-scorer’s rise to high living at the pinnacle of mass testing’s profit-accumulation scheme. Riding in hired cars through burned-out public school districts to eat exotic meals prepared by celebrity chefs, Farley details how the for-profit scheme of high-stakes testing forces public-school teachers, students and parents on a faux-learning assembly line featuring teaching as test-prep drill instruction with 60 students in a class.
But Are Robots Also Teaching?
Teaching and test-scoring are very different circumstances. The fact that test scorers act mechanically doesn’t mean that teachers do. Except that most teachers are under very similar pressures-too many students, too little time, intense bureaucratic control, insufficient training, insufficient rewards to recruit and retain talent, and pedagogically unsound working conditions.
Just like teachers of other subjects, high school writing teachers are expected to “teach to the test,” usually following a rigid curriculum tailored to produce essays that do well in the universe of mechanical scoring, whether that mechanical scoring is provided by machines or degraded humans. Because of the high stakes involved, including teacher pay and continuing employment, the assessment drives the rest of the process. There are plenty of teachers who have the ability to teach non-mechanical forms of writing, but few are allowed to do so.
This managed–often legislated–pedagogy generally fails. Mechanical writing instruction in mechanical writing forms produces mechanical writers who experience two kinds of dead end: the dead end of not passing the mechanical assessment of their junk-instructed writing, and the dead end of passing the mechanical assessment, but not being able to overcome the junk instruction and actually learn to write.
As bad as this pedagogy’s failure is its successes. Familiar to most college faculty is the first-year writing student who is absolutely certain of their writing performance. She believes good writing is encompassed by surface correctness, a thesis statement, and assiduous quote-farming that represents “support” for an argument ramified into “three main points.”
In reality, these five-paragraph essays are near-useless hothouse productions. They bear the same relationship to future academic or professional writing as picking out “Chopsticks” bears to actually playing music at any level. Which is to say, close to none.
But students, particularly “good” students, nonetheless have terrific confidence in these efforts because they’ve been mechanically assessed by caring human beings who are, reasonably enough, helping them through the gates represented by test after test that looks for these things.
Not everything that teachers do is mechanical, but the forces of standardization, bureaucratic control, and high-stakes assessment are steadily shrinking the zone in which free teaching and learning can take place. Increasingly, time spent actually teaching is stolen from the arid waste of compulsory test preparation-in writing instruction as much as in every other subject. In this, teachers resemble police officers, nurses, and other over-managed workers, who have to steal time from their personal lives and from management in order to actually do law enforcement or patient care, as The Wire points out.
What Would Be Better?
Rebecca Moore Howard is a researcher in one of the nation’s flagship doctoral institutions in writing studies, the program in Composition and Cultural Rhetorics at Syracuse University. Howard’s Citation Project explores the relationship of college writers to source material. The first major findings of the 20-researcher project, conducted at 16 campuses? Even academically successful students generally don’t understand the source material on which they draw in their school writing.
Howard employs the term “patchwriting” to describe one common result of what I have long called the”smash and grab” approach that students employ to produce what we encourage them to pass off as “researched writing:” Scan a list of abstracts like a jewelry store window. Punch through the plate glass to grab two or three arguments or items of evidence. Run off. Re-arrange at leisure. With patchwriting, students take borrowed language and make modest alterations, usually a failed attempt at paraphrase. Together with successful paraphrase and verbatim copying, patchwriting characterizes 90 percent of the research citations in the nearly 2,000 instances Howard’s team studied at a diverse sampling of institutions. Less than 10 percent represented summary of the sense of three or more sentences taken together.
My own take on this research is that it strongly suggests the need for a different writing pedagogy. These students aren’t plagiarists. Nor are most of them intrinsically bad writers, whatever that might mean. Instead, I believe they’ve been poorly served by ill-conceived mass instruction, itself a dog wagged by the tail of mass assessment.
Like most of the students I’ve seen in two decades of teaching at every level including doctoral study, they have no flipping idea of the purpose of academic and professional writing, which is generally to make a modest original contribution to a long-running, complicated conversation.
To that end, the indispensable core attribute of academic writing is the review of relevant scholarly literature embedded within it. An actual academic writer’s original contribution might be analytical (an original reading of a tapestry or poem). Or it might be the acquisition or sorting of data (interviews, coding text generated in social media, counting mutations in an insect population). It might be a combination of both. In all of these cases, however, an actual academic writer includes at least a representative survey of the existing literature on the question.
That literature review in many circumstances will be comprehensive rather than merely representative. It functions as a warrant of originality in both professional and funding decisions (“We spent $5-million to study changes in two proteins that no other cancer researcher has studied,” or “No one else has satisfactorily explained Melville’s obsession with whale genitalia”). It offers a kind of professional bona fides (“I know what I’m talking about”). It maps the contribution in relation to other scholars. It describes the kind of contribution being made by the author.
Typically actual academic writers attempt to partly resolve an active debate between others, or answer a question that hasn’t been asked yet, what I describe to my students as “addressing either a bright spot of conflict in the map of the discourse, or a blank spot that’s been underexplored.”
In many professional writing contexts, such as legal briefing, literature review is both high-stakes and the major substance of the writing.
So why don’t we teach that relationship to scholarly discourse, the kind represented by the skill of summary in Howard’s research? Why don’t we teach students to compose a representative review of scholarship on a question? On the sound basis of a lit review, we could then facilitate an attempt at a modest original contribution to a question, whether it was gathering data or offering new insight.
The fact is, I rarely run into students at the B.A. or M.A. level who have been taught the relationship to source material represented by compiling a representative literature review. Few even recognize the term. When I do run into one, they have most commonly not been taught this relationship in a writing class, but in a small class in an academic discipline led by a practicing researcher who took the trouble to teach field conventions to her students.
Quote-Farming: So Easy a Journalist Can Do It
I personally have a lot of respect for journalists, and sympathize with their current economic plight, which is so similar to that of teachers and college faculty. They too do intellectual work under intense bureaucratic management and increasingly naked capitalist imperatives. So there are reasons why their intellectual product is often so stunted and deformed that the country turns to Jon Stewart’s parody of their work for information as well as critical perspective.
Albeit not always due to the flaws of journalists themselves: If there are real-world models for the poor ways we teach students to write, they’re drawn from newspaper editorials and television issue reporting. In editorials, “sources” are commonly authorities quoted in support of one’s views or antagonists to be debunked. In much television issue reporting, frequently composed in minutes on a deadline, quick quotes are cobbled together, usually in a false binary map of she’s-for-it and he’s-against-it. (NPR made headlines this year when it formally abandoned the fraudulent practice of representing or simulating balance by the common journalistic method of “he said, she said,” or reporting differing views, usually two, as if they held equal merit or validity, when in reality there can as easily be 13 sides, or just one, all with very different validity.)
Of course journalism can do better and often does, but it is some of journalism’s most hackneyed practices that have shaped traditional pedagogy for academic writing: quote-farming, argument from authority, false binarism, fake objectivity.
Those practices are intrinsically unappealing, but the real problem is the mismatch.
Academic writing bears a very different relationship to academic “sources” than journalism. For journalists in many kinds of reporting, academic sources are experts, hauled onto stage to speak their piece and shoved off again, perhaps never to be met with again.
It’s this sort of smash-and-grab, whether from the journalist’s Rolodex/smart phone, from a scholarly database, or the unfairly-blamed Google (as if this practice were invented by internet search!) that we teach to our students by requiring them to make thesis statements and arguments “supported by sources.”
For practicing academic and professional writers, other professional sources are rarely cited as authorities, except as representative of general agreement on a question. Most other citations are to the work of peer writers, flawed, earnest, well-meaning persons who have nonetheless overlooked an interesting point or two.
Surveying what these peers tried to do fully and fairly, and then offering some data or some insight to resolve an argument that some of them are having, or point to an area they haven’t thought about—is what we do. The substance of the originality in most academic and professional writing is a very modestly-framed contribution carefully interjected into a lacuna or debate between persons you will continue to interact with professionally for decades. In almost every respect it little resembles the outsized ambitions (let’s resolve reproductive rights in 600 words!) and modest discursive context (a news “peg”) of mass-mediated opinion.
Sure, no question, “everything’s an argument,” but argument or generic notions of persuasion used in the mass media aren’t always the best model for academic and professional discourse. (And I say this as someone who’s not afraid to argue.)
A big reason for the success of They Say/I Say, a popular composition handbook by Cathy Birkenstein and Jerry Graff, is its effort to provide an introduction to the actual “moves that matter in academic writing,” moves which generally involve relating one’s position to a complicated existing conversation.
Teaching & Grading Academic Writing By Persons Who Don’t Do It
What Becky Howard has in common with Birkenstein & Graff is valuing the ability to represent that complicated existing conversation. What is particularly useful to all of us is that they grasp that this is a problem that can’t be harrumphed out of existence-“Well, if those kids would actually read!” Let’s leave out the fact that most of the persons enrolled in higher ed aren’t kids, and that they do read, and write-a lot. Let’s leave out the whole package of dysfunctional pedagogies we impose on students and the contradictory narratives we tell about them: Large lecture classes are fine, but video capture of large lectures is bad! (Right, grandpa: it’s much better to deny me access to discussing the material with experienced faculty actively researching in their field because you’ve scaled her up with an auditorium sound system and not a video camera–that makes total sense. Defend the lecture hall!) As David Noble and I and others have pointed out many times: the reason current technologies don’t, won’t, and can’t eliminate the labor of actual teaching is the reason that earlier technologies, like the book, post office, television and radio did not: Actual teaching is dialogic and occurs in the exchange between faculty and students. The more exchange, the more learning. (Of course much of what is certified as learning isn’t anything of the kind.)
Our writing pedagogy is the main problem here what we ask faculty and teachers to do, who we ask to do it, and the ways we enable & disable them by bureaucracy and greed, whether the greed is for-profit accumulation or harvesting tuition dollars for in-house spending on a biochemist’s lab. (As I’ve previously insisted, the for-profits can accumulate capital with sleazy cheap teaching because the nonprofits do the same thing, except accumulating their capital as buildings & grounds, etc.)
One of the reasons students don’t learn to read academic articles and compose literature reviews in writing classes is that they are taught by persons who don’t do it themselves–nontenurable faculty, many without the Ph.D., or graduate students newly studying for it, many of whom don’t get an education in the practice themselves until they begin their own comprehensive lit review in preparation for a thesis. Often they are highly managed faculty, working like high-school teachers (except with much less training) to a scripted curriculum with mass syllabi, identical assignments that are easy to produce mechanically and grade mechanically-in a routinized “teaching” factory that is easy to assess mechanically, train mechanically, and supervise mechanically.
Unsurprisingly: No reliable computerized assessment can tell whether a review of scholarly literature is an accurate representation of the state of knowledge in a field. Nor can it adjudge whether a proposed intervention into a conflict or neglected area in that field is worthy of the effort, or help a student to refine that proposed experiment or line of analysis. Of course, many of the persons we presently entrust with writing instruction lack the ability, training, or academic freedom to do so as well.
If we are to do more with writing classes and writing assignments, we need to put aside the hysteria about machine grading and devote our attention to the mechanical teaching and learning environment in which we daily, all but universally, immerse our writing faculty. We need to change the kind of writing we ask them to teach. We need to enable writing faculty to actually do the kind of academic writing they should be teaching–which means changing our assumptions about how they’re appointed, supported, evaluated and rewarded. You want to be a machine-breaker and fix writing pedagogy? Great. Start with with your professional responsibility to address the working circumstances of your colleagues serving on teaching-only and teaching-intensive appointment.
Madison School District Identified for Improvement (DIFI); Documentation for the Wisconsin DPI
Madison School District Superintendent Dan Nerad 15MB PDF
1. Develop or Revise a District Improvement Plan
Address the fundamental teaching and learning needs of schools in the Local Education Agency (LEA), especially the academic problems o f low-achieving students.
MMSD has been identified by the State of Wisconsin as a District Identified for Improvement, or DIFI. We entered into this status based on District WKCE assessment scores. The data indicates that sub-groups of students-African American students, English Language Learner Students with Disabilities or Economically Disadvantaged -did not score high enough on the WKCE in one or more areas of reading, math or test participation to meet state criteria.
Under No Child Left Behind, 100% of students are expected to achieve proficient or advanced on the WKCE in four areas by 2014. Student performance goals have been raised every year on a regular schedule since 2001, making targets more and more difficult to reach each year. In addition to the curriculum changes being implemented, the following assessments are also new or being implemented during the 2011-12 school year (see Attachment 1):
- The Measures of Academic Progress (MAP): Grades 3-7. MAP is incorporated into the MMSD Balanced Assessment Plan as a computer adaptive benchmark assessment tool for grades 3-7. Administration of the assessment was implemented in spring, 2011.
- Cognitive Ability Test (CogAT): Grades 2 and 5. As proposed in the Talented and Gifted Plan approved by the Board of Education in August, 2009, the district requested approval of funds to purchase and score the Cognitive Ability Test (CogAT) which was administered in February, 2011, to all second and fifth graders.
- The EPAS System: Explore Grades 8-9, Plan Grade 10, ACT Grade 11. The EPAS system provides a longitudinal, systematic approach to educational and career planning, assessment, instructional support, and evaluation. The system focuses on the integrated, higher-order thinking skills students develop in grades K-12 that are important for success both during and after high school. The EPAS system is linked to the College and Career Readiness standards so that the information gained about student performance can be used to inform instruction around those standards.
Attached are six documents describing programs being implemented for the 2011-12 school year to address the needs of all students.
1. Strategic Plan Document: Year Three (Attachment 2)
2. Strategic Plan Summary of Three Main Focus Areas (Attachment 3)
3. Addressing the Needs of All Learners and Closing the Achievement Gap Through K-12 Alignment (Attachment 4)
4. Scope and Sequence (Attachment 5)
5. The Ideal Graduate from MMSD (Attachment 6)
6. 4K Update to BOE- Program and Sites- (Attachment 7)Clusty Search: District Identified for Improvement (DIFI)
Matthew DeFour:Madison School District administrators aren’t keeping track of the best classroom instruction. Not all principals create a culture of high expectations for all students. And teachers aren’t using the same research-based methods.
Such inconsistencies across the district and within schools — stemming from Madison’s tradition of school and teacher autonomy — are hurting student achievement, according to a district analysis required under the federal No Child Left Behind law.
“There are problems within the entire system,” Superintendent Dan Nerad said. “We do have good practice, but we need to be more consistent and have more fidelity to our practices.”
Inconsistencies in teaching and building culture can affect low-income students, who are more likely to move from school to school, and make teacher training less effective, Nerad said.
The analysis is contained in an improvement plan the district is scheduled to discuss with the School Board on Monday and to deliver next week to the state Department of Public Instruction.
1 in 4 students can pass geography exam
Do you know who is responsible for collecting fuel wood and water for families in East Africa?
Can you identify South America by looking at a diagram of its elevation changes in profile?
Those are sample questions found on the National Assessment of Educational Progress geography assessment test for 12th-grade students this year.
If you don’t know the answers, you’re not alone. Only 25 percent of American students passed the test.
It’s a far cry from most people’s perception of geography skills, such as identifying a river or mountain range on a map. It’s one of the main reasons the subject doesn’t get the same attention as others, such as math and English.
Wisconsin Read to Lead Task Force 8.25.2011 Meeting Summary
Wisconsin Reading Coaltion, via a kind reader’s email:
Summary of the August 25, 2011 Read to Lead Task Force Meeting
Green Bay, WI
The fifth meeting of the Read to Lead task force was held on August 25, 2011, at Lambeau Field in Green Bay. Governor Walker was delayed, so State Superintendent Tony Evers opened the meeting. The main topic of discussion was accountability for reading outcomes, including the strategy of mandatory grade retention. Troy Couillard from DPI also presented an overview of reading reform in Milwaukee Public Schools.
Accountability
Superintendent Evers said that Wisconsin will seek a waiver from the No Child Left Behind proficiency requirements by instituting a new system of accountability. His Educator Effectiveness and Accountability Design teams are working on this, with the goal of a new accountability system being in place by late 2011.
Accountability at the educator level:
The concept of using student achievement or growth data in teacher and principal evaluations is not without controversy, but Wisconsin is including student data in its evaluation model, keeping in mind fairness and validity. The current thought is to base 50% of the educator evaluation on qualitative considerations, using the Danielson Framework http://www.danielsongroup.org (“promoting professional learning through self assessment, reflection on practice, and professional conversations”), and 50% on student data, including multiple measures of performance. 10% of the student data portion of the evaluation (5% of the total evaluation) would be based on whole-school performance. This 5% would be based on a proficiency standard as opposed to a value-added measurement. The 5% is thought to be small enough that it will not affect an individual teacher adversely, but large enough to send a message that all teachers need to work together to raise achievement in a school. The task force was asked if it could endorse whole-school performance as part of teacher evaluation. The task force members seemed to have some support for that notion, especially at the principal level, but had some reservations at the level of the individual teacher.
Kathy Champeau was concerned that some schools do not have the resources to serve some children. She also felt it might not be fair to teachers, as they have no control over other teachers in the school or the principal.
Steve Dykstra said it is important to make sure any value-added system is designed to be fair.
Rachel Lander felt it would be better to use value-added data for whole-school performance rather than a proficiency standard, but supported the importance of schoolwide standards.
Rep. Steve Kestell supported the 5% requirement, and questioned what the qualitative half of the evaluation would be based on. He felt perhaps there could be some schoolwide standards to be met in that part of the evaluation, also.
Tony Evers responded that the Danielson Framework was research-based observations, and that the evaluators would need to be highly trained and consistent in their evaluations.
Tony Pedriana had questions about the type of research on which the Danielson Framework is based.
Evers said he would provide further information to the task force.
Mara Brown said she cannot control what the teacher down the hall does, and that the 5% should apply only to principals.
Linda Pils agreed with the 5%, but felt principals need to be watching and guiding new teachers. She agreed with Dykstra’s comments on measuring growth.
Sen. Luther Olsen was concerned that the 5% portion of a teacher’s evaluation may be the part that tips the balance on job retention for an individual, yet that individual has no control over whole-school performance. He understood the principle of getting everyone involved and committed to a goal, but was concerned with possible consequences.
Mandatory Retention:
The task force was asked to consider whether Wisconsin should implement a mandatory retention policy. If so, what would it look like, and if not, what can be done to make sure students are reading at grade level?
After a guest presentation and discussion, the consensus of the task force was that Wisconsin should not have mandatory retention. Reasons cited were negative effects on later achievement, graduation, self esteem, and psychological well-being. Third grade was felt to be far too late to start intervention, and there needs to be more emphasis on developing teacher expertise and focusing on the responsibility of teachers, principals, and higher education as opposed to threatening the students with retention. Retention without changing the curriculum for the student the following year is pointless.
Dr. Elaine Allensworth, a director at the Consortium on Chicago School Research, joined the task force by telephone to summarize the outcomes of a mandatory retention project in Chicago. Students more than 1 year below the cut-off level on certain tested skills were retained unless they passed the test after a summer bridge program. Students identified as at-risk were given after-school tutoring during the year. Retention was thought to have three primary mechanisms that would affect student performance: motivation for students, families, and teachers to work harder, supplemental instruction after school and during the summer, and an additional year in the grade for failing students. All students in the school could be affected by the motivation and the supplemental instruction, but only the retained students by the extra year of instruction. The study found that the threat of retention worked as a positive motivator for teachers, parents, and some older students. However, there were also negatives in terms of higher-achieving students receiving less attention, more time on test preparation, and an instructional shift to focus on tested skills. The supplemental instruction, especially the summer bridge program, was the biggest positive of the retention project. There was high participation, increased personal attention, and higher-quality instruction. Retention itself had more negative effects than positive. Academic gains were either non-existent or rapidly-disappearing. Multiple year retentions resulted in a problematic mix of ages in classrooms, students unable to finish high school by age 18, and a negative overall attitude toward school.
Dykstra said it appeared that the impetus to do things differently because of the threat of retention had some benefit, but the actual retention had either no effect or a negative effect. He wondered if there was some way to provide the motivation without retention.
Allensworth agreed that the challenge was to provide a motivation without having a threat.
Pils asked if third graders could even understand the threat of retention.
Allensworth replied that they understood if teachers helped them. She also said that some schools with low-quality instruction had no way to improve student learning even with the threat of retention.
Rep. Jason Fields asked how you could avoid teaching to the test.
Allensworth replied that teaching the skills on the test was productive, but not the excessive time that was spent on test-taking strategies. She also said the tendency to teach more narrowly could cause problems later in high school where students needed to be able to participate in broader learning.
Marcia Henry inquired about students who returned to their old rate of learning when they returned to the regular classroom after successfully completing the summer bridge.
Allensworth replied that the summer program used higher quality curriculum and teachers, there was more time provided with students, and the students were more highly motivated.
Dykstra asked if it was possible to determine how much of the summer gain was due to student motivation, and how much due to teachers or parents.
Allensworth said those factors could not be pulled apart.
Champeau questioned whether the summer bridge program taught to the test.
Allensworth replied that it taught in a good way to the skills that the test assessed.
Brown asked if intervention was provided for the first time in third grade.
Allensworth replied that some schools began providing intervention and retaining in first or second grade.
Dykstra asked if the project created a situation where a majority of the school’s resources were concentrated in third grade, leaving other grades short.
Allensworth said they didn’t look at that, though some schools appeared to put their better teachers at certain grades.
Dykstra thought it was the wrong approach to tie services and supports to a specific grade rather than a specific student.
Are some types of consequences necessary to achieve the urgency and intensity necessary for performance improvement? Should there be mandatory summer school or other motivators? The task force did not seem to arrive at a consensus on this.
Lander said schools need the resources to do early intervention, plus information on what should be done in early intervention, and this is not currently the case in Wisconsin.
Pils questioned where teachers would find the time to provide intervention. She liked the idea of after-school and summer programs as well as reading the classics to kids. Providing a model of best instruction is important for teachers who don’t have that background.
Mary Read commented on Bill Gates’ experience with spending a lot of money for minimal results, and the conclusion that money needs to go into teacher training and proven programs such as the Kipp schools or into a national core curriculum.
Dykstra noted that everyone agrees that teacher training is essential, but there is disagreement as to curriculum and training content. His experience is that teachers are generally unable to pinpoint what is going wrong with a student’s reading. We must understand how poor and widespread current teacher training is, apologize to teachers, and then fix the problem, but not at teachers’ expense.
The facilitators asked what the policy should be. Is there an alternative to using retention? Should teacher re-training be mandatory for those who need the support?
Evers said that a school-by-school response does not work. The reforms in Milwaukee may have some relevance.
Olsen suggested that there are some reading programs that have been proven successful. If a school is not successful, perhaps they should be required to choose from a list of approved instructional methods and assessment tools, show their results, and monitor program fidelity. He feels we have a great resource in successful teachers in Wisconsin and other states, and the biggest issue is agreeing on programs that work for intervention and doing it right the first time.
Kestell said some major problems are teachers with high numbers of failing students, poor teacher preparation, the quality of early childhood education, and over-funding of 4K programs without a mandate on how that money is used. There has been some poor decision-making, and the kids are not responsible for that. We must somehow hold schools, school board, and individual educators accountable.
Champeau said teachers have no control over how money is spent. This accountability must be at the school and district level. More resources need to be available to some schools depending on the needs of their student population.
Lander: We must provide the necessary resources to identified schools.
Dykstra: We must develop an excellent system of value-added data so we can determine which schools are actually doing well. Right now we have no way of knowing. High-performing schools may actually be under-performing given their student demographics; projected student growth will not be the same in high and low performing schools.
Pedriana: We have long known how to teach even the most at-risk readers with evidence-based instruction. The truth is that much of our teacher training and classroom instruction is not evidence-based. We need the collective will to identify the evidence base on which we will base our choices, and then apply it consistently across the state. The task force has not yet taken on this critical question.
Pils: In her experience, she feels Wisconsin teachers are among the best in the country. There are some gaps we need to close.
Pedriana: Saying how good we are does not help the kids who are struggling.
Pils: We need to have our best teachers in the inner city, and teachers should not need to purchase their own supplies. We have to be careful with a limited list of approved programs. This may lead to ethics violations.
Pedriana: Referring to Pils’ mention of Wisconsin’s high graduation rates in a previous meeting, what does our poor performance on the NAEP reading test say about our graduation standards?
Michael Brickman (Governor’s aide): There is evidence of problems when you do retention, and evidence of problems when you do nothing. We can’t reduce the failing readers to zero using task force recommendations, so what should we do with students who leave 3rd grade not reading anywhere near grade level? Should we have mandatory summer school?
Henry: Response to Intervention (RTI) is a perfect model for intervening early in an appropriate way. A summer bridge program is excellent if it has the right focus. We must think more realistically about the budget we will require to do this intervention.
Olsen: If we do early intervention, we should have a very small number of kids who are still behind in 3rd grade. Are we teaching the right, most efficient way? We spend a lot of money on K-12 education in Wisconsin, but we may need to set priorities in reading. There is enough money to do it. Reading should be our mission at each grade level.
Facilitator: What will be the “stick” to make people provide the best instruction?
Dykstra: Accountability needs to start at the top in the state’s education system. When the same people continue to make the same mistakes, yet there are no consequences, we need to let some people go. That is what they did in Massachusetts and Florida: start with two or three people in whom you have great confidence, and build from there.
Facilitator: Is there consensus on mandatory summer school for failing students?
Michele Erickson: Summer school is OK if the right resources are available for curriculum and teachers.
Kestell: All grades 4K – 3 are gateway grades. They are all important.
Champeau: Summer school is a good idea, but we would need to solve transportation issues.
Dykstra: We should open up the concept of summer school beyond public schools to any agency that offers quality instruction using highly qualified instructors from outside the educational establishment.
Lander: Supports Dykstra’s idea. You can’t lay summer instruction on schools that can hardly educate during the school year.
Brown: Could support summer school in addition to, but not in place of, early intervention during the school year.
Erickson: Look at the school year first when allocating resources. Summer school is a hard sell to families.
Pedriana: Agrees with Olsen that we probably have sufficient funds for the school year, but we need to spend it more wisely. We cannot expect districts to make the commitment to extra instruction if there is no accountability at the top (including institutions of higher education). We need to resolve the issue of what knowledge and content standards will be taught before we address summer school or other issues.
Milwaukee Public Schools’ tiered RTI system was presented by DPI’s Troy Couillard as an example of an accountability system. MPS chose a new core reading program for 2010-11 after submitting its research base to DPI. Teachers were provided with some in-service training, and there are some site checks for fidelity of implementation. Tier 2 interventions will begin in 2011-12, and Tier 3 interventions in 2012-13. He felt that the pace of these changes, plus development of a data accountability system, student screening with MAP and other testing, progress monitoring, and professional development, has MPS moving much faster than most districts around the county on implementing RTI. DPI embedded RTI in the district’s Comprehensive Literacy Plan. DPI is pushing interventions that are listed on the National RTI site, but teachers are allowed to submit research for things they are using to see if those tools might be used.
Pils: Kids in MPS are already struggling. Reading First would suggest that they have 120 minuets of reading a day instead of the 90 minutes provided in the MPS plan.
Couillard: Tier 2 intervention for struggling students will add onto the 90 minutes of core instruction.
Olsen: Can this system work statewide without DPI monitoring all the districts?
Couillard: Districts are trained to monitor their own programs.
Pils: Veteran schools with proven strategies could be paired with struggling schools as mentors and models.
Pedriana: We have no way of knowing what proven strategies are unless we discuss what scientific evidence says works in reading. The task force must grapple with this question.
Brickman: Read to Lead task force needs to start with larger questions and then move to finer grain; this task force may not be able to do everything.
Pedriana: Is there anything more important for this task force to do than to decide what evidence-based reading instruction is?
Brickman: Task force members may submit suggestions for issues to discuss at the final meeting in September. Tony could submit some sample language on “evidence-based instruction” as a starting point for discussion.
Henry: The worst schools should be required to at least have specific guidelines, whether it is a legislative or DPI issue. Teacher retraining (not a 1-day workshop) is a necessity. Teachers are unprepared to teach.
Olsen: Wisconsin has always been a local control state, but one of the outcomes of the task force may be that we have a method for identifying schools that are not doing well, and then intervene with a plan. The state is ultimately responsible for K-12 education. Districts should take the state blueprint or come up with their own for approval by the state.
Erickson: Can we define what will work so districts can just do it?
Evers: MPS experience shows there is a process that works, and districts can do their own monitoring.
Dykstra: Sees value in making a list of things that districts are not allowed to do in reading instruction; also value in making a list of recommended programs based on alignment with the convergence of the science of reading research. That list would not be closed, but it should not include programs based on individual, publisher-funded studies that do not align with the convergence of the science. This could be of benefit to all districts. Even those doing relatively well could be doing better. Right now there is no list, and no learning targets. The MPS plan contains the Wisconsin Model Early Learning Standards, which contain errors. DPI needs to correct that information and distribute it right now. That would be a good example of accountability at the state level.
Couillard: The new statewide data collection system will help districts monitor their own data.
Champeau: School needs change depending on demographics. The goal should be to build decision-making capacity at the local level, not dictation from outside. We should be talking more about people than programs. Have MPS teachers been doing a better job? What will they do if their program goes away? We need to work on the underlying expertise and knowledge base.
Facilitator: There appears to be agreement that the state can intervene in failing districts.
Lander: We might have some consensus as to what teachers need to know, and then go into schools to see if they know it. If not, we need to teach them.
Pedriana: What is so bad about providing a program, with training, of course? It would help people.
Facilitator: There is consensus around training of teachers.
Dykstra: Some of the distinction between training and programs is artificial. You need both.
Other things the state could require: weighting of reading in evaluation systems, grading of schools etc.
Dykstra: If giving schools grades, they should get separate grades for how they do in teaching separate content areas. In addition, everything should be reported in the best value-added system we can create, because it’s the only way to know if you’re doing a good job.
Pils: Doesn’t like grading of schools. She has a whole folder on cheating in districts that have grading of schools and high stakes tests.
Evers: Do we just want to measure what schools are doing, or do we want to use it to leverage change?
Erickson: Wisconsin has gone from 3rd to 30th on the NAEP, so of course we should be seeking change.
Walker: The idea is not to pick on failing schools, but to help them. We must be able to deploy the resources to the things that work in accordance with science and research to teach reading right.
Dykstra: We should seek small kernels of detailed information about which teachers consistently produce better results in a given type of school for a given type of student. There is a problem with reliability when using MAP data at an individual student level.
Supt. Evers talked about the new state accountability system as being a better alternative to no Child Left Behind. Governor Walker said the state is not just doing this as an alternative to NCLB, but in response to comments from business that our graduates are not well-prepared. Parents want to know what all schools are doing.
Olsen: We need a system to monitor reading in Wisconsin before we get into big trouble. Our changing population is leading us to discover challenges that other states have dealt with for years.
Kestell: The accountability design team is an excellent opportunity to discuss priorities in education; a time to set aside personal agendas and look for solutions that work.
Next Meeting/Status of Report
Michael Brickman will try to send out a draft of a report the week of August 29 with his best interpretation of task force consensus items. The final meeting will be Sept. 27, perhaps in Madison, Eau Claire, or Wausau. Some task force issues will need to be passed on to other task forces in the future.Related: A Capitol Conversation on Wisconsin’s Reading Challenges and Excellence in Education explains Florida’s reading reforms and compares Florida’s NAEP progress with Wisconsin’s at the July 29th Read to Lead task force meeting and www.wisconsin2.org.
Meeting test score standards – by lowering the bar
Today’s Wall Street Journal highlights a report for the U.S. Government’s National Center for Education Statistics. In case you have trouble following the link, here’s the discouraging news:
“Eight states have raised their standards for passing elementary-school math and reading tests in recent years, but these states and most others still fall below national benchmarks, according to a federal report released Wednesday.”
The data help explain the disconnect between the relatively high pass rates on many state tests and the low scores on the national exams, known as the National Assessment of Educational Progress.
July 29 Wisconsin Read to Lead task force meeting
The fourth meeting of the Governor’s Read to Lead task force took place in Milwaukee on Friday, July 29. The meeting was filmed by Wisconsin Eye, but we have not seen it offered yet through their website. We will send out a notice when that occurs. As always, we encourage you to watch and draw your own conclusions.
Following is a synopsis of the meeting, which centered on reading improvement success in Florida and previously-discussed task force topics (teacher preparation, licensing, professional development, screening/intervention, early childhood). In addition, Superintendent Evers gave an update on activity within DPI. The discussion of the impact of societal factors on reading achievement was held over to the next meeting, as was further revisiting of early childhood issues.
In addition to this summary, you can access Chan Stroman’s Eduphilia tweets at http://twitter.com/#!/eduphilia
Opening: Governor Walker welcomed everyone and stressed the importance of this conversation on reading. Using WKCE data, which has been criticized nationally and locally for years as being derived from low standards, the Governor stated that 80% of Wisconsin students are proficient or advanced in reading, and he is seeking to serve the other 20%. The NAEP data, which figured prominently in the presentation of the guest speakers, tell a very different story. Superintendent Evers thanked the task force members and indicated that this is all about “connecting the dots” and putting all of the “puzzle pieces” together. The work of this task force will impact the work going on in other education-focused committees.
The Florida Story: Guest speakers were Patricia Levesque, the Executive Director of the Foundation for Excellence in Education and the Foundation for Florida’s Future, and Mary Laura Bragg, the director of Florida’s statewide reading initiative, Just Read, Florida! from 2001 to 2006.
In a series of slides, Levesque compared Wisconsin, Florida, and national performance on the NAEP reading test over the past decade. Despite challenges in terms of English language learners, a huge percentage of students on free/reduced lunch, and a minority-majority demographic, Florida has moved from the scraping the bottom on the NAEP to the top group of states. Over the same time period, Wisconsin has plummeted in national ranking, and our students now score below the national average in all subgroups for which NAEP data is disaggregated. 10 points on the NAEP scale is roughly equivalent to one grade level in performance, and Florida has moved from two grade levels below Wisconsin to 1/2 grade level above. For a full discussion of Wisconsin’s NAEP performance, see our website, http://www.wisconsinreadingcoalition.org.
Levesque and Bragg also described the components of the reading initiative in Florida, which included grading all schools from A to F, an objective test-based promotion policy from third to fourth grade, required state-approved reading plans in each district, trained reading coaches in schools, research assistance from the Florida Center for Reading Research, required individual student intervention plans for struggling students, universal K-2 screening for reading problems, improved licensure testing for teachers and principals, the creation of a reading endorsement for teaching licenses, and on-line professional development available to all teachers. As noted above, achievement has gone up dramatically, the gap between demographic groups has narrowed, early intervention is much more common, and third grade retention percentages continue to fall. The middle school performance is now rising as those children who received early intervention in elementary school reach that level. Those students have not yet reached high school, and there is still work to be done there. To accomplish all this, Florida leveraged federal funds for Title 1 and 2 and IDEA, requiring that they be spent for state-approved reading purposes. The Governor also worked actively with business to create private/public partnerships supporting reading. Just Read, Florida! was able to engineer a statewide conference for principals that was funded from vendor fees. While Florida is a strong local control state, reading is controlled from the state level, eliminating the need for local curriculum directors to research and design reading plans without the resources or manpower to do so. Florida also cut off funding to university professors who refused to go along with science-based reading instruction and assessment.
Florida is now sharing its story with other states, and offering assistance in reading plan development, as well as their screening program (FAIR assessment system) and their online professional development, which cost millions to develop. Levesque invited Wisconsin to join Indiana and other states at a conference in Florida this fall.
Questions for, or challenges to, the presenters came from three task force members.
- Rachel Lander asked about the reading coaches, and Bragg responded that they were extensively trained by the state office, beginning with Reading First money. They are in the classroom modeling for teachers and also work with principals on understanding data and becoming building reading leaders. The coaches now have an association that has acquired a presence in the state.
- Linda Pils stated her belief that Wisconsin outperforms Florida at the middle school level, and that we have higher graduation rates than Florida. She cited opinions that third grade retention has some immediate effect, but the results are the same or better for non-retained students later, and that most retained students will not graduate from high school. She also pointed out Florida’s class size reduction requirement, and suggested that the NAEP gains came from that. Levesque explained that the retention studies to which Pils was referring were from other states, where retention decisions were made subjectively by teachers, and there was no requirement for science-based individual intervention plans. The gains for retained students in Florida are greater than for matched students who are not retained, and the gains persist over time. Further, retention did not adversely affect graduation rates. In fact, graduation rates have increased, and dropout rates have declined. The University of Arkansas is planning to do a study of Florida retention. The class size reduction policy did not take effect in Florida until last year, and a Harvard study concluded that it had no effect on student reading achievement. Task force member Steve Dykstra pointed out that you cannot compare the NAEP scores from two states without considering the difference in student demographics. Wisconsin’s middle school scores benefit from the fact that we have a relative abundance of white students who are not on free/reduced lunch. Our overall average student score in middle school may be higher than Florida, but when we compare similar cohorts from both states, Florida is far ahead.
- Tony Pedriana asked what kinds of incentives have been put in place for higher education, principals, etc. to move to a science-based system of instruction. The guests noted that when schools are graded, reading performance receives double weight in the formula. They also withheld funding for university programs that were not science-based.
DPI Update: Superintendent Evers indicated that DPI is looking at action in fours areas: teacher licensure, the Wisconsin Model Early Learning Standards, the use of a screener to detect reading problems, and implementation of the Common Core State Standards.
- The committee looking at licensing is trying to decide whether they should recommend an existing, off-the-shelf competency exam, or revise the exam they are currently requiring (Praxis 2). He did not indicate who is on the committee or what existing tests they were looking at. In the past, several members of the task force have recommended that Wisconsin use the Foundations of Reading test given in Massachusetts and Connecticut.
- DPI is revising the WMELS to correct definitions and descriptions of phonological and phonemic awareness and phonics. The changes will align the WMELS with both the Report of the National Reading Panel and the Common Core State Standards. Per the suggestion of Eboni Howard, a guest speaker at the last meeting, they will get an outside opinion on the WMELS when they are finished. Evers did not indicate who is doing this work.
- DPI is looking at the possibility of using PALS screening or some other tool recommended by the National RTI Center to screen students in grades K-2 or K-3. Evers previously mentioned that this committee had been meeting for 6-7 months, but he did not indicate who is on it.
- Evers made reference to communication that was circulated this week (by Dr. Dan Gustafson and John Humphries) that expressed concern over the method in which DPI is implementing the Common Core. He stated that districts have been asking DPI for help in implementing the CC, and they want to provide districts with a number of resources. One of those is the model curriculum being developed by CESA 7. DPI is looking at it to see how it could help the state move forward, but no final decision has yet been made.
Task force member Pam Heyde, substituting for Marcia Henry, suggested that it would be better to look at what Florida is doing rather than start from ground zero looking at guidelines. Patricia Levesque confirmed that Florida was willing to assist other states, and invited Wisconsin to join a meeting of state reading commissioners in October.
Teacher Preparation: The discussion centered around what needs to change in teacher preparation programs, and how to fit this into a four-year degree.
Steve Dykstra said that Texas has looked at this issue extensively. Most schools need three courses to cover reading adequately, but it is also important to look at the texts that are used in the courses. He referenced a study by Joshi that showed most of the college texts to be inadequate.
Dawnene Hassett, UW-Madison literacy professor in charge of elementary teacher reading preparation, was invited to participate in this part of the discussion. She indicated we should talk in terms of content knowledge, not number of credits. In a couple of years, teachers will have to pass a Teacher Performance Assessment in order to graduate. This was described as a metacognitive exercise using student data. In 2012-13, UW-Madison will change its coursework, combining courses in some of the arts, and dropping some of the pedagogical, psychological offerings.
Tony Pedriana said he felt schools of education had fallen down on teaching content derived from empirical studies.
Hassett said schools teach all five “pillars” of reading, but they may not be doing it well enough. She said you cannot replicate classroom research, so you need research “plus.”
Pils was impressed with the assistance the FCRR gives to classroom teachers regarding interventions that work. She also said spending levels were important.
Dykstra asked Mary Laura Bragg if she had worked with professors who thought they were in alignment with the research, but really weren’t.
Bragg responded that “there’s research, and then there’s research.” They had to educate people on the difference between “research” from vendors and empirical research, which involves issues of fidelity and validation with different groups of students.
Levesque stated that Florida increased reading requirements for elementary candidates from 3 to 6 credits, and added a 3 credit requirement for secondary candidates. Colleges were required to fit this in by eliminating non-content area pedagogy courses.
Kathy Champeau repeated a concern from earlier meetings that teacher candidates need the opportunity to practice their new knowledge in a classroom setting, or they will forget it.
Hassett hoped the Teacher Performance Assessment would help this. The TPA would probably require certain things to be included in the teacher candidate’s portfolio.
Governor Walker said that the key to the effectiveness of Florida’s retention policy was the intervention provided to the students. He asked what they did to make sure intervention was successful.
Levesque replied that one key was reading coaches in the classroom. Also, district reading plans, individual intervention plans, student academies, etc. all need to be approved by the state.
There was consensus that there should be a difference in reading requirements for elementary vs. secondary teachers. There was no discussion of preparation for reading teachers, reading specialists, or special education teachers.
Licensing: The discussion centered around what teacher standards need to be tested.
Dykstra suggested that the Knowledge and Practice Standards for Teachers of Reading, written by Louisa Moats, et al, and published by the International Dyslexia Association in 2010, would be good teacher standards, and the basis for a teacher competency exam. There was no need for DPI to spend the next year discussing and inventing new teacher standards.
Champeau said that the International Reading Association also has standards.
Pedriana asked if those standards are based on research.
Dykstra suggested that the task force look at the two sets of standards side-by-side and compare them.
Professional Development: The facilitators looked for input on how professional development for practicing teachers should be targeted. Should the state target struggling teachers, schools, or districts for professional development?
Rep. Jason Fields felt all three needed to be targeted.
Heyde asked Levesque for more details on how Wisconsin could do professional development, when we often hear there is no money.
Levesque provided more detail on the state making reading a priority, building public/private partnerships, and being more creative with federal grant money (e.g., the 20% of each grant that is normally carved out by the state for administration). There should be a clear reading plan (Florida started with just two people running their initiative, and after a decade only has eight people), and all the spending should align with the plan to be effective. You cannot keep sending money down the hole. Additional manpower was provided by the provision that all state employees would get one paid hour per week to volunteer on approved reading projects in schools, and also by community service requirements for high school students.
Bragg suggested using the online Florida training modules, and perhaps combining them with modules from Louisiana.
Dykstra also suggested taking advantage of existing training, including LETRS, which was made widely available in Massachusetts. He also stressed the importance of professional development for principals, coaches, and specialists.
Bragg pointed out that many online training modules are free, or provided for a nominal charge that does not come close to what it would cost Wisconsin to develop its own professional development.
Lander said there were many Wisconsin teachers who don’t need the training, and it should not be punitive.
Champeau suggested that Florida spends way more money on education that Wisconsin, based on information provided by the NAEP.
Levesque clarified that Florida actually is below the national average in cost per student. The only reason they spend more than Wisconsin is that they have more students.
Rep. Steve Kestell stated that teachers around the entire state have a need for professional development, and it is dangerous to give it only to the districts that are performing the worst.
Sarah Archibald (sitting in for Sen. Luther Olsen) said it would be good to look at the value added in districts across the state when trying to identify the greatest needs for professional development. The new statewide information system should provide us with some of this value added information, but not at a classroom teacher level.
Evers commented that the state could require new teacher Professional Development Plans to include or be focused on reading.
Pils commented that districts can have low and high performing schools, so it is not enough to look at district data.
Champeau said that administrators also need this professional development. They cannot evaluate teachers if they do not have the knowledge themselves.
Dykstra mentioned a Florida guidebook for principals with a checklist to help them. He is concerned about teachers who develop PDP’s with no guidance, and spend a lot of time and money on poor training and learning. There is a need for a clearinghouse for professional development programs.
Screening/Intervention: One of the main questions here was whether the screening should be universal using the same tools across the state.
Champeau repeated a belief that there are districts who are doing well with the screening they are doing, and they should not be required to change or add something new.
Dykstra responded that we need comparable data from every school to use value added analysis, so a universal tool makes sense. He also said there was going to be a lot of opposition to this, given the statements against screening that were issued when Rep. Keith Ripp introduced legislation on this topic in the last biennium. He felt the task force has not seen any screener in enough detail to recommend a particular one at this time.
Heyde said we need a screener that screens for the right things.
Pils agreed with Dykstra and Heyde. She mentioned that DIBELS is free and doesn’t take much time.
Michele Erickson asked if a task force recommendation would turn into a mandate. She asked if Florida used a universal screener.
Levesque replied that Florida initially used DIBELS statewide, and then the FCRR developed the FAIR assessments for them. The legislature in Florida mandated the policy of universal kindergarten screening that also traces students back to their pre-K programs to see which ones are doing a better job. Wisconsin could purchase the FAIR assessments from Florida.
Archilbald suggested phasing in screening if we could not afford to do it all at once.
Evers supports local control, but said there are reasons to have a universal screener for data systems, to inform college programs, and to implement professional development.
Lander asked what screening information we could get from the WKCE.
Evers responded that the WKCE doesn’t start unitl third grade.
Dykstra said we need a rubric about screening, and who needs what type and how often.
Pedriana said student mobility is another reason for a universal screener.
There was consensus that early screening is important. Certainly by 4K or 5K, but even at age three if a system could be established. Possibilities mentioned were district-run screenings or pediatrician screenings.
Walker reminded the task force that it only makes sense to screen if you have the ability to intervene with something.
Mara Brown wasn’t sure that a universal screener would tell her anything more about her students than she already knows.
Levesque said she could provide a screening roadmap rubric for the task force.
No one on the task force had suggestions for specific interventions. The feeling was that it is more important to have a well-trained teacher. Both Florida and Oregon started evaluating and rating interventions, but stopped because they got bogged down. Wisconsin must also be careful about evaluations by What Works Clearinghouse, which has some problems.
Pedriana asked if the task force is prepared to endorse a model of instruction based on science, where failure is not an option.
The facilitator said this discussion would have to wait for later.
Early Childhood: The task force agreed that YoungStar should include more specific literacy targets.
Rep. Kestell felt that some district are opening 4K programs primarily for added revenue, and that there is wide variability in quality. There is a need to spend more time on this and decide what 4K should look like.
Evers said we should use the Common Core and work backward to determine what needs to be done in 4K.
Wrap-Up: Further discussion of early childhood will be put over to the next meeting, as will the societal issues and accountability. A meeting site has not yet been set, but Governor Walker indicted he liked moving around the state. The Governor’s aides will follow up as to locations and specific agenda. The next meeting will be Thursday, August 25. All meetings are open to the public.Related: An Open Letter to the Wisconsin Read To Lead Task Force on Implementing Common Core Academic Standards; DPI: “Leading Us Backwards” and how does Wisconsin Compare? www.wisconsin2.org.
Much more on Wisconsin’s Read to Lead Task Force, here.
Wisconsin Governor Walker’s Read to Lead task force met on May 31st at the State Capitol. Following are observations from WRC.
Wisconsin Reading Coalition, via email:
Governor Walker’s Read to Lead task force met on May 31st at the State Capitol. Following are observations from WRC.
Note: Peggy Stern, an Oscar-winning filmmaker currently working on a project about dyslexia, had a crew filming the meeting. If we are able to acquire footage, we will make it available. If you would like Wisconsin Eye to record future meetings, please contact them at comments@wiseye.org.
Format: Unlike the first task force meeting, this meeting was guided by two facilitators from AIR, the American Institutes for Research. This was a suggestion of Senator Luther Olsen, and the facilitators were procured by State Superintendent Tony Evers. Evers and Governor Walker expressed appreciation at not having to be concerned with running the meeting, but there were some problems with the round-robin format chosen by the facilitators. Rather than a give-and-take discussion, as happened at the first meeting, this was primarily a series of statements from people at the table. There was very little opportunity to seek clarification or challenge statements. Time was spent encouraging everyone to comment on every question, regardless of whether they had anything of substance to contribute, and the time allotted to individual task force members varied. Some were cut off before finishing, while others were allowed to go on at length. As a direct result of this format, the conversation was considerably less robust than at the first meeting.
Topics: The range of topics proved to be too ambitious for the time allowed. Teacher preparation and professional development took up the bulk of the time, followed by a rather cursory discussion of assessment tools. The discussion of reading interventions was held over for the next meeting.
Guests:
Dawnene Hassett, Asst. Prof. of Curriculum and Instruction and new elementary literacy chair, UW-Madison
Tania Mertzman Habeck, Assoc. Prof. of Curriculum and Instruction, UW-Milwaukee
Mary Jo Ziegler, Reading Consultant, Wis. Department of Public Instruction
Troy Couillard, Special Education Team, Wis. Department of Public Instruction
Next Meetings: The Governor’s office will work to set up a schedule of meetings for the next several months. Some of the meetings may be in other parts of the state.
Action: WRC suggests contacting the offices of the Governor, Luther Olsen, Steve Kestell, and Jason Fields and your own legislators to ask for several things:
Arrange for filming the next meeting through Wisconsin Eye
Bring in national experts such as Louisa Moats, Joe Torgesen, and Peggy McCardle to provide Wisconsin with the road map for effective reading instruction, teacher preparation, and professional development . . . top university, DPI, and professional organization leaders at the May 31st meeting asked for a road map and admitted they have not been able to develop one
Arrange the format of the next meeting to allow for more authentic and robust discussion of issues
Summary
Teacher Training and Professional Development
The professors felt that the five components of reading (phonemic awareness, phonics, fluency, vocabulary, and comprehension) are generally taught in preparation programs, but that instruction varies widely from one institution to another. Reading course work requirements can vary from 12 credits to just one course. They also felt, as did the teachers on the panel, that there needs to be more practical hand-on experience in the undergraduate program. There was a feeling that teachers “forget” their instruction in reading foundations by the time they graduate and get into the classroom. They have better luck teaching masters level students who already have classroom experience. The linguistic knowledge means very little without a practicum, and we may need to resort to professional development to impart that information. Teachers need to be experts in teaching reading, but many currently don’t feel that way. It is important, especially with RTI coming, to be able to meet the needs of individual students.Both professors and teachers, as well as others on the panel, felt a “road map” of critical information for teacher preparation programs and literacy instruction in schools would be a good idea. This was a point of agreement. Hassett felt that pieces of a plan currently exist, but not a complete road map. The professors and some of the teachers felt that teacher prep programs are doing a better job at teaching decoding than comprehension strategies. They were open to more uniformity in syllabi and some top-down mandates.
Marcia Henry mentioned studies by Joshi, et al. that found that 53% of pre-service teachers and 60% of in-service teachers are unable to correctly answer questions about the structure of the English language. Tony Pedriana cited another Joshi study that showed college professors of reading were equally uninformed about the language, and the majority cannot distinguish between phonemic awareness and phonics. He also said it was very difficult to find out what colleges were teaching; one college recently refused his request to see a syllabus for a reading course. Steve Dykstra read from the former Wisconsin Model Academic Standards and the current Wisconsin Model Early Learning Standards, which contained incorrect definitions and examples of phonemic awareness. He questioned whether teachers were being adequately prepared in decoding skills. Rep. Steve Kestell was concerned with the assessment that most teachers do not feel like experts in teaching reading, and he wondered if updated techniques for training teachers would make a difference.
Sarah Archibald (aide to Luther Olsen) proposed looking at a more rigorous foundations of reading test, as found in other states, as a requirement for teacher licensure. This would be one way to move toward more uniform instruction in teacher prep programs. Steve Dykstra pointed out that a test alone will not necessarily drive changes in teacher preparation, but publishing the passage results linked to individual colleges or professors would help. Evers indicated that DPI has been looking for several months into teacher testing and licensure.
Gov. Walker asked if the ed schools were looking at the latest trends in teacher preparation to become better. The professors indicated that the ed schools confer with local districts in an effort to improve.
Supt. Evers said it was probably not a good idea that teacher prep programs across Wisconsin vary so much.
Hassett indicated that some flexibility needs to be retained so that urban and rural areas can teach differently. There was some disagreement as to whether teachers of upper grades need to be trained in reading, or at least trained the same way.
Linda Pils pointed out that the amount and quality of professional development for Wisconsin teachers is very spotty. Most panel members felt that a coaching model with ongoing training for both teachers and principals was essential to professional development, but the coaches must be adequately trained. There was some discussion of Professional Development Plans, which are required for relicensure, and whether the areas of development should be totally up the individual teacher as they are now. Steve Dykstra felt that much existing professional development is very poor, and that money and time needs to be spent better. Some things should not count for professional development. Michele Erikson felt that it would be good to require that Professional development be linked to the needs of the students as demonstrated by performance data. Mary Read pointed out that coaching should extend to summer programs.
The main consensus here was that we need a road map for good reading instruction and good teacher training and coaching. What is missing is the substance of that road map, and the experts we will listen to in developing it.
Assessment
Mary Jo Ziegler presented a list of formal and informal assessment tools used around Wisconsin. Evers pointed out that assessment is a local district decision. Many former Reading First schools use DIBELS or some formal screener that assesses individual skills. Balanced literacy districts generally use something different. Madison, for example, has its own PLA (Primary Language Assessment), which includes running records, an observational survey, word identification, etc. MAP assessments are widely used, but Evers indicated that have not been shown to be reliable/valid below third grade. Dykstra questioned the reliability of MAP on the individual student level for all ages. PALS was discussed, as was the new wireless handheld DIBELS technology that some states are using statewide. Many members mentioned the importance of having multiple methods of assessment. Kathy Champeau delivered an impassioned plea for running records and Clay’s Observational Survey, which she said have been cornerstones of her teaching. Kestell was surprised that so many different tools are being used, and that the goal should be to make use of the data that is gathered. Dykstra, Henry, and Pedriana mentioned that assessment must guide instruction, and Archibald said that the purpose of an assessment must be considered. Couillard said that the Wis. RTI center is producing a questionnaire by which districts can evaluate assessment tools they hear about, and that they will do trainings on multiple and balanced assessments. Dykstra questioned the three-cue reading philosophy that often underlies miscue analysis and running records. no consensus was reached on what types of assessment should be used, or whether they should be more consistent across the state. Hassett questioned the timed component of DIBELS,and Dykstra explained its purpose. Some serious disagreements remain about the appropriateness of certain assessment tools, and their use by untrained teachers who do not know what warning signs to look for.
Intervention
Evers began the topic of intervention by saying that DPI was still collecting data on districts that score well, and then will look at what intervention techniques they use. Henry suggested deferring discussion of this important topic to the next meeting, as there were only 8 minutes left.
Madison school officials want new standardized tests
Madison students are slated to get a double dose of standardized tests in the coming years as the state redesigns its annual series of exams while school districts seek better ways to measure learning.
For years, district students in grades three through eight and grade 10 have taken the Wisconsin Knowledge and Concepts Examination (WKCE), a series of state-mandated tests that measure school accountability.
Last month, in addition to the state tests, eighth- and ninth-graders took one of three different tests the district plans to introduce in grades three through 10. Compared with the WKCE, the tests are supposed to more accurately assess whether students are learning at, above or below grade level. Teachers also will get the results more quickly.
“Right now we have a vacuum of appropriate assessment tools,” said Tim Peterson, Madison’s assistant director of curriculum and assessment. “The standards have changed, but the measurement tool that we’re required by law to use — the WKCE — is not connected.”Related Links:
- The WKCE has been used for the District’s “Value Added Assessment” progam
- The WKCE has been often criticized for its lack of rigor: Wisconsin’s Low State Test Score Standards (“The Proficiency Illusion”) by Alan Borsuk.
- Many links on the WKCE.
- Clusty Search: EXPLORE test; Blekko Search.
- Clusty Search: Measures of Academic Progress (MAP); Blekko Search.
I’m glad that the District is planning alternatives to the WKCE.
Questions and Concerns Regarding the “Findings and Recommendations” of the MMSD K-12 Literacy Program Evaluation report
The following questions and concerns are submitted to you for your consideration regarding the “findings and recommendations” of the MMSD K-12 Literacy Program Evaluation report:
1. What findings and recommendations are there for ‘year-around’ literacy experiences to help mitigate ‘losses’ over the summer months in achievement gains during the traditional academic year?
Although “summer loss” was not a particular focus of discussion during the evaluation process, there are several ways in which the recommendations address reducing the impact of summer reading loss. These include:
Recommendation I – curricular consistency will provide for a more seamless connection with content and instruction in summer school, Saturday school (pending funding) and after school supports.
Recommendation II – more explicit instruction focused in early grades will allow students to read for enjoyment at earlier ages.
Recommendation III – a well-developed intervention plan will follow a student through summer school and into the following academic year
2. What are the findings and recommendations regarding parental (significant adults in student’s life) participation, training, evaluation and accountability in the literacy learning process?
Parental participation opportunities to support their children’s enjoyment and achievement in literacy include:
Family Literacy Nights at various elementary schools and in collaboration with Madison School and Community Recreation. Town Hall Meetings that provide opportunities for families to share pros and cons of literacy practices at school and home.
Literacy 24-7: Parent training for Spanish speaking families on how to promote literacy learning. Read Your Heart Out Day: This event builds positive family, community and school relationships with a literacy focus and supports both the family involvement and cultural relevance components of the Madison Metropolitan School District Strategic Plan.
Tera Fortune: Professional development for parents about the Dual Language Immersion Program with a focus on bi-literacy throughout the content areas. MALDEF Curriculum Training: Nine-week training covering a variety of topics to assist parents in sharing the responsibility of student success and how to communicate effectively in schools.
Regular column in Umoja Magazine: Forum to inform families and community members about educational issues through African American educators’ expertise. Several columns have focused on literacy learning at home.
Training is provided for parents on how to choose literature that:
Has positive images that leave lasting impressions
Has accurate, factual information that is enjoyable to read
Contains meaningful stories that reflect a range of cultural values and lifestyles
Has clear and positive perspective for people of color in the 21st century
Contains material that is self affirming Promotes positive literacy learning at home
Evaluations of the Read Your Heart Out and Family Literacy Night were conducted by requesting that participating parents, staff, students and community members complete a survey about the success of the event and the effects on student achievement.
3. What are the consequential and remediation strategies for non-performance in meeting established achievement/teaching/support standards for students, staff and parents? What are the accompanying evaluation/assessment criteria?
A District Framework is nearing completion. This Framework will provide clear and consistent expectations and rubrics for all instructional staff and administrators. Improvement will be addressed through processes that include the School Improvement Plans and staff and administrator evaluations processes.
4. Please clarify the future of the Reading Recovery program.
MMSD proposes to maintain Reading Recovery teachers and teacher leaders as an intervention at grade 1. There are currently two Reading Recovery teacher leaders participating in a two-year professional development required to become Reading Recovery teacher leaders. One of these positions will be certified to support English Language Learners. The modifications proposed include: 1) targeting these highly skilled Reading Recovery teachers to specific students across schools based on district-wide data for 2011-12 and 2) integrating the skills of Reading Recovery staff into a comprehensive intervention plan along with skilled interventionists resulting in all elementary schools benefiting from grade 1 reading intervention.
5. How will the literacy learning process be integrated with the identification and development of Talented and Gifted (TAG) students?
The development of a balanced, comprehensive assessment system will result in teachers having more frequent and accurate student data available to tailor instruction. K-12 alignment uses tools such as Measures of Academic Progress (MAP) and Educational Planning and Assessment System (EPAS) are being implemented in Spring, 2011.
The Response to Intervention model is based on evidence-based instruction and responds to students who need additional challenge and/or support.
6. What will be the 2010-2011 budgetary priorities and strategies for undertaking the literacy program and resources recommendations outlined in the report?
PreK-12 literacy will be a priority for the 2011-12 budget process. In addition to the prioritization of funding within our budget parameters, MMSD is in the process of writing a major grant (Investing in Innovation – i3) to support the recommendations of the literacy evaluation as a key strategy to close achievement gaps and improve literacy for all students to be ready for college and/or careers.
All Together Now? Educating high and low achievers in the same classroom
Michael Petrilli, via a kind reader’s email:
The greatest challenge facing America’s schools today isn’t the budget crisis, or standardized testing, or “teacher quality.” It’s the enormous variation in the academic level of students coming into any given classroom. How we as a country handle this challenge says a lot about our values and priorities, for good and ill. Unfortunately, the issue has become enmeshed in polarizing arguments about race, class, excellence, and equity. What’s needed instead is some honest, frank discussion about the trade-offs associated with any possible solution.
U.S. students are all over the map in terms of achievement (see Figure 1). By the 4th grade, public-school children who score among the top 10 percent of students on the National Assessment of Educational Progress (NAEP) are reading at least six grade levels above those in the bottom 10 percent. For a teacher with both types of students in her classroom, that means trying to challenge kids ready for middle-school work while at the same time helping others to decode. Even differences between students at the 25th and at the 75th percentiles are huge–at least three grade levels. So if you’re a teacher, how the heck do you deal with that?Lots of related links:
- “Stand Up Against the MMSD High School Reform”
- Madison school district to consider alternatives to traditional public schools
- Advanced Placement, Gifted Education & A Hometown Debate
- On the Gifted & Talented Complaint Against the Madison School District
- Madison School District 2010-2011 Enrollment Report, Including Outbound Open Enrollment (3.11%)
- Complaint Filed Against Madison Schools
- English 10
- District Small Learning Community Grant – Examining the Data From Earlier Grants, pt. 2
Broad Alum Busted in Seattle Public School Scandal for Lying to Advance Corporate Ed Reform
Brad Bernatek began his Broad Residency in Urban Education Cohort 2006 with Seattle Public Schools and became the chief honcho for accountability in 2008. From the Broad website:
Brad Bernatek serves [for now] as Director of Research, Evaluation and Assessment for Seattle Public Schools. In this role, Bernatek runs the department responsible for student statistics including enrollment, demographics, evaluation and standardized testing. During his Residency, Bernatek served the district as interim manager for research, evaluation and assessment and as special assistant to the chief operations officer.
When a new strategic plan was being put together in 2008 with the new superintendent, Maria Goodloe-Johnson (Broad Supt. Academy, Class of ’03), the Broadies needed some really embarrassing piece of information about SPS that could be used to leverage the changes they wanted to initiate: ending the remains of the school integration plan killed by the Roberts Court in 2007, more testing, closing more schools, opening more corporate charters, longer school days, teacher pay and evaluations based on test scores, working to end tenure, and the bringing in Teach for America to replace professional faculty. In short, the disaster capitalists needed a disaster to bring about change before anyone could regain their composure.
International Benchmarking: State Education Performance Standards
Gary W. Phillips, Ph.D., via a Richard Askey email
It is worth looking at the data to see how Wisconsin compares with some other states. Here is the mathematics comparison with Minnesota.
The “state” results are the percent of students ranked as proficient on the state test with the current cut scores being used. The international percent was obtained by using the state results on NAEP (National Assessment of Educational Progress) and this was mapped by comparing levels of problems to the level on TIMSS, (Trends in Mathematics and Science Study).
Grade 4 Mathematics Percent proficient
State International
Wisconsin 74 45
Minnesota 68 55
Massachusetts 49 63
Grade 8 Mathematics
Wisconsin 73 33
Minnesota 56 41
Massachusetts 46 52
No, the Massachusetts scores were not reversed here. Their cut score levels are set higher than the TIMSS levels.
It is time for the Wisconsin Department of Public Instruction to redo the cut score levels to make them realistic. Parents in Wisconsin are mature enough to be told the truth about how well their children are doing.
An Update on Seattle Schools Teacher Bargaining
mention on what was going on in the contract talks between SPS and SEA. I received this e-mail from the SEA. I post without comment.
SEA Bargaining Update July 23, 2010
SEA and District Far Apart in Negotiations
Dear Michael,
Your SEA Negotiations Team met with the District team on Tuesday and Wednesday of this week. We continue to be far apart on issues that you have told us matter most to you. The district is holding fast to their major proposals on:
• tying student growth based on MAP scores, MSP scores, and end-of-course assessments to certificated employees evaluations;
• use of evaluations as the lead factor in reduction in force, as opposed to strict seniority.
There has been very little to no movement on what you have told us are your two most important issues:
Comments on the Seattle Public Schools’ Strategic Plan Update
So I was just thinking about the progress on the Strategic Plan. I know I shouldn’t. It only serves to upset and frustrate me. Nevertheless…
Focusing just on the primary themes and elements of the Plan, it still doesn’t look good.
1. Ensuring Excellence in Every Classroom
1A. Adopt an aligned curriculum in math and science
They haven’t done this. They’re nowhere with regard to science; I don’t think they’ve even gotten started. They’re not much further along with math. They have standardized the textbooks (for the most part), and they have posted pacing guides, but there’s no evidence that they have aligned the curriculum. In fact, it doesn’t appear that they have any ability to align the curriculum, that they even know how to align curriculum, or that they know what aligned curriculum would look like. After making bold statements on PowerPoints and paying millions to vendors, they appear to be completely adrift.
1B. Develop districtwide assessments in math and reading
This is a reference to the MAP, but it isn’t districtwide yet and teachers either don’t know how to use the results or simply aren’t choosing to use them. There were supposed to be a lot of other common assessments, but there’s no evidence to suggest that they are either in use or useful. Mostly this was an excuse to funnel millions to a vendor for a data warehouse which isn’t ready yet and will be of questionable utility when it is ready.Related: Madison School District Strategic Plan.
Learning Curve: A troubling score gap
In a new report contrasting proficiency scores on state exams to federal tests, Georgia comes across as a very easy grader.
“States are setting the bar too low,” said U.S. Education Secretary Arne Duncan in response to the release Thursday of the study “Mapping State Proficiency Standards onto NAEP Scales: 2005-2007.”
The federal study compares proficiency standards of states using the results of the National Assessment of Education Progress — often called the Nation’s Report Card — as the common yardstick.
A national test given to select students in every state, NAEP is the only nationally representative and continuing assessment of what America’s students know and can do in various subject areas.
Because students across the nation take the same NAEP assessment, state-to-state comparisons can be made.
Monona Grove School District “Tentative” Goals
The board met 7/22 to discuss district goals for the coming year. The tentative goals, which we will be discussing at Wednesday’s board meeting are currently:
1) Achieve measureable increase in student achievement in core academic areas using these assessments: DIBELS, MAP , WKCE, EXPLORE, PLAN and ACT.
2) Develop measures ot assess student achievement in Encore areas and electives.
3) Align curriculum, instruction and assessment wiht standards/skill in core academic areas as defined by DIBELS, MAP , WKCE, EXPLORE, PLAN and ACT.
4) Close the achievement gaps with attention to race, ethnicity and socio economic status, using measureable assessments provide DIBELS, MAP , WKCE, EXPLORE, PLAN and ACT and reduce disproportionality with regard to placement of minority students in special edcuation.
Proposed Madison School District Talented & Gifted Plan
Madison School District Superintendent Dan Nerad’s memo [100K PDF] on the Proposed Talented & Gifted Plan [1.2MB PDF]:
Background
Wisconsin Administrative Rule 8.01 (2)(t)2 states that each school district shall establish a plan and designate a person to coordinate the gifted and talented program. The previous Talented and Gifted (TAG) Plan approved by the Madison Metropolitan School District (MMSD) Board was in 1991. 2008-09 highlighted several independent yet related events which served to underscore both the urgency of and District-wide benefit for an updated Plan. Among the events that converged to result in the need to update the Talented and Gifted Plan were:
- Superintendent Dr. Daniel Nerad was hired in July 2008. Dr. Nerad recognized the need for addressing the issues related to Talented and Gifted programming;
- The last TAG Plan (1991) approved by the District was found by the DPI to be out of compliance;
- An increase in open enrollment leaving the District spurred conversation regarding strategies to attract and retain students;
- Families leaving the District were surveyed to gather information regarding their reasons for leaving MMSD. A desire for improved Talented and Gifted programming was one of several emerging themes; and
- A new Strategic Plan was developed through extensive community involvement. The Strategic Plan clearly demands a rigorous and challenging education for all students.
Process In response to the events described above, the Superintendent charged the Teaching & Learning TAG Division to develop a process to create an updated Plan. The TAG Division met on a regular basis to define major areas for improvement in alignment with the National Association for Gifted Children standards. A Talented and Gifted Advisory Committee comprised of 30 members was convened in early spring. This group met five times between February and June to provide input and critique the evolving draft. The Superintendent and TAG Coordinator hosted a community input session on March 26. Senior Management, Instructional Council and Principals reviewed drafts and provided input. In order to ensure a timely and high quality Plan, a subcommittee of the Talented and Gifted Advisory Committee was invited to continue to work with TAG staff to complete the Plan during June and July.
There have been significant challenges in the process leading to the development of the enclosed plan. These challenges include communication, changes in leadership and an evolving level of District and community trust in MMSD’s commitment to providing high quality education for all stUdents. Overcoming these challenges is an on-going process, one captured in the language of the plan with respect to continual improvement. Although there are aspects of current MMSD talented and gifted programming that are sound and valued, the need for overall structural improvements and re-vitalization is recognized byal!.
In addition to the TAG Division staff, we sincerely appreciate the members of the TAG Advisory Committee for their extraordinary gift of time and dedication toward creating this plan. Special recognition goes to TAG Advisory Subcommittee members Kerry Berns, Bettine Lipman, Laurie Frost, Chris Gomez Schmidt and Carole Trone for their continuing support and input through the final draft of this plan.
MMSD Strategic Planning The enclosed TAG Plan aligns, supports and strengthens important aspects of the Strategic Plan. In particular, the TAG Plan undergirds District-wide efforts to: enhance assessments to guide appropriate levels of instruction; accelerate learning for all students; embed differentiation as core practice in all classrooms; and map and develop a comprehensive and articulated curriculum K-12 in order to increase curricular rigor for all students.
Executive Plan Summary Based upon the framework set forth by the National Association for Gifted and Children standards and areas identified by MMSD for improvement, eight key goal areas addressed in this Plan are:
Community members learn safer ways to get to school
bright lime-green T-shirts, groups of parents, students and teachers of the 16 elementary schools in Woodbridge Township and residents in the surrounding areas volunteered their time over the weekend to be part of making the routes to their individual schools safer.
Top and above: Teacher Beth Heagen, from Woodbine Avenue Elementary School No. 23 in Avenel, leads Bhavika Shah and her children Hetri, 8, a third-grader, and Ishika, 6, a firstgrader, as they travel through the streets that they and other students walk each day to get to school, looking for unsafe conditions as well as positive ones.
Dr. Wansoo Im, president of Vertices LLC, a GIS consulting firm, and a professor at Rutgers University in New Brunswick, led the group of a dozen or so people at Woodbine Avenue Elementary School No. 23 in Avenel to kick off the Discovering Safe Routes to School event, which was a walkability assessment, on May 30.
Each person was given a pedometer and took a map of the route, a survey and a digital camera to take photographs of what each one felt needed improvement, such as implementation of sidewalks, dangerous street crossings and overgrown shrubbery, and also what the participants felt worked well in the area.
“This event is an outgrowth of the walk we took with former Olympic racewalker [Mark Fenton] last year,” said Mayor John E. McCormac. “Our job as public officials is to keep the kids safe. What is safe to us might not be what is safe to an 8-year-old kid. The kids walk these routes every day.”
Student Beaten in Toki Middle School Bathroom
WKOW-TV via a kind reader’s email:
Parents of students at a Madison middle school worry about safety after a child was beat up in one the school’s bathroom.
The incident happened last week Thursday.
According to a letter sent home to parents Monday, a group of students followed a male student into the boy’s bathroom where another student assaulted him.
The group blocked entrance to the bathroom.
Surveillance cameras show the beating along with a group of witnesses cheering on the violence.
Toki [Map] Principal Nicole Schaefer says the school sent the letter to alert parents that the proper actions were taken and assure them the school is safe.
Schaefer would not tell 27 News if any students were suspended or if the victim is back in school.Toki Middle School Restorative Justice Plan [82K PDF]:
Judicious discipline is a three pillared process set on a solid educational foundation. The first pillar is prevention through education and positive behavior supports; the second pillar is equity through fair and consistent consequences, and the third pillar is restoration through empathy, forgiveness and conflict resolution. The educational foundation that these pillars stand on is curriculum, instruction and assessment practices that are engaging, rigorous, culturally responsive, and individualized. In summary, kids who are engaged in learning are less likely to engage in misconduct.
The backbone of our discipline policy is that all staff and students must be treated with dignity and respect, including those who harm others. We want everyone to know that misconduct is never acceptable, but always fixable. We will be warm but strict, and follow through with clear, fair and consistent consequences, but also encourage students to repair the harm they caused, earn forgiveness, and restore their reputations.
When a student engages in misconduct, we must care for two interests:
- The student who misbehaves – We teach the student how to repair the harm, earn forgiveness, and restore his or her reputation
- All other students – We protect their health, safety, property, and opportunity to learn in an environment free from distractions
Therefore, when a student engages in misconduct, he or she has two options:
- Fix the harm (ex: Apology, Mediation, Repair or Replace, Community service, Extended learning)
- Accept a consequence (ex: Lunch detention, After school detention, In school suspension, Out of school suspension, Suspension alternatives)
The consequences for misconduct will vary, depending on how the behavior harms the health, safety, property and learning opportunities of other students. Although choosing to “fix the harm” may reduce or replace consequences for less harmful misconduct, behaviors that significantly or severely harm others will result in mandatory suspension days, up to a recommendation for expulsion.
40 students ( 2008/2009 student population is 538) open enrolled out of Toki Middle school for the 2009/2010 term according to this Madison School District document. Much more on Toki here.
A Law Best Left Behind
Jason Riley: With its focus on testing, achievement, accountability and transparency, the No Child Left Behind Act has undoubtedly altered the terms of the education debate in the U.S. But the law, which is set to expire this year, remains seriously flawed, and the Bush administration’s weak enforcement of its best provisions argues against renewal. […]
State School Standards Vary Widely in Study
Tamar Lewin: What students must learn to be deemed academically proficient varies drastically from state to state, the United States Department of Education said today in a report that, for the first time, showed the specific extent of the differences. The report supports critics who say the political compromise of the federal No Child Left […]
Reading Recovery: More chipping and shredding in Fargo!
What makes this article from Fargo interesting is how it almost exactly mirrors the findings in my home district, Hortonville, and the recent analysis of Reading Recovery done in Madison. That being, a 50% success rate for RR students. From the article: “However, West Fargo student data over time, as presented by Director of Knowledge […]
School Finance: K-12 Tax & Spending Climate
School spending has always been a puzzle, both from a state and federal government perspective as well as local property taxpayers. In an effort to shed some light on the vagaries of K-12 finance, I’ve summarized below a number of local, state and federal articles and links. The 2007 Statistical Abstract offers a great deal […]
“Too Little Math in Math?”
Lynn Thompson: But they strongly believe that their math textbooks should include actual math. Donald’s “Connected Mathematics” book at Harbour Pointe Middle School in Mukilteo asks him to arrange a list of 20 cities in order of their populations, all in the tens of millions. Yes, he concedes, he must recognize differences among numbers, but […]
Making The Grade
Chris Whittle: Quiz: Of the 10 largest school systems, which have made the best gains in student scores? Answer: Philadelphia and New York. Between 2002 and 2005 for grades K-8, Philly gained 19.5 points in proficiency on the state assessment system, while NYC schools posted a 13-point increase on state exams. Even if you normalize […]
Technology in Education
In the wake of the annual EdWeek Technology Counts issue, there has been some discussion surrounding the idea that technology is education is harmful. I attribute this to a few factors, including to overstated claims for educational technology in the past, concerns about very specific uses of technology in education like calculators, and the comfort […]
Similar Students, Different Results
From the latest Teacher’s College Record. It looks like a solid study, but I have one caveat. One of the findings is that successful schools are aligned with the State Standards and success is then measured by these standards. This does raise questions about the content of these standards. The creation of these standards has […]
Tim Olsen on Generating Cash from the Doyle Administration Land/Building
Tim Olsen’s email to Madison Board of Education Member Ruth Robarts: And below are the specifics you requested re calculating an estimated value for the Doyle site. You are welcome to share this email with anyone interested. And thanks for the opportunity to speak to the Board, for your comments, and for including Lucy Mathiak’s […]
2005 NAEP Results
2005 National and State Mathematics and Reading Assessments for grades 4 and 8 are now available. Robert Tomsho takes a look at the reading results: Observers say boosting reading scores isn’t likely to get any easier, given the rapidly changing demographics in the nation’s schools where, for many students, English is a second language. Indeed, […]
Are MMSD Programs Effective? Who Knows?
This is my first post to this blog, so I�ll start by introducing myself. My name is Bill Herman. I have two kids at Crestwood ES, and a third will start in the fall. Also, I work in K-12 education; I�m the technology director for Monona Grove Schools. I read �Paper #1,� criticizing MMSD for […]