Where Have all the Students Gone? An Update
An update to Barb Schrank's November, 2005 post:
Comments from a reader:
At $6,000 per child that's about $16 million per year. At $9,000 per child, that's about $23 million per year. If we kept 332, that would be $2-3 million more per year.
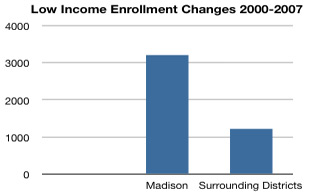
Also, MMSD not only lost students, which has a negative effect on what the district gets under revenue caps, we've increased our low-income population, which means that for every dollar the district gets, more of those dollars need to be spent on non-instructional services.
If the district does not consider the economic development implications of its decisions, we're likely to
- see more go to school outside MMSD, or
- for the non-low income students who go to school here increased family dollars will be spent on private aspects of education- lessons, tutoring, etc.
Madison's population in 2000 was 208,054 and is estimated to be 223,389,
according to the census bureau. Madison's poverty rate is estimated to be
13%, according to the Small Area Estimates Branch [
Website].
|
| District | Enrollment
2000-2001 | Enrollment
2006-2007 | Per Student Spending (06/07 Budget) | Administrators | Total Staff | ACT % Tested (05-06) | ACT Comp Score |
|---|
| Madison | 25,087 | 24,755 | $12,422 | 91.5 | 3544.6 | 61.1 | 24.2 |
| Verona | 4222 | 4540 | $12,113 | 22 | 603.4 | 69.6 | 23.6 |
| Middleton-Cross Plains | 5125 | 5640 | $12,822 | 21 | 756.3 | 73 | 24.5 |
| Waunakee | 2836 | 3357 | $11,987 | 14 | 427.6 | 70.7 | 23.3 |
| Sun Priarie | 4776 | 5946 | $11,238 | 20 | 741.3 | 62.6 | 23 |
| McFarland | 1951 | 2017 | $11,853 | 9.5 | 251.2 | 64 | 23.7 |
| Monona Grove | 2702 | 2885 | $12,289 | 13 | 388 | 71.4 | 22.6 |
| Oregon | 3430 | 3588 | $11,572 | 15 | 465.1 | 59.2 | 23.2 |
Data sources:
Thanks to a number of readers for the updated information.
Posted by Jim Zellmer at January 14, 2008 12:10 AM
Subscribe to this site via RSS/Atom:  Newsletter signup | Send us your ideas