
| School Information System |
|
|
 | Newsletter signup | Send us your ideas
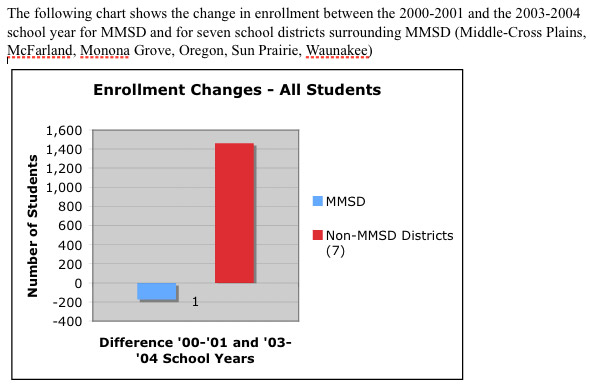
November 20, 2005Where Have All the Students Gone?
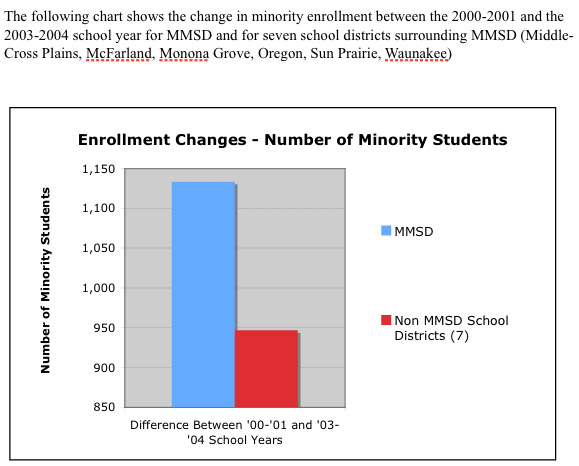
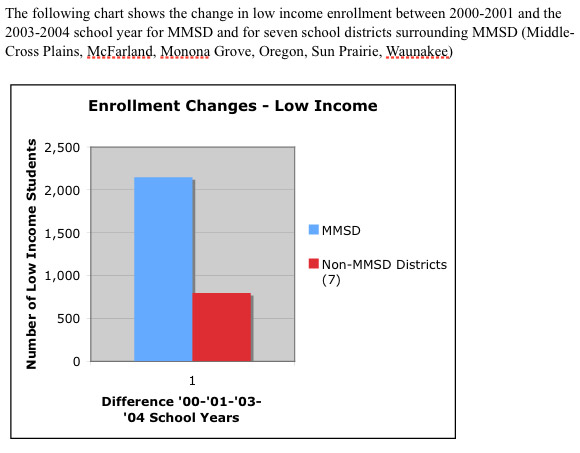
The property tax and state general fund revenue value of 174 students is $1.57 million per year in the 2003-2004 MMSD school year dollars (about $9,000 per student). For 1,462 students, the revenue value is $13.16 million per year. Put another way, the value of losing 174 students equals a loss of 26-30 teachers. A net increase of 1,462 students equals nearly 219 teachers. There are more subtleties to these calculations due to the convoluted nature of the revenue cap calculation, federal and state funds for ELL and special education, but the impact of losing students and not gaining any of the increase of students in the area is enormous. What else can we see looking at these two school years? The number of low income students in MMSD increased 2,146 (total low income increase was 2,942), the number of minority students in MMSD increased 1,133 (total minority increase was 2,080). In contrast, the number of non-low income students decreased in MMSD 2,230 (total decrease was 1,654), the number of white students decreased 1,307 (total decrease was 792 students, because the surrounding districts showed an increase in the number of white students comparing the two school years). What big picture questions do these data raise? *The source of data for public school, private and home school data is the WI Department of Public Instruction. These two years were selected due to limitations in the number of years of economic status data available. Year to year enrollment numbers move up/down, but for MMSD the trend has been toward fewer students over the past 10 years. Posted by at November 20, 2005 8:09 PMSubscribe to this site via RSS/Atom: Newsletter signup | Send us your ideas
|