A group of school officials, including state Superintendent Tony Evers, is asking lawmakers to address potential staffing shortages in Wisconsin schools by making the way teachers get licensed less complicated.
The Leadership Group on School Staffing Challenges, created by Evers and Wisconsin Association of School District Administrators executive director Jon Bales, released last week a number of proposals to address shortages, including reducing the number of licenses teachers must obtain to be in a classroom.
Under the group’s proposal, teachers would seek one license to teach prekindergarten through ninth grade and a second license to teach all grades, subjects and special education.
The group also proposes to consolidate related subject area licenses into single subject licenses. For example, teachers would be licensed in broad areas like science, social studies, music and English Language Arts instead of more specific areas of those subjects.
Wisconsin adopted Massachusett’s (MTEL) elementary reading content knowledge requirements (just one, not the others).
Much more on Wisconsin and MTEL, here.
National Council on Teacher Quality ranks preparation programs…. In 2014, no Wisconsin programs ranked in the top group.
Foundations of Reading Results (Wisconsin’s MTEL):
Wisconsin’s DPI provided the results to-date of the Wisconsin Foundations of Reading exam to School Information System, which posted an analysis. Be aware that the passing score from January, 2014 through August, 2014, was lower than the passing score in Massachusetts and Connecticut. Since September of 2014, the Wisconsin passing score has been the same as those states. SIS reports that the overall Wisconsin pass rate under the lower passing score was 92%, while the pass rate since August of 2014 has been 78%. This ranges from around 55% at one campus to 93% at another. The pass rate of 85% that SIS lists in its main document appears to include all the candidates who passed under the lower cut score.
The Wisconsin Department of Public Instruction’s proposed changes: Clearinghouse Rule 16 PROPOSED ORDER OF THE STATE SUPERINTENDENT OF PUBLIC INSTRUCTION REVISING PERMANENT RULES
A kind reader’s comments:
to wit “Of particular concern is the provision of the new rule that would allow teachers who have not otherwise met their licensure requirements to teach under emergency licenses while “attempting to complete” the required licensure tests. For teachers who should have appropriate skills to teach reading, this undercuts the one significant achievement of the Read to Lead workgroup (thanks to Mark Seidenberg)—that is, requiring Wisconsin’s elementary school and all special education teachers to pass the Foundations of Reading test at the MTEL passing cut score level. The proposed DPI rule also appears to conflict with ESSA, which eliminated HQT in general, but updated IDEA to incorporate HQT provisions for special education teachers and does not permit emergency licensure. With reading achievement levels in Wisconsin at some of the lowest levels in the nation for the student subgroups that are most in need of qualified instruction, the dangers to students are self-evident”.
Related, from the Wisconsin Reading Coalition [PDF]:
Wisconsin 4th Grade Reading Results on the 2015 National Assessment of Educational Progress (NAEP)
Main takeaways from the 2015 NAEP 4th grade reading exam:
- Wisconsin scores have been statistically flat since 1992
- 37% of our 4th graders score proficient or advanced
- Our 4th graders rank 25th nationally: we have been in the middle of the pack since 2003
- Our African-American students have the second lowest scores in the country (behind Michigan) and statistically underperform their national African-American peer sub-group
- We have the second largest white/black score gap in the country (behind Washington, D.C.) Our Asian students statistically underperform their national Asian peer sub-group
- Only our English Language Learners statistically outperform their national peer sub-group
Statements by our Department of Public Instruction that there was a “positive upward movement” in reading (10/28/15 News Release) and especially that our 4th graders “might be viewed” as ranking 13th in 4th grade reading (11/5/15 DPI-ConnectEd) are inaccurate and misleading.
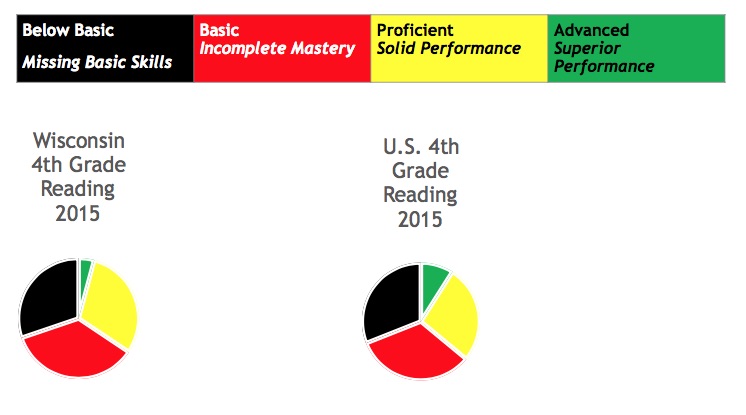
Proficiency Rates and Performance Gaps
Overall, 8% of Wisconsin 4th graders are advanced, 29% are proficient, 34% are basic, and 29% are below basic. Nationally, 9% of students are advanced, 27% are proficient, 33% are basic, and 31% are below basic.
As is the case around the country, some student groups in Wisconsin perform better than others, though only English Language Learners outperform their national peer group. Several groups are contrasted below.
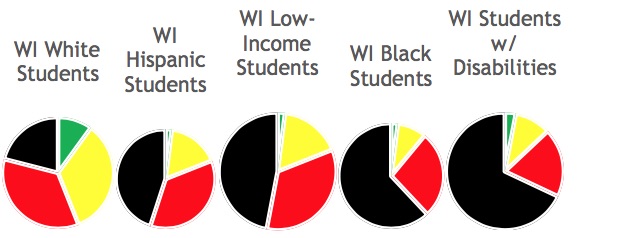
Subgroups can be broken down by race, gender, economic status, and disability status. 44% of white students are proficient or advanced, versus 35% of Asian students, 23% of American Indian students, 19% of Hispanic students and 11% of African-American students. 40% of girls are proficient or advanced, compared to 34% of boys. Among students who do not qualify for a free or reduced lunch, 50% are proficient or advanced, while the rate is only 19% for those who qualify. Students with disabilities continue to have the worst scores in Wisconsin. Only 13% of them are proficient or advanced, and a full 68% are below basic, indicating that they do not have the skills necessary to navigate print in school or daily life. It is important to remember that this group does not include students with severe cognitive disabilities.
When looking at gaps between sub-groups, keep in mind that a difference of 10 points on The NAEP equals approximately one grade level in performance. Average scores for Wisconsin sub-groups range from 236 (not eligible for free/reduced lunch) to 231 (white), 228 (students without disabilities), 226 (females), 225 (non-English Language Learners), 222 (Asian), 220 (males), 209 (Hispanic), 207 (American Indian or eligible for free/reduced lunch), 198 (English Language Learners), 193 (African-American), and 188 (students with disabilities). There is a gap of almost three grade levels between white and black 4th graders, and four grade levels between 4th graders with and without disabilities.
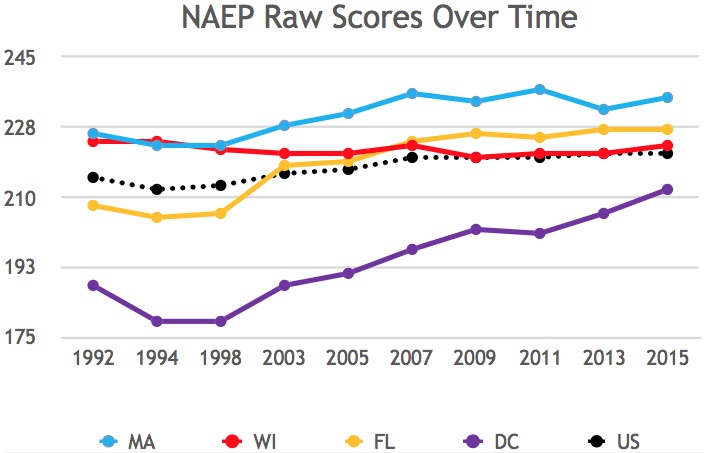
Scores Viewed Over Time
The graph below shows NAEP raw scores over time. Wisconsin’s 4th grade average score in 2015 is 223, which is statistically unchanged from 2013 and 1992, and is statistically the same as the current national score (221). The national score, as well as scores in Massachusetts, Florida, Washington, D.C., and other jurisdictions, have seen statistically significant increases since 1992.
Robust clinical and brain research in reading has provided a roadmap to more effective teacher preparation and student instruction, but Wisconsin has not embraced this pathway with the same conviction and consistency as many other states. Where change has been most completely implemented, such as Massachusetts and Florida, the lowest students benefitted the most, but the higher students also made substantial gains. It is important that we come to grips with the fact that whatever is holding back reading achievement in Wisconsin is holding it back for everyone, not just poor or minority students. Disadvantaged students suffer more, but everyone is suffering, and the more carefully we look at the data, the more obvious that becomes.
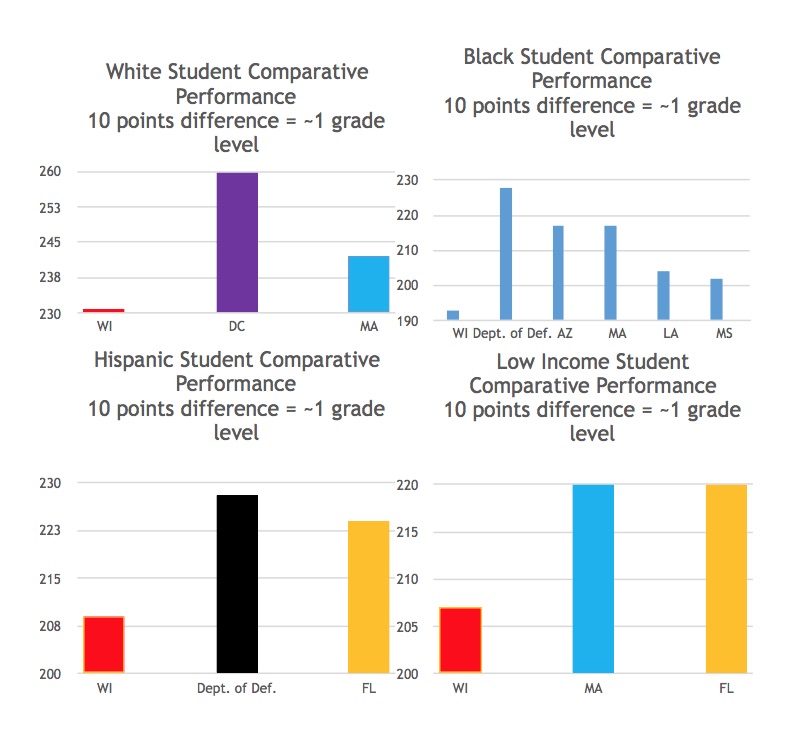
Performance of Wisconsin Sub-Groups Compared to their Peers in Other Jurisdictions
10 points difference on a NAEP score equals approximately one grade level. Comparing Wisconsin sub-groups to their highest performing peers around the country gives us an indication of the potential for better outcomes. White students in Wisconsin (score 231) are approximately three years behind white students in Washington D.C. (score 260), and a year behind white students in Massachusetts (score 242). African-American students in Wisconsin (193) are more than three years behind African-American students in Department of Defense schools (228), and two years behind their peers in Arizona and Massachusetts (217). They are approximately one year behind their peers in Louisiana (204) and Mississippi (202). Hispanic students in Wisconsin (209) are approximately two years behind their peers in Department of Defense schools (228) and 1-1/2 years behind their peers in Florida (224). Wisconsin students who qualify for free or reduced lunch (207) score approximately 1-1/2 years behind similar students in Florida and Massachusetts (220). Wisconsin students who do not qualify for free and reduced lunch (236) are the highest ranking group in our state, but their peers in Washington D.C. (248) and Massachusetts (247) score approximately a grade level higher.
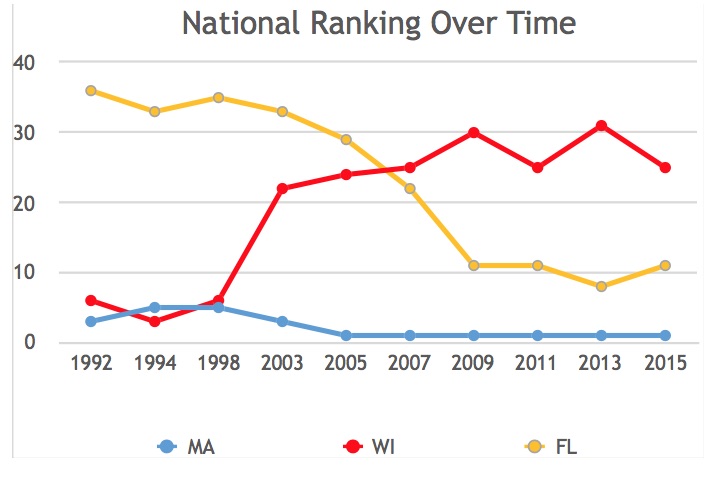
State Ranking Over Time
Wisconsin 4th graders rank 25th out of 52 jurisdictions that took the 2015 NAEP exam. In the past decade, our national ranking has seen some bumps up or down (we were 31st in 2013), but the overall trend since 1998 is a decline in Wisconsin’s national ranking (we were 3rd in 1994). Our change in national ranking is entirely due to statistically significant changes in scores in other jurisdictions. As noted above, Wisconsin’s scores have been flat since 1992.
The Positive Effect of Demographics
Compared to many other jurisdictions, Wisconsin has proportionately fewer students in the lower performing sub-groups (students of color, low-income students, etc.). This demographic reality allows our state to have a higher average score than another state with a greater proportion of students in the lower performing sub-groups, even if all or most of that state’s subgroups outperform their sub-group peers in Wisconsin. If we readjusted the NAEP scores to balance demographics between jurisdictions, Wisconsin would rank lower than 25th in the nation. When we did this demographic equalization analysis in 2009, Wisconsin dropped from 30th place to 43rd place nationally.
Applying Standard Statistical Analysis to DPI’s Claims
In its official news release on the NAEP scores on October 28, 2015, DPI accurately stated that Wisconsin results were “steady.” After more than a decade of “steady” scores, one could argue that “flat” or “stagnant” would be more descriptive terms. However, we cannot quibble with “steady.” We do take issue with the subtitle “Positive movement in reading,” and the statement that “There was a positive upward movement at both grade levels in reading.” In fact, the DPI release acknowledges in the very next sentence, “Grade level scores for state students in both mathematics and reading were considered statistically the same as state scores on the 2013 NAEP.” The NAEP website points out that Wisconsin’s 4th grade reading score was also statistically the same as the state score on the 2003 NAEP, and this year’s actual score is lower than in 1992. It is misleading to say that there has been positive upward movement in 4th grade reading. (emphasis added).
Regarding our 4th grade ranking of 25th in the nation, DPI’s ConnectEd newsletter makes the optimistic, but unsupportable, claim that “When analyzed for statistical significance, the state’s ranking might be viewed as even higher: “tied” for . . . 13th in fourth grade reading.”
Wisconsin is in a group of 16 jurisdictions whose scores (218-224) are statistically the same as the national average (221). 22 jurisdictions have scores (224-235) statistically above the national average, and 14 have scores (207-218) statistically below the national average. Scoring third place in that middle group of states is how NAEP assigned Wisconsin a 25th ranking.
When we use Wisconsin as the focal jurisdiction, 12 jurisdictions have scores (227-235) statistically higher than ours (223), 23 jurisdictions have scores (220-227) that are statistically the same, and 16 have scores (207-219) that are statistically lower. This is NOT the same as saying we rank 13th.
To assume we are doing as well as the state in 13th place is a combination of the probability that we are better than our score, and they are worse than theirs: that we had very bad luck on the NAEP administration, and that other state had very good luck. If we took the test again, there is a small probability, less than 3%, that our score would rise and theirs would fall, and we would meet in the middle, tied for 19th, not 13th, place. The probability that the other state would continue to perform just as well and we would score enough better to move up into a tie for 13th place is infinitesimal: a tiny fraction of a percentage. Not only is that highly unlikely, it is no more true than saying we could be viewed as tied with the jurisdiction at the bottom of our group, ranking 36th.
Furthermore, this assertion requires us to misuse not only this year’s data, but the data from past years which showed us at more or less the same place in the rankings. When you look at all the NAEP data across time and see how consistent the results are, the likelihood we are actually much better than our current rank shrinks to nearly nothing. It would require that not only were we incredibly unlucky in the 2015 administration, but we have been incredibly unlucky in every administration for the past decade. The likelihood of such an occurrence would be in the neighborhood of one in a billion billion.
Until now, DPI has never stated a reason for our mediocre NAEP performance. They have always declined to speculate. And now, of all the reasons they might consider to explain why our young children read so poorly and are falling further behind students in other states, they suggest it may just be bad luck. Whether they really believe that, or are tossing it out as a distraction from the actual facts is not entirely clear. Either way, it is a disappointing reaction from the agency that jealously guards its authority to guide education in Wisconsin.
Wisconsin Reading Coalition PDF summary.