An update to Barb Schrank’s November, 2005 post:
 |
 |
 |
Comments from a reader:
At $6,000 per child that’s about $16 million per year. At $9,000 per child, that’s about $23 million per year. If we kept 332, that would be $2-3 million more per year.
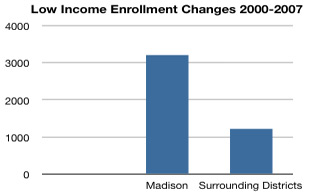
Also, MMSD not only lost students, which has a negative effect on what the district gets under revenue caps, we’ve increased our low-income population, which means that for every dollar the district gets, more of those dollars need to be spent on non-instructional services.
If the district does not consider the economic development implications of its decisions, we’re likely to
- see more go to school outside MMSD, or
- for the non-low income students who go to school here increased family dollars will be spent on private aspects of education- lessons, tutoring, etc.
Madison’s population in 2000 was 208,054 and is estimated to be 223,389, according to the census bureau. Madison’s poverty rate is estimated to be 13%, according to the Small Area Estimates Branch [Website].
| District | Enrollment 2000-2001 |
Enrollment 2006-2007 |
Per Student Spending (06/07 Budget) | Administrators | Total Staff | ACT % Tested (05-06) | ACT Comp Score |
|---|---|---|---|---|---|---|---|
| Madison | 25,087 | 24,755 | $12,422 | 91.5 | 3544.6 | 61.1 | 24.2 |
| Verona | 4222 | 4540 | $12,113 | 22 | 603.4 | 69.6 | 23.6 |
| Middleton-Cross Plains | 5125 | 5640 | $12,822 | 21 | 756.3 | 73 | 24.5 |
| Waunakee | 2836 | 3357 | $11,987 | 14 | 427.6 | 70.7 | 23.3 |
| Sun Priarie | 4776 | 5946 | $11,238 | 20 | 741.3 | 62.6 | 23 |
| McFarland | 1951 | 2017 | $11,853 | 9.5 | 251.2 | 64 | 23.7 |
| Monona Grove | 2702 | 2885 | $12,289 | 13 | 388 | 71.4 | 22.6 |
| Oregon | 3430 | 3588 | $11,572 | 15 | 465.1 | 59.2 | 23.2 |
Data sources:
- Wisconsin Department of Public Instruction
- Wisconsin School District Poverty Estimates (2005)
- WISTAX SchoolFacts07
Thanks to a number of readers for the updated information.
But until you understand WHY urban to suburban flight is happening, all these statistics are meaningless. After all, Madison and the MMSD are not unique to this phenomena. Has there ever been a definitive survey done of every family who has moved to suburbia? I bet sports is just as prevalent a reason as anything!
I think that’s one of the points in presenting this information.
Thanks for sharing the stats Barb. According to DPI data that I have looked at, MMSD’s “cost per member” is even a bit higher than your numbers indicate. I have looked at two locations on the DPI site and they show the following “costs per member”: $13,027 (Source A – http://www2.dpi.state.wi.us/sfsdw/Std_Rpts_Results.asp) and $13,201(Source B – http://dpi.wi.gov/sfs/xls). Using additional data from Source B, I calculated the average “cost per member” to be $11,159 for the ten other districts in WI with enrollments in excess of 10,000 students. So it looks as though MMSD spends $2026 (or 18%) more per member than the other large districts. Seems like a lot to me. Also, the breakdown of revenue sources for MMSD at this site looks very different from the other districts – most of the MMSD revenue appears to come from property taxes while most of the revenue in the other districts comes from state taxes. This is puzzling. Perhaps someone with more financial savvy could explain it.
Nancy,
Thank you for your comments and information. FYI – someone else prepared the updated information contained here.
Re the expenditures. The higher expenditures for MMSD likely due to larger numbers for low income, ELL and special education students in the district.
Re the revenue. Madison does get fewer dollars from the surrounding districts, because our property values are higher. The state equalization formula is based upon property values. For example, Milwaukee’s property values are lower (across the entire city). I think they receive more than 75% of their dollars from the state rather than from property taxes. It’s a big hit for Madison, because of the larger percentage of low income, ELL and special education costs for which the district is not reimbursed but is legally bound to make.
correction – the district does receive separate monies from the state and federal governments for special ed, low income and ELL students; however, the reimbursement for these expenditures was never 100%, have not been what was originally promised, and definitely has not kept pace with the district’s needs or changing population.
Do the comments above mean that our higher property assessments, while providing more taxes to help pay for city services, somehow decrease our school funding?
Barb S has been pushing the issue of loss of students for many years now, and David’s criticism is well taken, along with information regarding revenue and expenditures.
But the point I have taken for years myself on all matters involving data that is used to support one position or another, is that the educational hucksters and politicians purposefully collect data or do not collect data with the express purpose of not being held accountable.
No, as David says, there is nothing in the data to show why the moves are occurring — so he is free to speculate that perhaps sports is just as good a reason as any, while Barb is free to speculate some aspects of school quality is a reason. And Barb S is free to speculate that MMSD expenditures are higher than “like” districts “likely due to the larger numbers of low income….”
These questions are really not that difficult to answer; in some cases the data is likely available. But those that have the data certainly are 1) too incompetent to analyze the data, 2) do not want to answer the question.
You see, we are all left to speculate and the educrats and politicians thrive on such crap data. They have never and will never collect nor analyze any data that might actually allow the public to make informed decisions (assuming the general public has the competence or even wants to make an informed decision, especially if the data and decision goes against the preconceived notions). Essentially, all speculations cancel each other out.
The perfect power vacuum leaving the educational establishment of hucksters to control everything — and they do. It is they who could collect relevant data, but they don’t and won’t.
Every statistic they publish is useless at getting at the truth, ideal only in the world of the incompetent.
1) Graduation rate? Just because a kid graduates doesn’t mean he/she has a high school education.
2) Standardized test scores? What do they measure? The tests change all the time. Politics determines the cut-scores. Politics determines the questions.
3) State standards? All over the board. Meaningless abstractions.
4) Best high school ratings. Best college ratings. Worthless drivel.
5) Drop out rate. Did they drop out of school or merely move elsewhere? Who knows?
6) NAEP scores? What does it measure? Politics determine the cut-scores. Politics determine the questions.
Challenge. Find any information in the education field that actually allows one to come to any valid conclusion and make any rational decision on how to improve the educational system (or even determine if it needs improvement).
You know Larry, sometimes I think it just pure apathy on the part of the educrats, the government, AND the citizens, regarding the exact scenario you have laid out…
pushing is incorrect. i did not even do the recent analysis for what that’s worth:) i’ve had my head in fine arts data on the fine arts task force this past year, trying to assemble information in somewhat of a coherent way. that’s plenty for me, thank you.