New York spends the most, but its results are middling. Mississippi, Texas, Florida get the most bang for their buck.
Take New York, for example. In its latest “Making the Grade” report, the Education Law Center adjusted school spending figures relative to their regional labor market costs. It gave New York’s school funding system an A for the total amount of money it sent to public schools, a B for the distribution of those funds among schools and an A for the amount of money it spent relative to the state’s overall gross domestic product per capita.
Overall, New York came out as one of the top-rated school funding systems, if not the highest-rated.
And yet, New York students perform slightly below national averages. While its schools spent $33,970 per student, $15,509 more per pupil than the rest of the country, in Fiscal Year 2022 its students trailedoverall student performance in fourth-grade math on the National Assessment of Educational Progress — the “Nation’s Report Card.”
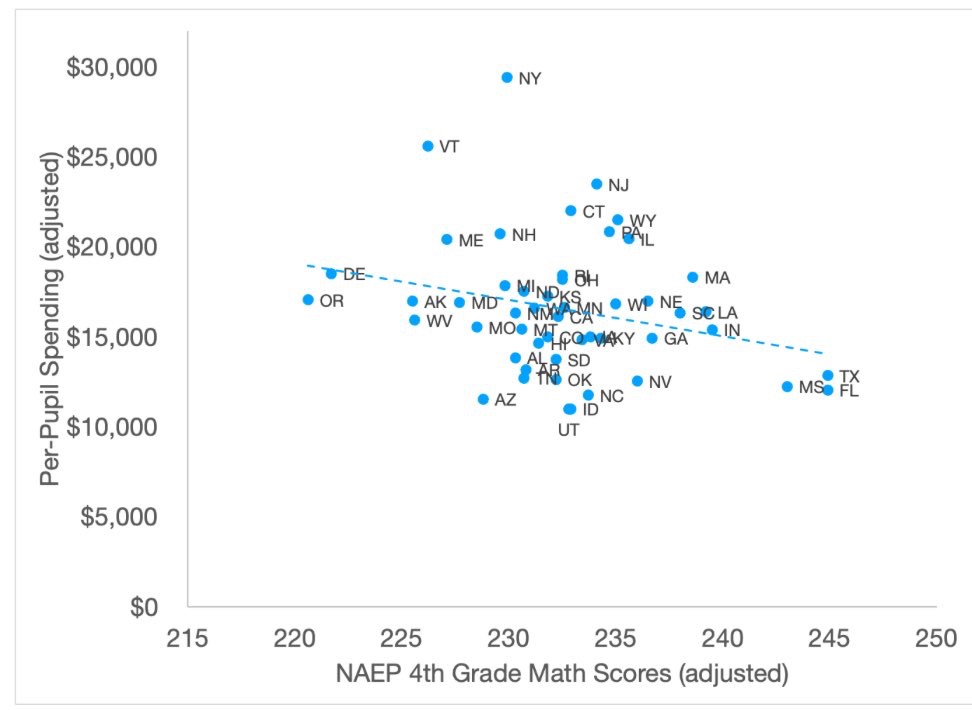
But it’s not just New York. The relationship between school spending and student outcomes is weaker than you might imagine. To make the fairest comparison possible, I used the Education Law Center’s spending figures, which are adjusted for cost-of-living differences, and the demographically adjusted NAEP scores from the Urban Institute.
The graph below shows the results for 2022, the latest year for which comparable spending figures are available. As you can see, New York is an extreme outlier: It spent more than any other state, and its results were in the bottom half. Other high-spending states like Vermont, New Jersey and Connecticut also got pretty poor results given their investments.
Which states do well on this metric? Texas, Florida and Mississippi all stand out for getting strong student outcomes despite not spending that much.
——-
More.