A “Value Added” Report for the Madison School District
Kurt Kiefer:
Attached are the most recent results from our MMSD value added analysis project, and effort in which we are collaborating with the Wisconsin center for Educational Research Value Added Research Center (WCERVARC). These data include the two-year models for both the 2006-2008 and 2005-2007 school year spans.
This allows us in a single report to view value added performance for consecutive intervals of time and thereby begin to identify trends. Obviously, it is a trend pattern that will provide the greatest insights into best practices in our schools.
As it relates to results, there do seem to be some patterns emerging among elementary schools especially in regard to mathematics. As for middle schools, the variation across schools is once again – as it was last year with the first set of value added results – remarkably narrow, i.e., schools perform very similar to each other, statistically speaking.
Also included in this report are attachments that show the type of information used with our school principals and staff in their professional development sessions focused on how to interpret and use the data meaningfully. The feedback from the sessions has been very positive.
Much more on the Madison School District’s Value Added Assessment program here. The “value added assessment” data is based on Wisconsin’s oft-criticized WKCE.
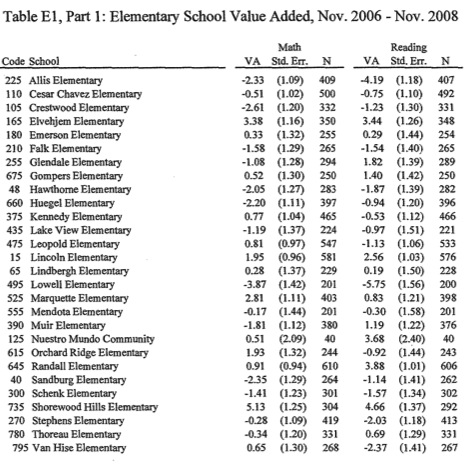
Table E1 presents value added at the school level for 28 elementary schools in Madison Metropolitan School District. Values added are presented for two overlapping time periods; the period between the November 2005 to November 2007 WKCE administrations, and the more recent period between the November 2006 and November 2008 WKCE. This presents value added as a two-year moving average to increase precision and avoid overinterpretation of trends. Value added is measured in reading and math.
VA is equal to the school’s value added. It is equal to the number ofextra points students at a school scored on the WKCE relative to observationally similar students across the district A school with a zero value added is an average school in terms of value added. Students at a school with a value added of 3 scored 3 points higher on the WKCE on average than observationally similar students at other schools.
Std. Err. is the standard error ofthe school’s value added. Because schools have only a finite number of students, value added (and any other school-level statistic) is measured with some error. Although it is impossible to ascertain the sign of measurement error, we can measure its likely magnitude by using its standard error. This makes it possible to create a plausible range for a school’s true value added. In particular, a school’s measured value added plus or minus 1.96 standard errors provides a 95 percent confidence interval for a school’s true value added.
N is the number of students used to measure value added. It covers students whose WKCE scores can be matched from one year to the next.