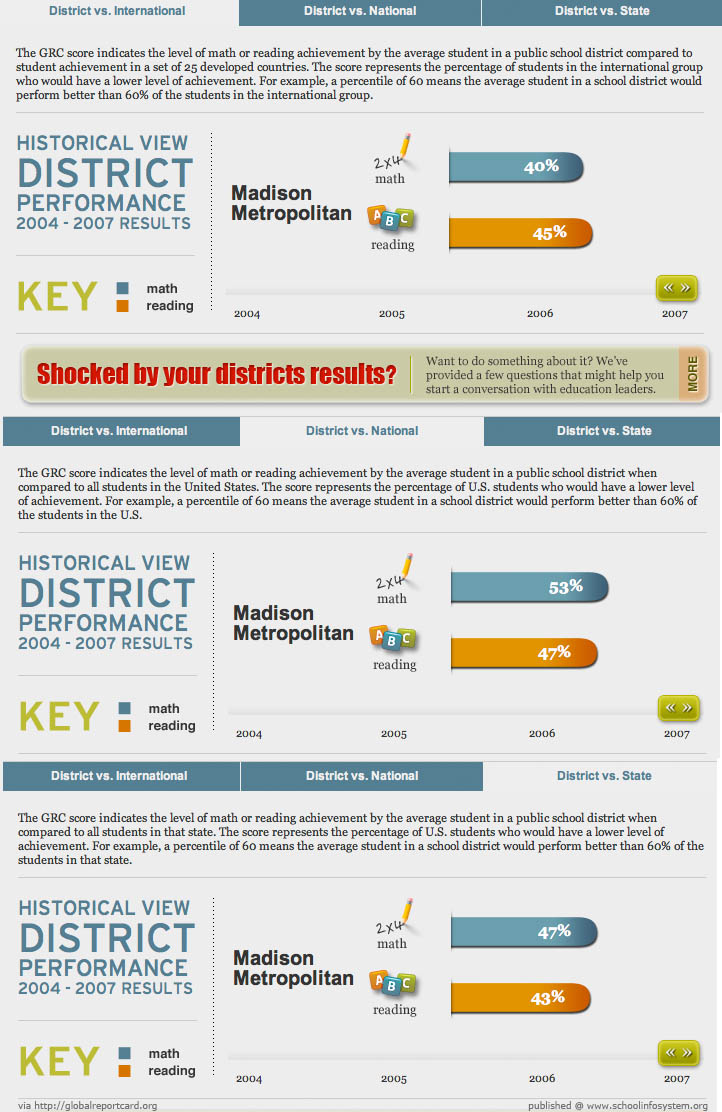
The Global Report: Compare US School Districts to the World

The Global Report Card, via a kind Chan Stroman-Roll email:
The Global Report Card was developed by Jay P. Greene and Josh B. McGee as part of the George W. Bush Institute's Education Reform Initiative. The Bush Institute works to increase dramatically the number of American students who graduate high school ready for college or prepared for a good career by:- cultivating a new generation of principals
- implementing cutting edge research
- advancing accountability
Driven by accountability and data, these initiatives challenge the status quo and lead a wide range of partners to share goals and use clear metrics tied to student achievement.
Summary of Methodology
The calculations begin by evaluating the distributions of student achievement at the state, national, and international level. To allow for direct comparisons across state and national borders, and thus testing instruments, we map all testing data to the standard normal curve using the appropriate student level mean and standard deviation. We then calculate at the lowest level of aggregation by estimating average district quality within each state. Each state's average quality is evaluated then using national testing data. And finally, the average national quality is determined using international testing data. Essentially, this re-centers our distribution of district quality based upon the relative performance of the individual state when compared to the nation as a whole as well as the relative performance of the nation when compared to our economic competitors.
For example, the average student in Scarsdale School District in Westchester County, New York scored nearly one standard deviation above the mean for New York on the state's math exam. The average student in New York scored six hundredths of a standard deviation above the national average of the NAEP exam given in the same year, and the average student in the United States scored about as far in the negative direction (-.055) from the international average on PISA. Our final index score for Scarsdale in 2007 is equal to the sum of the district, state, and national estimates (1+.06+ -.055 = 1.055). Since the final index score is expired in standard deviation units, it can easily be converted to a percentile for easy interpretation. In our example, Scarsdale would rank at the seventy seventh percentile internationally in math.
The
Best United States School Districts (2007 Math data) [PDF].
Related: www.wisconsin2.org and 1990-2010 US High School & College Graduation Comparison.
Posted by Jim Zellmer at September 27, 2011 10:45 AM
Subscribe to this site via RSS/Atom:  Newsletter signup | Send us your ideas
Swallow School District, ranked #25 in the report, consists of one school (K-8) in Hartland, Wisconsin. The school has around 600 students. The district has a median household income of over $106,500, less than 1% free and reduced lunch, and is 97% white and 2% asian. The district, having no high school itself, feeds into Arrowhead high school.


 | Newsletter signup | Send us your ideas
 Newsletter signup | Send us your ideas