| School Information System |
|
|
 | Newsletter signup | Send us your ideas
June 22, 2007More on WKCE scores - Missing StudentsChan Stroman posted a valuable and in-depth examination of the District's WKCE scores, and is it in the spirit of that posting that I would like to share my own little examination of our most recent test results. Rather than focusing on the scores of our students, this is an investigation of the numbers of MMSD students who took the WKCE exams. My intention is to simply present the data and let the reader draw their own conclusions. This journey began with a question: How did students at West High School do on the WKCE exams now that the school has completed their three year Small Learning Communities grant. A relatively straightforward question that can be addressed by a visit to the DPI web site. However, in the process of looking at West High School's test data from the Fall of 2006, it was surprising to see that only 39 African American students had been tested. Certainly there had to be more than 39 African American 10th graders at West this year, and if we want WKCE scores to provide an accurate assessment of the The District makes available a number of breakdowns of student enrollment data by grade, by school, by ethnicity, by income status, and combinations thereof. However, there is not a breakdown that provides enrollment numbers by school by grade by ethnicity. Thus, if we want to know the number of African American 10th graders at a particular school we have to make an educated guess. We can do that by taking the percentage of African American students enrolled in the school and multiplying that by the number of students in the 10th grade. This gives us a rough estimate of the number of students enrolled. We can then compare that to the number of students who took the WKCE test to estimate the percentage of missing students. West High School had 517 10th graders enrolled this past year, and 14% of the student body was African American. This suggests that there should be approximately 73 African American 10th graders at West which means that 34 students or 46.6% were not tested. This is very different from the overall proportion of West 10th graders not tested: 14.5% (DPI data show that 442 of the 517 students in the 10th grade were tested this past year). However, this is only one year's data at one of our high schools. We need to put this data in context if we are to draw any conclusions. So here is the data for the four high schools for the past five years.
What about other ways to look at the number of high school students who took the WKCE's? More than race or ethnicity, research clearly shows that school performance is strongly linked to socio-economic status. Thus we can ask are low income students represented to the same degree on the WKCE as non-economically disadvantaged students. Again because the posted enrollment statistics for the district don't provide a breakdown of economic status by grade within a school we have to estimate the numbers of students from the overall school percentages. Given that we know that the percentage of free and reduced lunch students are increasing in our high schools, the use of a whole school perecentage to estimate the 10th grade population will likely underestimate the numbers of low income students, but these numbers are still a starting point. Here are those data for our four high schools:
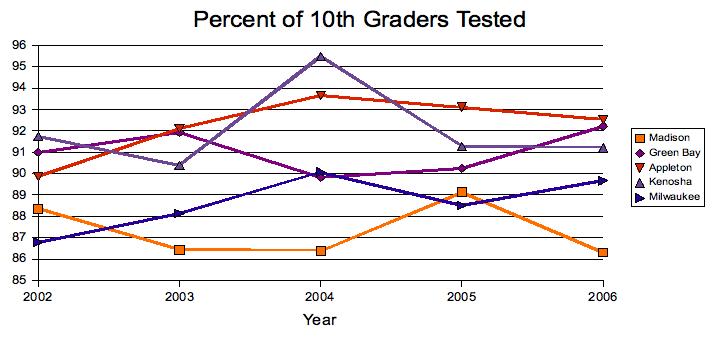
It is hard to tell if there is any pattern in the data, though it does look like we, as a District, are gradually getting better at getting our low income students tested at similiar rates as our non-economically disadvantaged students. However, when you look at overall percentages of students tested, it does not seem that Madison is doing a very good job of testing students. This is what DPI says about student participation: All students are expected to take WSAS assessments except students who are excused by their parents. Only a fraction of a percentage of students statewide are excused from WKCE testing by their parents. An extended testing window is provided so that students who are absent on any given day can take make-up tests. Some students are not assessed possibly due to long-term absences or other reasons. While this suggests that MMSD is not meeting the expectations of DPI regarding student assessment, it is reasonable to ask how other similar districts around the state are doing in their testing of 10th grade students. For this comparison, I examined enrollment data and number of students tested for Green Bay, Appleton, Kenosha, and Milwaukee school districts. All of these numbers come from DPI and reflect students in all high schools and alternative programs. As an aside, I will note that the third Friday enrollment numbers listed by MMSD do not match those posted on the DPI website, and it is for the sake of an honest comparison that I have used DPI numbers for all five districts.
When we look at these data, we see that MMSD tests fewer of its 10th graders than all four of the chosen districts, even Milwaukee tests a larger percentage!
So there it all is for you, the reader, to chew on. What do you think it means and what do you think it says about our district? Posted by Jeff Henriques at June 22, 2007 11:34 AMSubscribe to this site via RSS/Atom: Newsletter signup | Send us your ideas
|