Search Results for: wkce should not be used
Study praises Wisconsin for raising the bar on state exams; RIP WKCE Low Standards?
Erin Richards Eight years ago, a study found Wisconsin had one of the lowest bars in the country for rating students proficient in reading and math on the state standardized test. That means children here looked more academically accomplished than they probably really were — something the state aimed to remedy by raising the scores […]
To test or not to test, public education’s epic drama
Alan Borsuk: Not long ago, some people on the left and some on the right hated tests, but they weren’t much of a force. Now, everyone hates tests — there are too many, they waste time, they don’t prove anything, they stress everyone out, they’re of low quality, they distort education, they’re being used for […]
2012-13 MMSD WKCE Results
Tap or click to view a larger version.Higher bar for WKCE results paints different picture of student achievement
Matt DeFour
Wisconsin student test scores released Tuesday look very different than they did a year ago, though not because of any major shift in student performance.
Similar to recent years, the Wisconsin Knowledge and Concepts Exam results show gains in math and reading over the past five years, a persistent and growing performance gap between black and white students, and Milwaukee and Racine public school students outperforming their peers in the private school voucher program.
But the biggest difference is the scores reflect a higher bar for what students in each grade level should know and be able to do.
Only 36.2 percent of students who took the reading test last October met the new proficiency bar. Fewer than half, 48.1 percent, of students were proficient in math. When 2011-12 results were released last spring, those figures were both closer to 80 percent.
The change doesn’t reflect a precipitous drop in student test scores. The average scores in reading and math are about the same as last year for each grade level.
Instead, the change reflects a more rigorous standard for proficiency similar to what is used for the National Assessment of Educational Progress. NAEP is administered to a sample of students in each state every other year and is referred to as “the nation’s report card.”
The state agreed to raise the proficiency benchmark in math and reading last year in order to qualify for a waiver from requirements under the federal No Child Left Behind law. The benchmark did not rise for the language arts, science and social studies tests.
“Adjusting to higher expectations will take time and effort,” State Superintendent of Public Instruction Tony Evers said. “But these are necessary changes that will ultimately help our schools better prepare all students to be college and career ready and link with work being done throughout the state to implement new standards.”
Evers also called on the Legislature to include private voucher schools in the state’s new accountability system.
He highlighted that test scores for all Milwaukee and Racine students need to improve. Among Milwaukee voucher students, 10.8 percent in reading and 11.9 percent in math scored proficient or better. Among Milwaukee public school students, it was 14.2 percent in reading and 19.7 percent in math.
Gov. Scott Walker has proposed expanding the state’s voucher program, including to such districts as Madison.
Changes in Dane County
The state previously announced how the changing bar would affect scores statewide and parents have seen their own students’ results in recent weeks, but the new figures for the first time show the impact on entire schools and districts.
In Dane County school districts, the percentage of students scoring proficient or better on the test dropped on average by 42 percentage points in reading and 25 percentage points in math.
Madison schools had one of the smallest drops compared to its neighboring districts.
Madison superintendent Jennifer Cheatham noted schools with a higher number of students scoring in the “advanced” category experienced less of a drop. Madison’s smaller drop could reflect a higher proportion of students scoring in the top tier.
At the same time, Madison didn’t narrow the gap between minority and white student test results. Only 9 percent of black sixth-graders and only 2 percent of sixth-grade English language learners scored proficient in reading.
“It reinforces the importance of our work in the years ahead,” Cheatham said. “We’re going to work on accelerating student outcomes.”
Middleton-Cross Plains School Board president Ellen Lindgren said she hasn’t heard many complaints from parents whose students suddenly dropped a tier on the test. Like Madison and other districts across the state, Middleton-Cross Plains sent home letters bracing parents for the change.
But Lindgren fears the changing standards come at the worst time for public schools, which have faced tougher scrutiny and reduced state support.
“I’m glad that the standards have been raised by the state, because they were low, but this interim year, hopefully people won’t panic too much,” Lindgren said. “The public has been sold on the idea that we’re failing in our education system, and I just don’t believe that’s true.”
Next fall will be the last year students in grades 3-8 and 10 take the paper-and-pencil WKCE math and reading tests. Wisconsin is part of a coalition of states planning to administer a new computer-based test in the 2014-15 school year.
The proposed state budget also provides for students in grades 9-11 to take the EXPLORE, PLAN and ACT college and career readiness tests in future years.Superintendent Cheatham is to be commended for her informed, intelligent and honest reaction to the MMSD’s results when compared to those of neighboring districts.
View a WKCE summary here (PDF).

Wisconsin education chief: Governor’s new report cards not ‘ready for prime time’
The state’s top education official warned the Legislature’s budget committee Thursday that Gov. Scott Walker’s proposal to tie funding and voucher expansion to new state report cards could undermine bipartisan reform efforts already underway.
State Superintendent of Public Instruction Tony Evers said the new report cards “aren’t ready for prime time” and will look “a lot different eight years from now.”
Evers agreed with Sen. Luther Olsen, R-Ripon, a member of the Joint Finance Committee and chairman of the Senate Education Committee, that the report cards should be used “as a flashlight and not a hammer.”
“If we use them as a hammer it’s going to make all the other transformative efforts we’re doing more difficult,” Evers said, referring to new curriculum, testing and teacher evaluation systems that were developed by a bipartisan coalition of teachers, administrators, school boards and political leaders in recent years.
“Teachers will back off,” he said.2008: “Schools should not rely on only WKCE data to gauge progress of individual students or to determine effectiveness of programs or curriculum”. Parents, students and taxpayers might wonder what precisely the DPI has been doing since 2008? The WKCE has been long criticized for its lack of rigor.
Related: Matthew DeFour’s tweets from Mr. Evers recent budget appearance.
WKCE Scores Document Decline in the Percentage of Madison’s Advanced Students
For many years now, parents and community members, including members of Madison United for Academic Excellence, have expressed concerns about the decline in rigor and the lack of adequate challenge in our district’s curriculum. The release this week of WKCE scores for the November 2008 testing led me to wonder about the performance of our district’s strongest students. While most analyses of WKCE scores focus on the percentages of students scoring at the Advanced and Proficient levels, these numbers do not tell us about changes in the percent of students at each particular level of performance. We can have large increases in the percent of students scoring at the Proficient and Advanced levels because we have improved the performance of students who were previously at the Basic level on the WKCE, but yet fail to have any effect on the performance of our district’s strongest students. This is the argument that we are improving the performance of our low ability students, but failing to increase the performance of our already successful students. An examination of the numbers of students who are performing at just the Advanced level on the WKCE provides us with some insight into the academic progress of our more successful students.
I decided to examine WKCE math scores for students across the district. While it is not possible to track the performance of individual students, it is possible to follow the performance of a cohort as they advance through the system. Thus students who are now in 10th grade, took the 8th grade WKCE in 2006 and the 4th grade test in 2002. Because there have been significant changes in the demographics of the district’s students, I split the data by socio-economic status to remove the possibility of declines in WKCE performance simply being the result of increased numbers of low income students. Although the WKCE has been criticized for not being a rigorous enough assessment tool, the data on our students’ math performance are not encouraging. The figures below indicate that the percent of students scoring at the Advanced level on the WKCE decreases as students progress through the system, and this decline is seen in both our low income students and in our Not Economically Disadvantaged students. The figures suggest that while there is some growth in the percent of Advanced performing students in elementary school, there is a significant decline in performance once students begin taking math in our middle schools and this decline continues through high school. I confess that I take no pleasure in sharing this data; in fact, it makes me sick.
Because it might be more useful to examine actual numbers, I have provided tables showing the data used in the figures above. Reading across a row shows the percent of students in a class cohort scoring at the Advanced level as they have taken the WKCE test as they progressed from grades 3 – 10.
Percent of Economically Disadvantaged Students Scoring at the Advanced Level on the WKCE Math Test Between 2002 and 2008
Graduation Year 3rd Grade 4th Grade 5th Grade 6th Grade 7th Grade 8th Grade 10th Grade 2005 2006 2007 2008 2009 2010 2011 2012 2013 2014 2015 2016 2017 2018
Another Look at the Madison School District’s Use of “Value Added Assessment”
The analysis of data from 27 elementary schools and 11 middle schools is based on scores from the Wisconsin Knowledge and Concepts Examination (WKCE), a state test required by the federal No Child Left Behind law.
Madison is the second Wisconsin district, after Milwaukee, to make a major push toward value-added systems, which are gaining support nationally as an improved way of measuring school performance.
Advocates say it’s better to track specific students’ gains over time than the current system, which holds schools accountable for how many students at a single point in time are rated proficient on state tests.
“This is very important,” Madison schools Superintendent Daniel Nerad said. “We think it’s a particularly fair way … because it’s looking at the growth in that school and ascertaining the influence that the school is having on that outcome.”
The findings will be used to pinpoint effective teaching methods and classroom design strategies, officials said. But they won’t be used to evaluate teachers: That’s forbidden by state law.
The district paid about $60,000 for the study.Much more on “Value Added Assessment” here.
Ironically, the Wisconsin Department of Public Instruction stated the following:“… The WKCE is a large-scale assessment designed to provide a snapshot of how well a district or school is doing at helping all students reach proficiency on state standards, with a focus on school and district-level accountability. A large-scale, summative assessment such as the WKCE is not designed to provide diagnostic information about individual students. Those assessments are best done at the local level, where immediate results can be obtained. Schools should not rely on only WKCE data to gauge progress of individual students or to determine effectiveness of programs or curriculum.”
Related:

Dane County, WI Schools Consider MAP Assessement Tests After Frustration with State WKCE Exams
Waunakee Urges that the State Dump the WKCE
Andy Hall takes a look at a useful topic:
From Wisconsin Heights on the west to Marshall on the east, 10 Dane County school districts and the private Eagle School in Fitchburg are among more than 170 Wisconsin public and private school systems purchasing tests from Northwest Evaluation Association, a nonprofit group based in the state of Oregon.
The aim of those tests, known as Measures of Academic Progress, and others purchased from other vendors, is to give educators, students and parents more information about students ‘ strengths and weaknesses. Officials at these districts say the cost, about $12 per student per year for MAP tests, is a good investment.
The tests ‘ popularity also reflects widespread frustration over the state ‘s $10 million testing program, the Wisconsin Knowledge and Concepts Examination.
Critics say that WKCE, which is used to hold schools accountable under the federal No Child Left Behind law, fails to provide adequate data to help improve the teaching methods and curriculum used in the classrooms.
They complain that because the tests are administered just once a year, and it takes nearly six months to receive the results, the information arrives in May — too late to be of use to teachers during the school year.
The testing controversy is “a healthy debate, ” said Tony Evers, deputy state superintendent of public instruction, whose agency contends that there ‘s room for both WKCE and MAP.
….
“It ‘s a test that we feel is much more relevant to assisting students and helping them with their skills development, ” said Mike Hensgen, director of curriculum and instruction for the Waunakee School District, who acknowledges he ‘s a radical in his dislike of WKCE.
“To me, the WKCE is not rigorous enough. When a kid sees he ‘s proficient, ‘ he thinks he ‘s fine. ”
Hensgen contends that the WKCE, which is based on the state ‘s academic content for each grade level, does a poor job of depicting what elite students, and students performing at the bottom level, really know.
The Waunakee School Board, in a letter being distributed this month, is urging state legislators and education officials to find ways to dump WKCE in favor of MAP and tests from ACT and other vendors.
- More on WKCE scores – Missing Students
- 2006 MMSD WKCE Scores: A Closer Look
- “Schools should not rely on only WKCE data to gauge progress of individual students or to determine effectiveness of programs or curriculum”
- The Fordham Foundation has given Wisconsin’s state standards a “D”.
- Imperial College Ditches A Levels and Sets its own Entrance Exam
“Schools should not rely on only WKCE data to gauge progress of individual students or to determine effectiveness of programs or curriculum”
Peter Sobol on the 2007 Wisconsin DPI State test results (WKCE):
The results for the WKCE test administered in November 2007 were finally released on May 30th. That is more than six months after the test was given. Worse, the data files containing the detailed results that can be used for proper statistical analysis of the results are STILL not available for download. Assessments are information that degrades over time. The fact that it takes six months to get the data out (whatever its other shortcomings) cheats the taxpayers of the full value of their investment.
At the very least the WI DPI should be embarrassed by the fact it takes this long to release the test results. Personally I find it outrageous. I had an email exchange with DPI officials concerning this long delay and the loss of value, this is an excerpt from part of that response (italics mine):… The WKCE is a large-scale assessment designed to provide a snapshot of how well a district or school is doing at helping all students reach proficiency on state standards, with a focus on school and district-level accountability. A large-scale, summative assessment such as the WKCE is not designed to provide diagnostic information about individual students. Those assessments are best done at the local level, where immediate results can be obtained. Schools should not rely on only WKCE data to gauge progress of individual students or to determine effectiveness of programs or curriculum.
Does anyone else find the fact that the state issues WKCE results to individual students surprising given the above statement?
The Madison School District, together with the Wisconsin Center for Education Research is using local WKCE results for “Value Added Assessment“.
Much more on the WKCE here.
Minnesota recently administered their first online science test.
More on WKCE scores – Missing Students
Chan Stroman posted a valuable and in-depth examination of the District’s WKCE scores, and is it in the spirit of that posting that I would like to share my own little examination of our most recent test results. Rather than focusing on the scores of our students, this is an investigation of the numbers of […]
Wisconsin’s “Broad interpretation of how NCLB progress can be “met” through the WKCE”
A reader involved in these issues forwarded this article by Kevin Carey: Hot Air: How States Inflate Their Educational Progress Under NCLB [Full Report: 180K PDF] Critics on both the Left and the Right have charged that the No Child Left Behind Act tramples states’ rights by imposing a federally mandated, one-size-fits-all accountability system on […]
Wisconsin DPI School rating commentary
Elizabeth Beyer: The new priority area, target group outcomes, replaced closing achievement gaps. The new priority area, DPI said, sheds additional light on students in schools with low test scores. The measure was designed to help focus support on the learners who need it most, while also improving outcomes for all students, according to DPI. “I […]
Seeing the Forest: Unpacking the Relationship Between Madison School District (WI) Graduation Rates and Student Achievement
Laurie Frost and Jeff Henriques [PDF]: Dear Simpson Street Free Press: Thank you for leading the way in looking more closely at recent reports of an increase in MMSD minority student graduation rates and related issues: http://simpsonstreetfreepress.org/special-report/local-education/rising-grad-rates http://simpsonstreetfreepress.org/special-report/local-education/act-college-readiness-gap Inspired by your excellent work, we decided to dig deeper. We call the result of our efforts […]
Wisconsin’s Performance on the 2015 NAEP
Tap for a larger version. Wisconsin Reading Coalition: Are you interested in how Wisconsin 4th graders’ reading performance stacks up against other 4th graders nationwide? The National Assessment of Education Progress (NAEP), administered every two years, is the one way we can get answers. See the attached document for the results from the 2015 NAEP, […]
The New Wisconsin Forward Exam
Wisconsin Reading Coalition: The Badger Exam lasted just one year, to be replaced this spring with the Wisconsin Forward Exam. Wisconsin contracted with Data Recognition Corporation (DRC) to develop the new test with input from Wisconsin teachers. In addition to rolling out the new assessment, DPI must complete the important process of setting proficiency standards. […]
Badger Exam results; Madison Substantially Lags State Results….
Tap for a larger version. Wisconsin Reading Coalition, via a kind email: LETRS Training For the fourth year, the Milwaukee Summer Reading Project will offer free training in Language Essentials for Teachers of Reading and Spelling (LETRS) in Milwaukee. Ten Saturday classes run from March into June. There are approximately ten open spots, with registration […]
analysis of math, reading scores ‘very disconcerting’
Greg Toppo: Decades of bleak results from kids’ standardized tests now seem almost routine, but a new study made public Tuesday scratches beneath the surface to pin down just how many students in major U.S. metropolitan areas can actually read or do math proficiently. The results: Startlingly few. If all of Detroit’s fourth-graders took the […]
Wisconsin DPI “Rule Making” vs. Legislation in the Courts..
Molly Beck: The conservative legal group Wisconsin Institute for Law and Liberty in a court filing this week asked the state Supreme Court to reverse an appeals court decision that upheld Evers’ rule-making authority related to education. The brief was filed on behalf of the state’s largest business lobbying group Wisconsin Manufacturers and Commerce, the […]
Commentary On Wisconsin’s K-12 test Regime…
Molly Beck: According to the Department of Administration, bids were sought for a Web-based exam testing third- through eighth-graders in English and fourth-, eighth- and 10th-graders in math and science. A separate bidding process was set up for a new exam to test students in social studies. Daniel Wilson of the DOA said the process […]
“Hard to make comparisons across years”
Alex Scharaschkin: The exams are finished and GCSE and A-level students are heading off for summer. But there are 12 weeks – and a lot of work – from “pens down” to results day Did you hear that noise? It’s the sound of thousands of students collectively breathing a sigh of relief. If April is […]
K-16 Governance: An Oxymoron? Wallace Hall Was Right About UT All Along
Jim Schutze: When Hall was early on the board, the university revealed to regents there were problems with a large private endowment used to provide off-the-books six-figure “forgivable loans” to certain faculty members, out of sight of the university’s formal compensation system. Hall wanted to know how big the forgivable loans were and who decided […]
No profit left behind
Stephanie Simon: A POLITICO investigation has found that Pearson stands to make tens of millions in taxpayer dollars and cuts in student tuition from deals arranged without competitive bids in states from Florida to Texas. The review also found Pearson’s contracts set forth specific performance targets — but don’t penalize the company when it fails […]
Why 14 Wisconsin high schools take international standardized test
Alan Borsuk: Patricia Deklotz, superintendent of the Kettle Moraine School District, said her district, west of Milwaukee, is generally high performing. But, Deklotz asked, if they talk a lot about getting students ready for the global economy, are they really doing it? PISA is a way to find out. “It raises the bar from comparing […]
Civics & the Ed Schools; Ripe for Vast Improvement
I have a special interest in Civics education. My high school civics/government teacher drilled the Constitution, Bill of Rights and the Federalist Papers into our small brains. This Vietnam Vet worked very hard to make sure that we understood how the US political system worked, or not. While reading the ongoing pervasive spying news, including […]
Commentary on Wisconsin K-12 Tax & Spending Increases, Voucher Changes
Lawmakers also want to expand school voucher programs beyond the borders of Milwaukee and eastern Racine County. The programs allow parents who meet income thresholds to send their children to religious schools and other private schools at taxpayer expense.
Under the motion approved 12-4 along party lines by Republicans on the budget panel:
- Public schools would receive $150 more per student in general aid this fall and another $150 increase the following year. The plan would cost $289 million over two years, with $231.5 million funded with state taxes and the rest with an additional $52 million in higher local property taxes and an increase in expected revenues from the state lottery.
School districts would have the authority to spend this new money. Walker wanted to give schools $129 million in state aid but require all of it to go toward property tax relief, rather than be used for new expenses.
Under the budget committee’s proposal, total property taxes would increase by less than 1% per year, with school levies going up somewhat more than that.- A new voucher program would become available to all students outside Milwaukee and Racine. It would be limited to 500 students the first year and 1,000 students every year thereafter. Walker wanted no limits on the number of students in the program after the second year.
If there are more students seeking slots in the program than allowed, the proposal would allocate the available slots by lottery. The slots would go to the 25 schools with the most applications, with each school getting at least 10 seats.- The new program would be available to students in any school district. Walker wanted to make it available in districts with 4,000 or more students that were identified as struggling on school report cards issued by the state.
- No more than 1% of the students of any given school district could participate in the new program.
- Over 12 years, the negative financial impacts for the Milwaukee Public Schools from the voucher program here would be phased out.
- The new program would be available to students of families making 185% of the federal poverty level or less — well below the income thresholds for Milwaukee and Racine. Those programs are available to families making up to 300% of the federal poverty level, with a higher threshold for married couples.
- Voucher schools in all parts of the state would receive $7,210 per K-8 student and $7,856 per high school student — up from $6,442 currently. Walker wanted to provide $7,050 for students in kindergarten through eighth grade and the same larger increase to high school students.
Secret voucher ‘deal’ boosts their $ by 9% at the expense of WI’s 870,000 public school kids. owl.li/lHhx2 #WIedu
— Tony Evers (@WISuptTonyEvers) June 5, 2013
Wisconsin DPI Superintendent Tony Evers (PDF):Today, Republican leaders are finalizing a deal to likely expand Wisconsin’s private school voucher program statewide. While this dramatic proposal has significant implications for citizens and taxpayers across Wisconsin, it has been developed behind closed doors with no public input, no public hearings, and no public fiscal analysis. If this proposal becomes law, taxpayers across Wisconsin will be financing a new entitlement for private school children whose tuition is currently paid for by their parents. To address the lack of information about the potential fiscal effects of this program, the attached table estimates potential long-term costs of statewide subsidization of private school tuition on a district-by-district basis. Cost to subsidize current private school students only: up to $560 million annually
While some lawmakers claim the purpose of the program is to provide educational choices to those who cannot afford it, the current school choice programs in Milwaukee and Racine provide vouchers to families who are already choosing to send their children to private schools. As many as 50% of the children participating in the Racine choice program were already in private schools when they began receiving a state-funded subsidy in
2011-12. If the voucher program is expanded statewide, it can be assumed that current private school families would also be eligible for this new entitlement.Related:
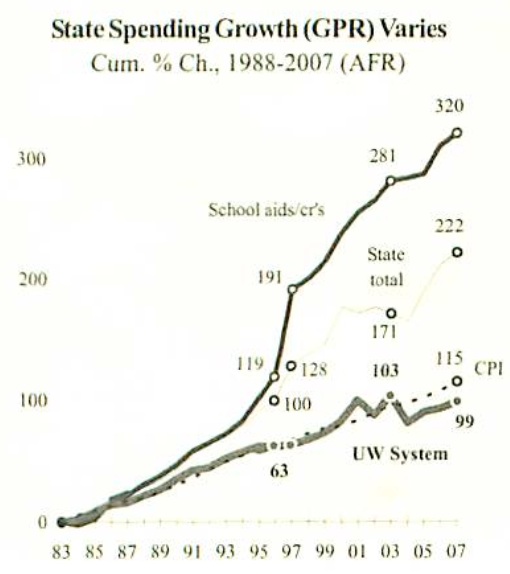
- Wisconsin State Tax Based K-12 Spending Growth Far Exceeds University Funding
- “Schools should not rely on only WKCE data to gauge progress of individual students or to determine effectiveness of programs or curriculum”
- Are MMSD Programs Effective? Who Knows.
- Tony Evers notes and links.
- Vouchers notes and links.
NJ DOE Releases New School Performance Reports; Wisconsin? Stays Quo…
At long last the New Jersey Department of Education has released its “NJ School Performance Reports,” which replace the old School Report Cards. Details on school performance is greatly expanded now includes, according to the Christie Administration’s press release, “brand new data on college and career readiness and provide comparison to “peer schools” in order to provide a more complete picture of school performance for educators and the general public.”
Here’s coverage from the Star-Ledger, The Record, the Courier-Post, Asbury Park Press, Press of Atlantic City, NJ Spotlight, and the Philadelphia Inquirer.
The state also released the annual Taxpayers’ Guide to Education. Annual per pupil spending in NJ (if you use the state’s algorithm; others say it inflates costs) is $18,045, up 4.2% since last year.
Of course, there’s enormous range within that average. Fairview Boro (Bergen), for example, spends $13,317 per pupil. Asbury Park City spends $30,502. The plush magnet schools in Bergen County spend $35,900.The Wisconsin DPI…..
April, 2013: Chief among them has been this notion from state superintendent Tony Evers that the state’s new accountability system, known as state report cards, shouldn’t be used to determine which districts get vouchers.
.
March, 2013: Evers on report cards: this last year was a pilot year. It’s just not ready for prime time.
June, 2008: “Schools should not rely on only WKCE data to gauge progress of individual students or to determine effectiveness of programs or curriculum”.
A Critique of the Wisconsin DPI and Proposed School Choice Changes
Chief among them has been this notion from state superintendent Tony Evers that the state’s new accountability system, known as state report cards, shouldn’t be used to determine which districts get vouchers.
Under Walker’s plan, districts with at least 4,000 students and two or more schools getting a D or an F under a new rating system would be eligible for vouchers. Evers — no fan of vouchers anyway — says the report cards were not intended for such use and need more refinement over several years.
But what was the purpose of spending more than a year working with a diverse group of education and business groups and state elected officials to create the report cards — which replaced the widely panned No Child Left Behind system — if not to use them to make consequential decisions about education?
On Thursday, Department of Public Instruction director of Education Information Services John Johnson called the report cards a “work in progress” that aren’t an appropriate tool for making a “major policy decision.”
Among their current limitations are that they are based on tests that are expected to change two years from now, they can’t show growth in high school student achievement, some schools weren’t rated, and there’s too little data to reliably identify trends in school performance.
Adam Gamoran, director of the UW-Madison-based Wisconsin Center for Education Research and a skeptic on voucher programs, agrees that the tool isn’t perfect and may well change, but “that doesn’t mean we shouldn’t use them now” to rate schools.
It’s also not as if DPI itself didn’t expect to use the report cards. Its budget request — which Walker didn’t include in his budget — included about $10.3 million over the next two years to replicate best practices from schools deemed high-performing by the report cards, as well as to help schools deemed low-performing by the report cards get better.John Nichols appears to support the present DPI approach. Status Quo K-12 vs a Little “Reform” Rhetoric at a Wisconsin Budget Hearing.
Related: The Wisconsin DPI in 2008:
“Schools should not rely on only WKCE data to gauge progress of individual students or to determine effectiveness of programs or curriculum”.
https://www.schoolinfosystem.org/archives/2013/03/wisconsin_educa_14.php
A citizen, parent, voter and taxpayer might ask what the DPI has been
with state and federal taxpayer dollars since 2008?
Meanwhile, Alabama (!), Minnesota, Florida and Massachusetts are
continuing to aim high and compare their students to the world.
http://nces.ed.gov/Timss/benchmark.asp
And, Vietnam is teaching computer science concepts in primary school.
https://www.schoolinfosystem.org/archives/2013/03/primary_school_.php
Does the School Board Matter? Ed Hughes argues that experience does, but what about “Governance” and “Student Achievement”?
Madison School Board Member Ed Hughes
Call me crazy, but I think a record of involvement in our schools is a prerequisite for a School Board member. Sitting at the Board table isn’t the place to be learning the names of our schools or our principals.
Wayne Strong, TJ Mertz and James Howard rise far above their opponents for those of us who value School Board members with a history of engagement in local educational issues and a demonstrated record of commitment to our Madison schools and the students we serve.Notes and links on Ed Hughes and the 2013 Madison School Board election.
I’ve become a broken record vis a vis Madison’s disastrous reading results. The District has been largely operating on auto-pilot for decades. It is as if a 1940’s/1950’s model is sufficient. Spending increases annually (at lower rates in recent years – roughly $15k/student), yet Madison’s disastrous reading results continue, apace.
Four links for your consideration.
When all third graders read at grade level or beyond by the end of the year, the achievement gap will be closed…and not beforeAccording to Mr. Rainwater, the place to look for evidence of a closing achievement gap is the comparison of the percentage of African American third graders who score at the lowest level of performance on statewide tests and the percentage of other racial groups scoring at that level. He says that, after accounting for income differences, there is no gap associated with race at the lowest level of achievement in reading. He made the same claim last year, telling the Wisconsin State Journal on September 24, 2004, “for those kids for whom an ability to read would prevent them from being successful, we’ve reduced that percentage very substantially, and basically, for all practical purposes, closed the gap”. Last Monday, he stated that the gap between percentages scoring at the lowest level “is the original gap” that the board set out to close.
Unfortunately, that is not the achievement gap that the board aimed to close.60% to 42%: Madison School District’s Reading Recovery Effectiveness Lags “National Average”: Administration seeks to continue its use. This program continues, despite the results.
3rd Grade Madison School District Reading Proficiency Data (“Achievement Gap Plan”)The other useful stat buried in the materials is on the second page 3 (= 6th page), showing that the 3rd grade proficiency rate for black students on WKCE, converted to NAEP-scale proficiency, is 6.8%, with the accountability plan targeting this percentage to increase to 23% over one school year. Not sure how this happens when the proficiency rate (by any measure) has been decreasing year over year for quite some time. Because the new DPI school report cards don’t present data on an aggregated basis district-wide nor disaggregated by income and ethnicity by grade level, the stats in the MMSD report are very useful, if one reads the fine print.
Madison Schools Distort Reading Data (2004) by Mark Seidenberg.
How many School Board elections, meetings, votes have taken place since 2005 (a number of candidates were elected unopposed)? How many Superintendents have been hired, retired or moved? Yet, the core structure remains. This, in my view is why we have seen the move to a more diffused governance model in many communities with charters, vouchers and online options.
Change is surely coming. Ideally, Madison should drive this rather than State or Federal requirements. I suspect it will be the latter, in the end, that opens up our monolithic, we know best approach to public education.
And, so it continues
Congrats to new #MMSD Supt. Jennifer Cheatham.If she respects district employees (MTI), we can succeed.We teach the children.
— Madison Teachers Inc (@MtiMadison) February 9, 2013
Madison School Board Member Ed Hughes:Leadership comes in different shapes and sizes. After spending time with 41-year-old Jen Cheatham and attending the community forum on Thursday, I kept thinking back to the winter day 23 years ago when 43-year-old Barry Alvarez was introduced to the Madison community and made his memorable statement about how fans interested in season tickets better get them now because they’d soon be hard to get.
Like Cheatham, Alvarez was an outsider, a rising star in a major program who was ready to take the reins of his own program and run with it. That certainly did not guarantee success, but he proved to have that rare and ineluctable something that inspired his players to raise their game, that drove them to succeed as a team because they couldn’t bear to let their coach or teammates down.
As with Barry, so with Jen. For those of us who have been able to spend time with Jen Cheatham and talk to her about her vision for our Madison schools, it is clear that whatever leadership is, she has it. What we heard time and again from those she’s worked with is that Jen is able to inspire principals and teachers to do their best possible work for the students they serve. But also like Alvarez, she’s doesn’t shy away from tough decisions when they’re necessary.Related: Madison’s third grade reading results:
“The other useful stat buried in the materials is on the second page 3 (= 6th page), showing that the 3rd grade proficiency rate for black students on WKCE, converted to NAEP-scale proficiency, is 6.8%, with the accountability plan targeting this percentage to increase to 23% over one school year. Not sure how this happens when the proficiency rate (by any measure) has been decreasing year over year for quite some time. Because the new DPI school report cards don’t present data on an aggregated basis district-wide nor disaggregated by income and ethnicity by grade level, the stats in the MMSD report are very useful, if one reads the fine print.”
Madison School Board Needs to Address Search Fiasco:
That being the case, Cheatham would come to this position in a difficult circumstance. As Kaleem Caire, the president of the Urban League of Greater Madison, told the State Journal: “The perception of people in this community when we have one pick, they will always question the value of this woman. That’s not fair to her and not fair to our kids.”
The School Board has presided over a fiasco that board member Ed Hughes admits — in a major understatement — “has not gone as smoothly as we’d like.”
Now the board needs to get its act together.
If would be good if the board were to seek the return of the more than $30,000 in taxpayer money that was allocated for what can only charitably be referred to as a “search.” However, we don’t want the board to squander more tax money on extended legal wrangling.
The board should make it clear that it will not have further dealings with this search firm, as the firm’s vetting of applicants does not meet the basic standards that a responsible board should expect.
Perhaps most importantly, the board should engage in a serious rethink of its approach to searches for top administrators. The Madison Metropolitan School District is a great urban school district. It has challenges, especially with regard to achievement gaps and the overuse of standardized testing, that must be addressed.Ripon Superintendent Richard Zimman – August, 2009
“Beware of legacy practices (most of what we do every day is the maintenance of the status quo), @12:40 minutes into the talk – the very public institutions intended for student learning has become focused instead on adult employment. I say that as an employee. Adult practices and attitudes have become embedded in organizational culture governed by strict regulations and union contracts that dictate most of what occurs inside schools today. Any impetus to change direction or structure is met with swift and stiff resistance. It’s as if we are stuck in a time warp keeping a 19th century school model on life support in an attempt to meet 21st century demands.” Zimman went on to discuss the Wisconsin DPI’s vigorous enforcement of teacher licensing practices and provided some unfortunate math & science teacher examples (including the “impossibility” of meeting the demand for such teachers (about 14 minutes)). He further cited exploding teacher salary, benefit and retiree costs eating instructional dollars (“Similar to GM”; “worry” about the children given this situation).
Zimman noted that the most recent State of Wisconsin Budget removed the requirement that arbitrators take into consideration revenue limits (a district’s financial condition @17:30) when considering a District’s ability to afford union negotiated compensation packages. The budget also added the amount of teacher preparation time to the list of items that must be negotiated….. “we need to breakthrough the concept that public schools are an expense, not an investment” and at the same time, we must stop looking at schools as a place for adults to work and start treating schools as a place for children to learn.”
Madison MAP Testing Shows They are Falling Short Too
Melissa Hammann, via a kind reader’s email:
So, the great and powerful Madison School District has started MAP testing and the results are, well, as they should have expected when viewed as a whole. White kids are above national averages and children of color are below them. MAP testing stands for Measures of Academic Progress. They are taken at the computer by each student and the questions are tailored to the individual student. They keep answering questions until they hit the wall of achievement level and the test is ended. Scores are known immediately and areas of strength and areas that need improvement are highlighted FOR EACH KID. It is supposed to be a tool for teachers to use in order to more adequately provide instruction in their classroom. This is called differentiated instruction, or DI in the education vernacular. MAP results are not really effective for national achievement comparison.
OK, I’m going out on a limb here and going to say to the critics of ECSD that we have been doing MAP testing in our district for 5 years now. My newly minted graduate was in the guinea pig group in 7th grade, so I am keyed in on this topic. We can thank Paula Landers for being ahead of the curve on implementing this tool. What seems to escape the writer of the article as well as our district is this. It’s very nice to know how one’s district stacks up as a whole against the state (WKCE) and nation (MAP, NAEP), but what exactly does this data provide in the way of improving individual student achievement? Exactly squat. In this world of inclusive learning, school districts must have tools to provide DI for all levels of learners. If you insist on teaching to some arbitrary mean that various test data indicates as the level of your class, you’ll lose the top 30 and bottom 30 percent of the curve. That’s 60 percent of the students being lost. Used properly, MAP results could be a very effective tool for the teaching arsenal to solve this problem.
Sadly, it is my experience that my kids’ teachers use it to verify what they already know about my kids, that they are above average, and use their MAP data to rationalize being satisfied with mediocre performance the rest of the year “because they are still above their peer average.” I have no data to indicate it is otherwise with other children. In fact, I have spoken to other parents with similar issues. In addition, over 35 percent of the students in the quadrant report that began the school year above their peer group in reading in our district in 10-11 did not reach the achievement goal the MAP test sets for them. It seems that the district thinks it’s OK that a child does not achieve to their potential. I am not of the same opinion.
……
Not only did my kid fail to reach his personal achievement goal set for him by the MAP test (gain less than they projected he should), but he ended 5th grade at a lower achievement level in reading than where he started. This loss of achievement happened while he got straight As all year long in language arts. I began a slow burn that has not stopped. I went to the principal, I went to the teacher and I went to the administrator in charge. “He started out so high that it was hard for him to achieve.” This is an unacceptable response. My child deserves to show some damn achievement after a year of instruction. I don’t care if he started out higher than the mediocre goals you set for the masses. This is thievery, plain and simple. That year, as I recall, the entire grade level failed to meet the 50% level, which basically says they have achieved grade level performance. Interpretation of MAP results is a bit confusing, so go with me here. Anything less than 50% for a grade level indicates they have not achieved a years worth of learning. There has been a shake up in the 5th grade teaching team, but I think it goes beyond individual teachers. If there is an endemic attitude that high achieving students are OK to ignore and an insistence on mistakenly using MAP data to compare to national averages (like the article in the Madison paper did) instead of using it for the amazing tool it could be, there will be no dang improvement in overall achievement.Related: Madison Schools’ Measures of Academic Progress (MAP) Assessment Results Released. Unfortunately, the Madison School District has not published the school by school MAP results, though the information made its way to Matthew DeFour’s Sunday article.
Wisconsin’s Achievement Stagnation: 1992 – 2011
Eric A. Hanushek, Paul E. Peterson and Ludger Woessmann, via a kind Chan Stroman-Roll email:“Yet when compared to gains made by students in other countries, progress within the United States is middling, not stellar (see Figure 1). While 24 countries trail the U.S. rate of improvement, another 24 countries appear to be improving at a faster rate. Nor is U.S. progress sufficiently rapid to allow it to catch up with the leaders of the industrialized world.”
“Meanwhile, students in Wisconsin, Michigan, Minnesota, and Indiana were among those making the fewest average gains between 1992 and 2011. Once again, the larger political climate may have affected the progress on the ground. Unlike in the South, the reform movement has made little headway within midwestern states, at least until very recently. Many of the midwestern states had proud education histories symbolized by internationally acclaimed land-grant universities, which have become the pride of East Lansing, Michigan; Madison, Wisconsin; St. Paul, Minnesota; and Lafayette, Indiana. Satisfaction with past accomplishments may have dampened interest in the school reform agenda sweeping through southern, border, and some western states.”
Underlying study: “Achievement Growth: International and U.S. State Trends in Student Performance“Related:
- Student scores slip with new proficiency benchmarks by Erin Richards
The results: Only 35.8% of Wisconsin’s WKCE test-takers in third through eighth and 10th grade in fall 2011 scored proficient or better in reading, and just 48.1% scored proficient or better in math.
Compare that with March, when the state released 2011 WKCE results that showed 78% and 82% of students scored proficient or better in math and reading.
Under the new benchmarks, just 41.9% of white students scored proficient or advanced in reading, and 55.2% met that mark in math on the latest state test. Previously, more than 87% of white students were considered proficient or better in reading, and 84.3% were considered to have scored proficient or better in math in 2011.
As for the state’s black students – many of whom attend Milwaukee Public Schools – 13.4% are considered proficient or advanced in reading, down from 58.7% using the old grading scale.
Rep. Steve Kestell, a Republican from Elkhart Lake who chairs the Assembly’s Education Committee, called the revised picture of student performance a “necessary and long-delayed wake-up call for Wisconsin.”
“We’ve been trying to tell folks for some time that we’ve been looking at things through rose-colored glasses in Wisconsin,” he added. “It was a hard thing to communicate, and it was largely ignored. This is a new awakening.”
State Sen. Luther Olsen (R-Ripon), who chairs the Senate Education Committee, said: “We’ve known for years that our proficiency-cut scores are way below where they should be, and really, this shows that we have got to do a better job.”
Under the past decade of No Child Left Behind, Wisconsin had been criticized for having a more lenient bar for proficiency than other states.- Less than half of state’s students measure proficient under new national standards by Matthew DeFour:
Still, the new results should be a “smack in the face” for Wisconsin, said Adam Gamoran, director of the Wisconsin Center for Education Research at UW-Madison.
“It’s going to be a wake-up call,” Gamoran said. “It’s a more honest reckoning of where Wisconsin students stand relative to other students across the nation and relative to the goals we want for all of our students.”
The old results were based on whether students were meeting Wisconsin’s definition of being at grade-level, whereas the new results reflect more rigorous standards of what it means to be prepared for college or a career used for the National Assessment of Educational Progress, also known as the nation’s report card.
About 3,000 4th and 8th graders in Wisconsin take the NAEP every other year. In 2011, 32 percent of Wisconsin 4th graders scored proficient on NAEP’s reading test and 39 percent scored proficient on the math test.
The data released Tuesday marks the first time DPI has converted results of the state test, which more than 430,000 students in grades 3-8 and 10 take in the fall, to the NAEP benchmarks.
DPI won’t release recalculated results for individual schools and districts until the fall, when it also plans to release individual school report cards with ratings on a scale of 0 to 100.
Kim Henderson, president of the Wisconsin Parent Teacher Association, said parents pay closer attention to state test scores than NAEP scores, so the results could “bring up a lot of good questioning.”- State sets new, tougher standards for student tests by the Associated Press:
To get the waiver, Wisconsin had to develop its own accountability system in addition to teacher and principal evaluations, among other things.
The scores will be included on new school report cards to be released in the fall. How well individual students in grades 3-8 and 10 do on reading and math tests they take in November will be released next spring.
The new school report cards were developed in conjunction with Gov. Scott Walker, legislative leaders and others over the past year. They will include a numerical rating for individual schools from 0-100 based on student achievement, growth, graduation rates and closing of achievement gaps between different groups of students. The scores will generate an overall total that will place each school into one of five categories ranging from “Fails to Meet Expectations” to “Significantly Exceeds Expectations.”
“This new system will empower parents, allowing them to make education related decisions based on reliable and uniform data,” Walker said in a statement.
Sample report cards, without actual school data, are posted online to solicit feedback through Aug. 12.- Numerous notes and links on the oft-criticized WKCE, here.
- wisconsin2.org


July 29 Wisconsin Read to Lead task force meeting
The fourth meeting of the Governor’s Read to Lead task force took place in Milwaukee on Friday, July 29. The meeting was filmed by Wisconsin Eye, but we have not seen it offered yet through their website. We will send out a notice when that occurs. As always, we encourage you to watch and draw your own conclusions.
Following is a synopsis of the meeting, which centered on reading improvement success in Florida and previously-discussed task force topics (teacher preparation, licensing, professional development, screening/intervention, early childhood). In addition, Superintendent Evers gave an update on activity within DPI. The discussion of the impact of societal factors on reading achievement was held over to the next meeting, as was further revisiting of early childhood issues.
In addition to this summary, you can access Chan Stroman’s Eduphilia tweets at http://twitter.com/#!/eduphilia
Opening: Governor Walker welcomed everyone and stressed the importance of this conversation on reading. Using WKCE data, which has been criticized nationally and locally for years as being derived from low standards, the Governor stated that 80% of Wisconsin students are proficient or advanced in reading, and he is seeking to serve the other 20%. The NAEP data, which figured prominently in the presentation of the guest speakers, tell a very different story. Superintendent Evers thanked the task force members and indicated that this is all about “connecting the dots” and putting all of the “puzzle pieces” together. The work of this task force will impact the work going on in other education-focused committees.
The Florida Story: Guest speakers were Patricia Levesque, the Executive Director of the Foundation for Excellence in Education and the Foundation for Florida’s Future, and Mary Laura Bragg, the director of Florida’s statewide reading initiative, Just Read, Florida! from 2001 to 2006.
In a series of slides, Levesque compared Wisconsin, Florida, and national performance on the NAEP reading test over the past decade. Despite challenges in terms of English language learners, a huge percentage of students on free/reduced lunch, and a minority-majority demographic, Florida has moved from the scraping the bottom on the NAEP to the top group of states. Over the same time period, Wisconsin has plummeted in national ranking, and our students now score below the national average in all subgroups for which NAEP data is disaggregated. 10 points on the NAEP scale is roughly equivalent to one grade level in performance, and Florida has moved from two grade levels below Wisconsin to 1/2 grade level above. For a full discussion of Wisconsin’s NAEP performance, see our website, http://www.wisconsinreadingcoalition.org.
Levesque and Bragg also described the components of the reading initiative in Florida, which included grading all schools from A to F, an objective test-based promotion policy from third to fourth grade, required state-approved reading plans in each district, trained reading coaches in schools, research assistance from the Florida Center for Reading Research, required individual student intervention plans for struggling students, universal K-2 screening for reading problems, improved licensure testing for teachers and principals, the creation of a reading endorsement for teaching licenses, and on-line professional development available to all teachers. As noted above, achievement has gone up dramatically, the gap between demographic groups has narrowed, early intervention is much more common, and third grade retention percentages continue to fall. The middle school performance is now rising as those children who received early intervention in elementary school reach that level. Those students have not yet reached high school, and there is still work to be done there. To accomplish all this, Florida leveraged federal funds for Title 1 and 2 and IDEA, requiring that they be spent for state-approved reading purposes. The Governor also worked actively with business to create private/public partnerships supporting reading. Just Read, Florida! was able to engineer a statewide conference for principals that was funded from vendor fees. While Florida is a strong local control state, reading is controlled from the state level, eliminating the need for local curriculum directors to research and design reading plans without the resources or manpower to do so. Florida also cut off funding to university professors who refused to go along with science-based reading instruction and assessment.
Florida is now sharing its story with other states, and offering assistance in reading plan development, as well as their screening program (FAIR assessment system) and their online professional development, which cost millions to develop. Levesque invited Wisconsin to join Indiana and other states at a conference in Florida this fall.
Questions for, or challenges to, the presenters came from three task force members.
- Rachel Lander asked about the reading coaches, and Bragg responded that they were extensively trained by the state office, beginning with Reading First money. They are in the classroom modeling for teachers and also work with principals on understanding data and becoming building reading leaders. The coaches now have an association that has acquired a presence in the state.
- Linda Pils stated her belief that Wisconsin outperforms Florida at the middle school level, and that we have higher graduation rates than Florida. She cited opinions that third grade retention has some immediate effect, but the results are the same or better for non-retained students later, and that most retained students will not graduate from high school. She also pointed out Florida’s class size reduction requirement, and suggested that the NAEP gains came from that. Levesque explained that the retention studies to which Pils was referring were from other states, where retention decisions were made subjectively by teachers, and there was no requirement for science-based individual intervention plans. The gains for retained students in Florida are greater than for matched students who are not retained, and the gains persist over time. Further, retention did not adversely affect graduation rates. In fact, graduation rates have increased, and dropout rates have declined. The University of Arkansas is planning to do a study of Florida retention. The class size reduction policy did not take effect in Florida until last year, and a Harvard study concluded that it had no effect on student reading achievement. Task force member Steve Dykstra pointed out that you cannot compare the NAEP scores from two states without considering the difference in student demographics. Wisconsin’s middle school scores benefit from the fact that we have a relative abundance of white students who are not on free/reduced lunch. Our overall average student score in middle school may be higher than Florida, but when we compare similar cohorts from both states, Florida is far ahead.
- Tony Pedriana asked what kinds of incentives have been put in place for higher education, principals, etc. to move to a science-based system of instruction. The guests noted that when schools are graded, reading performance receives double weight in the formula. They also withheld funding for university programs that were not science-based.
DPI Update: Superintendent Evers indicated that DPI is looking at action in fours areas: teacher licensure, the Wisconsin Model Early Learning Standards, the use of a screener to detect reading problems, and implementation of the Common Core State Standards.
- The committee looking at licensing is trying to decide whether they should recommend an existing, off-the-shelf competency exam, or revise the exam they are currently requiring (Praxis 2). He did not indicate who is on the committee or what existing tests they were looking at. In the past, several members of the task force have recommended that Wisconsin use the Foundations of Reading test given in Massachusetts and Connecticut.
- DPI is revising the WMELS to correct definitions and descriptions of phonological and phonemic awareness and phonics. The changes will align the WMELS with both the Report of the National Reading Panel and the Common Core State Standards. Per the suggestion of Eboni Howard, a guest speaker at the last meeting, they will get an outside opinion on the WMELS when they are finished. Evers did not indicate who is doing this work.
- DPI is looking at the possibility of using PALS screening or some other tool recommended by the National RTI Center to screen students in grades K-2 or K-3. Evers previously mentioned that this committee had been meeting for 6-7 months, but he did not indicate who is on it.
- Evers made reference to communication that was circulated this week (by Dr. Dan Gustafson and John Humphries) that expressed concern over the method in which DPI is implementing the Common Core. He stated that districts have been asking DPI for help in implementing the CC, and they want to provide districts with a number of resources. One of those is the model curriculum being developed by CESA 7. DPI is looking at it to see how it could help the state move forward, but no final decision has yet been made.
Task force member Pam Heyde, substituting for Marcia Henry, suggested that it would be better to look at what Florida is doing rather than start from ground zero looking at guidelines. Patricia Levesque confirmed that Florida was willing to assist other states, and invited Wisconsin to join a meeting of state reading commissioners in October.
Teacher Preparation: The discussion centered around what needs to change in teacher preparation programs, and how to fit this into a four-year degree.
Steve Dykstra said that Texas has looked at this issue extensively. Most schools need three courses to cover reading adequately, but it is also important to look at the texts that are used in the courses. He referenced a study by Joshi that showed most of the college texts to be inadequate.
Dawnene Hassett, UW-Madison literacy professor in charge of elementary teacher reading preparation, was invited to participate in this part of the discussion. She indicated we should talk in terms of content knowledge, not number of credits. In a couple of years, teachers will have to pass a Teacher Performance Assessment in order to graduate. This was described as a metacognitive exercise using student data. In 2012-13, UW-Madison will change its coursework, combining courses in some of the arts, and dropping some of the pedagogical, psychological offerings.
Tony Pedriana said he felt schools of education had fallen down on teaching content derived from empirical studies.
Hassett said schools teach all five “pillars” of reading, but they may not be doing it well enough. She said you cannot replicate classroom research, so you need research “plus.”
Pils was impressed with the assistance the FCRR gives to classroom teachers regarding interventions that work. She also said spending levels were important.
Dykstra asked Mary Laura Bragg if she had worked with professors who thought they were in alignment with the research, but really weren’t.
Bragg responded that “there’s research, and then there’s research.” They had to educate people on the difference between “research” from vendors and empirical research, which involves issues of fidelity and validation with different groups of students.
Levesque stated that Florida increased reading requirements for elementary candidates from 3 to 6 credits, and added a 3 credit requirement for secondary candidates. Colleges were required to fit this in by eliminating non-content area pedagogy courses.
Kathy Champeau repeated a concern from earlier meetings that teacher candidates need the opportunity to practice their new knowledge in a classroom setting, or they will forget it.
Hassett hoped the Teacher Performance Assessment would help this. The TPA would probably require certain things to be included in the teacher candidate’s portfolio.
Governor Walker said that the key to the effectiveness of Florida’s retention policy was the intervention provided to the students. He asked what they did to make sure intervention was successful.
Levesque replied that one key was reading coaches in the classroom. Also, district reading plans, individual intervention plans, student academies, etc. all need to be approved by the state.
There was consensus that there should be a difference in reading requirements for elementary vs. secondary teachers. There was no discussion of preparation for reading teachers, reading specialists, or special education teachers.
Licensing: The discussion centered around what teacher standards need to be tested.
Dykstra suggested that the Knowledge and Practice Standards for Teachers of Reading, written by Louisa Moats, et al, and published by the International Dyslexia Association in 2010, would be good teacher standards, and the basis for a teacher competency exam. There was no need for DPI to spend the next year discussing and inventing new teacher standards.
Champeau said that the International Reading Association also has standards.
Pedriana asked if those standards are based on research.
Dykstra suggested that the task force look at the two sets of standards side-by-side and compare them.
Professional Development: The facilitators looked for input on how professional development for practicing teachers should be targeted. Should the state target struggling teachers, schools, or districts for professional development?
Rep. Jason Fields felt all three needed to be targeted.
Heyde asked Levesque for more details on how Wisconsin could do professional development, when we often hear there is no money.
Levesque provided more detail on the state making reading a priority, building public/private partnerships, and being more creative with federal grant money (e.g., the 20% of each grant that is normally carved out by the state for administration). There should be a clear reading plan (Florida started with just two people running their initiative, and after a decade only has eight people), and all the spending should align with the plan to be effective. You cannot keep sending money down the hole. Additional manpower was provided by the provision that all state employees would get one paid hour per week to volunteer on approved reading projects in schools, and also by community service requirements for high school students.
Bragg suggested using the online Florida training modules, and perhaps combining them with modules from Louisiana.
Dykstra also suggested taking advantage of existing training, including LETRS, which was made widely available in Massachusetts. He also stressed the importance of professional development for principals, coaches, and specialists.
Bragg pointed out that many online training modules are free, or provided for a nominal charge that does not come close to what it would cost Wisconsin to develop its own professional development.
Lander said there were many Wisconsin teachers who don’t need the training, and it should not be punitive.
Champeau suggested that Florida spends way more money on education that Wisconsin, based on information provided by the NAEP.
Levesque clarified that Florida actually is below the national average in cost per student. The only reason they spend more than Wisconsin is that they have more students.
Rep. Steve Kestell stated that teachers around the entire state have a need for professional development, and it is dangerous to give it only to the districts that are performing the worst.
Sarah Archibald (sitting in for Sen. Luther Olsen) said it would be good to look at the value added in districts across the state when trying to identify the greatest needs for professional development. The new statewide information system should provide us with some of this value added information, but not at a classroom teacher level.
Evers commented that the state could require new teacher Professional Development Plans to include or be focused on reading.
Pils commented that districts can have low and high performing schools, so it is not enough to look at district data.
Champeau said that administrators also need this professional development. They cannot evaluate teachers if they do not have the knowledge themselves.
Dykstra mentioned a Florida guidebook for principals with a checklist to help them. He is concerned about teachers who develop PDP’s with no guidance, and spend a lot of time and money on poor training and learning. There is a need for a clearinghouse for professional development programs.
Screening/Intervention: One of the main questions here was whether the screening should be universal using the same tools across the state.
Champeau repeated a belief that there are districts who are doing well with the screening they are doing, and they should not be required to change or add something new.
Dykstra responded that we need comparable data from every school to use value added analysis, so a universal tool makes sense. He also said there was going to be a lot of opposition to this, given the statements against screening that were issued when Rep. Keith Ripp introduced legislation on this topic in the last biennium. He felt the task force has not seen any screener in enough detail to recommend a particular one at this time.
Heyde said we need a screener that screens for the right things.
Pils agreed with Dykstra and Heyde. She mentioned that DIBELS is free and doesn’t take much time.
Michele Erickson asked if a task force recommendation would turn into a mandate. She asked if Florida used a universal screener.
Levesque replied that Florida initially used DIBELS statewide, and then the FCRR developed the FAIR assessments for them. The legislature in Florida mandated the policy of universal kindergarten screening that also traces students back to their pre-K programs to see which ones are doing a better job. Wisconsin could purchase the FAIR assessments from Florida.
Archilbald suggested phasing in screening if we could not afford to do it all at once.
Evers supports local control, but said there are reasons to have a universal screener for data systems, to inform college programs, and to implement professional development.
Lander asked what screening information we could get from the WKCE.
Evers responded that the WKCE doesn’t start unitl third grade.
Dykstra said we need a rubric about screening, and who needs what type and how often.
Pedriana said student mobility is another reason for a universal screener.
There was consensus that early screening is important. Certainly by 4K or 5K, but even at age three if a system could be established. Possibilities mentioned were district-run screenings or pediatrician screenings.
Walker reminded the task force that it only makes sense to screen if you have the ability to intervene with something.
Mara Brown wasn’t sure that a universal screener would tell her anything more about her students than she already knows.
Levesque said she could provide a screening roadmap rubric for the task force.
No one on the task force had suggestions for specific interventions. The feeling was that it is more important to have a well-trained teacher. Both Florida and Oregon started evaluating and rating interventions, but stopped because they got bogged down. Wisconsin must also be careful about evaluations by What Works Clearinghouse, which has some problems.
Pedriana asked if the task force is prepared to endorse a model of instruction based on science, where failure is not an option.
The facilitator said this discussion would have to wait for later.
Early Childhood: The task force agreed that YoungStar should include more specific literacy targets.
Rep. Kestell felt that some district are opening 4K programs primarily for added revenue, and that there is wide variability in quality. There is a need to spend more time on this and decide what 4K should look like.
Evers said we should use the Common Core and work backward to determine what needs to be done in 4K.
Wrap-Up: Further discussion of early childhood will be put over to the next meeting, as will the societal issues and accountability. A meeting site has not yet been set, but Governor Walker indicted he liked moving around the state. The Governor’s aides will follow up as to locations and specific agenda. The next meeting will be Thursday, August 25. All meetings are open to the public.Related: An Open Letter to the Wisconsin Read To Lead Task Force on Implementing Common Core Academic Standards; DPI: “Leading Us Backwards” and how does Wisconsin Compare? www.wisconsin2.org.
Much more on Wisconsin’s Read to Lead Task Force, here.
An Open Letter to the Wisconsin Read To Lead Task Force on Implementing Common Core Academic Standards; DPI: “Leading Us Backwards”
Dan Gustafson, PhD 133K PDF, via a kind email from the Wisconsin Reading Coalition:
WRC recommends reading the following open letter from Madison neuropsychologist Dan Gustafson to the Governor’s Read to Lead task force. It reflects many of our concerns about the state of reading instruction in Wisconsin and the lack of an effective response from the Department of Public Instruction.
An Open Letter to the Read-To-Lead Task Force
From Dan Gustafson, PhD
State Superintendent Evers, you appointed me to the Common Core Leadership Group. You charged that the Leadership Group would guide Wisconsin’s implementation of new reading instruction standards developed by the National Governors’ Association Center for Best Practices (NGA Center) and the Council of Chief State School Officers (CCSSO).
It is my understanding that I was asked to join the group with the express purpose of bringing different voices to the table. If anything, my experience with the group illustrates how very far we need to go in achieving a transparent and reasoned discussion about the reading crisis in Wisconsin.
DPI Secretly Endorses Plan Created by Poor Performing CESA-7
I have grave concerns about DPI’s recent announcement that Wisconsin will follow CESA-7’s approach to implementing the Common Core reading standards. DPI is proposing this will be the state’s new model reading curriculum.
I can attest that there was absolutely no consensus reached in the Common Core group in support of CESA-7’s approach. In point of fact, at the 27th of June Common Core meeting, CESA-7 representative Claire Wick refused to respond to even general questions about her program.
I pointed out that our group, the Common Core Leadership Group, had a right to know about how CESA-7 intended to implement the Common Core Standards. She denied this was the case, citing a “non-disclosure agreement.”
The moderator of the discussion, DPI’s Emilie Amundson, concurred that Claire didn’t need to discuss the program further on the grounds that it was only a CESA-7 program. Our Common Core meeting occurred on the 27th of June. Only two weeks later, on July 14th, DPI released the following statement:
State Superintendent Evers formally adopted the Common Core State Standards in June 2010, making Wisconsin the first state in the country to adopt these rigorous, internationally benchmarked set of expectations for what students should know and are expected to do in English Language Arts and Mathematics. These standards guide both curriculum and assessment development at the state level. Significant work is now underway to determine how training will be advanced for these new standards, and DPI is currently working with CESA 7 to develop a model curriculum aligned to the new standards.
In glaring contrast to the deliberative process that went into creating the Common Core goals, Wisconsin is rushing to implement the goals without being willing to even show their program to their own panel of experts.
What Do We Know About Wisconsin/CESA-7’s Model Curriculum?
As an outsider to DPI, I was only able to locate one piece of data regarding CESA-7’s elementary school reading performance:
4TH GRADE READING SCORES, 2007-08 WKCE-CRT,
CESA-7 IS AMONG THE WORST PERFORMING DISTRICTS.
CESA-7 RANKED 10TH OF THE 12 WISCONSIN CESA’S.
What Claire did say about her philosophy and the CESA-7 program, before she decided to refuse further comment, was that she did not think significant changes were needed in reading instruction in Wisconsin, as “only three-percent” of children were struggling to read in the state. This is a strikingly low number, one that reflects an arbitrary cutoff for special education. Her view does not reflect the painful experience of the 67% of Wisconsin 4th graders who scored below proficient on the 2009 National Assessment of Educational Progress.
As people in attendance at the meeting can attest, Claire also said that her approach was “not curriculum neutral” and she was taking a “strong stand” on how to teach reading. Again, when I pressed her on what these statements meant, she would only reference oblique whole language jargon, such as a belief in the principal of release from instruction. When I later asked her about finding a balance that included more phonics instruction, she said “too much emphasis” had been given to balanced literacy. After making her brief statements to the Common Core group, she said she had already disclosed too much, and refused to provide more details about the CESA-7 program.
Disregarding Research and Enormous Gains Made by other States, Wisconsin Continues to Stridently Support Whole Language
During the remainder of the day-long meeting on the 27th, I pressed the group to decide about a mechanism to achieve an expert consensus grounded in research. I suggested ways we could move beyond the clear differences that existed among us regarding how to assess and teach reading.
The end product of the meeting, however, was just a list of aspirational goals. We were told this would likely be the last meeting of the group. There was no substantive discussion about implementation of the goals–even though this had been Superintendent Evers’ primary mandate for the group.
I can better understand now why Emilie kept steering the discussion back to aspirational goals. The backroom deal had already been made with Claire and other leaders of the Wisconsin State Reading Association (WSRA). It would have been inconvenient to tell me the truth.
WSRA continues to unapologetically champion a remarkably strident version of whole-language reading instruction. Please take a look at the advocacy section of their website. Their model of reading instruction has been abandoned through most the United States due to lack of research support. It is still alive and well in CESA-7, however.
Our State Motto is “Forward”
After years of failing to identify and recommend model curriculum by passing it off as an issue of local control, the DPI now purports to lead. Unfortunately, Superintendent Evers, you are now leading us backward.
Making CESA-7 your model curriculum is going to cause real harm. DPI is not only rashly and secretly endorsing what appears to be a radical version of whole language, but now school districts who have adopted research validated procedures, such as the Monroe School District, will feel themselves under pressure to fall in line with your recommended curriculum.
By all appearances, CESA-7’s program is absolutely out of keeping with new Federal laws addressing Response to Intervention and Wisconsin’s own Specific Learning Disability Rule. CESA-7’s program will not earn us Race to the Top funding. Most significantly, CESA-7’s approach is going to harm children.
In medicine we would call this malpractice. There is clear and compelling data supporting one set of interventions (Monroe), and another set of intervention that are counter-indicated (CESA-7). This is not a matter of opinion, or people taking sides. This is an empirical question. If you don’t have them already, I hope you will find trusted advisors who will rise above the WSRA obfuscation and just look at the data. It is my impression that you are moving fast and receiving poor advice.
I am mystified as to why, after years of making little headway on topics related to reading, DPI is now making major decisions at a breakneck pace. Is this an effort to circumvent the Read-To-Lead Task Force by instituting new policies before the group has finished its scheduled meetings? Superintendent Evers, why haven’t you shared anything about the CESA-7 curriculum with them? Have you already made your decision, or are you prepared to show the Read-To-Lead that there is a deliberative process underway to find a true model curriculum?
There are senior leaders at DPI who recognize that the reading-related input DPI has received has been substantially unbalanced. For example, there were about five senior WSRA members present at the Common Core meetings, meaning that I was substantially outnumbered. While ultimately unsuccessful due to logistics, an 11th hour effort was made to add researchers and leadership members from the Wisconsin Reading Coalition to the Common Core group.
The Leadership Group could achieve what you asked of it, which is to thoughtfully guide implementation of the Common Core. I am still willing to work with you on this goal.
State Superintendent Evers, I assume that you asked me to be a member of the Leadership Group in good faith, and will be disappointed to learn of what actually transpired with the group. You may have the false impression that CESA-7’s approach was vetted at your Common Core Leadership Group. Lastly, and most importantly, I trust you have every desire to see beyond destructive politics and find a way to protect the welfare of the children of Wisconsin.
Sincerely,
Dan Gustafson, PhD, EdM
Neuropsychologist, Dean ClinicView a 133K PDF or Google Docs version.
Related:
How does Wisconsin Compare: 2 Big Goals.
Wisconsin Academic Standards
Wisconsin Teacher Content Knowledge Requirement Comparison
UW Ed School Dean and WPRI President on the Recent School Choice Results
The release of the results of the Wisconsin Knowledge and Concepts Exam, the standardized test that every state public school is required to give, is a rite of spring for Wisconsin schools.
Distributed every year, the WKCEs provide educators, parents and community members with information about how well schools and districts are performing, broken down by subject and grade level.
The WKCEs are used alongside other measures to determine where schools are falling short and what is working well. For parents with many different types of educational options from which to choose, the WKCEs allow them to make informed choices about their child’s school. For taxpayers, the tests provide a level of transparency and demonstrate a return on investment.
But while state law requires all public schools to give the WKCEs, not all publicly funded schools are required do to so. Since its inception 20 years ago, the Milwaukee Parental Choice Program has been virtually without any kind of meaningful accountability measures in place. Choice schools have not been required to have students take the WKCEs. That is, until this school year.We have all done it at one time or another — opened our mouth before engaging our brain.
State Rep. Sondy Pope-Roberts, D-Middleton, just had one of those moments. In reacting to the news that, on average, students attending schools in the Milwaukee Parental Choice program performed about the same or slightly below students in Milwaukee Public Schools, she said taxpayers are being “bamboozled” and the program is “a disservice to Milwaukee students.”
Whoa! Had she taken a moment to think before she spoke, here are a few things that should have occurred to her:
• Those private schools are performing about as well at educating Milwaukee children as the public schools — at half the cost. Public funding for each child in the choice program costs taxpayers $6,442 while each child in Milwaukee Public Schools receives taxpayer support of over $15,000. If all of the 21,000 choice students moved back into Milwaukee Public Schools, that would require a $74 million increase in local property taxes across the state, according to the Legislative Fiscal Bureau.
Serious ideas from State of Education speech. Seriously.
For instance, he’s the only state elected official to actually and seriously float a proposal to repair the broken state funding system for schools. He promises the proposal for his “Funding for Our Future” will be ready to introduce to lawmakers this fall and will include details on its impact on the state’s 424 school districts.
Evers also is interested in the potential of charter schools. Let’s be open and supportive about education alternatives, he says, but mindful of what’s already working well in public schools.
And he says qualified 11th and 12th graders should be allowed to move directly on to post-secondary education or training if they wish. Dual enrollment opportunites for high school age students attending college and technical schools will require a shift in thinking that shares turf and breaks down barriers, making seamless education — pre-K through post-secondary — a reality instead of some distant dream, according to Evers.
As to Evers’ comments on teacher testing, he joins a national conversation that has been sparked, in part, by the Obama administration as well as research that shows the single universal element in improved student performance is teacher quality. We recently featured a story about concerns over teacher evaluation based on student performance and test scores, and the issue has been a potent topic elsewhere, as well.The proof, as always, is in the pudding, or substance.
Melissa Westbrook wrote a very useful and timely article on education reform:I think many ed reformers rightly say, “Kids can’t wait.” I agree.
There is nothing more depressing than realizing that any change that might be good will likely come AFTER your child ages out of elementary, middle or high school. Not to say that we don’t do things for the greater good or the future greater good but as a parent, you want for your child now. Of course, we are told that change needs to happen now but the reality is what it might or might not produce in results is years off. (Which matters not to Bill Gates or President Obama because their children are in private schools.)
All this leads to wonder about our teachers and what this change will mean. A reader, Lendlees, passed on a link to a story that appeared in the LA Times about their teacher ratings. (You may recall that the LA Times got the classroom test scores for every single teacher in Los Angeles and published them in ranked order.)Susan Troller notes that Wisconsin’s oft criticized WKCE (on which Madison’s value added assessment program is based) will be replaced – by 2014:
Evers also promised that the much maligned Wisconsin Knowledge and Concepts Exam, used to test student proficiency in 3rd through 6th, 8th and 10th grades, is on its way out. By 2014, there will be a much better assessment of student proficiency to take its place, Evers says, and he should know. He’s become a leading figure in the push for national core education standards, and for effective means for measuring student progress.
A Look at Madison’s Use of Value Added Assessment
In the two years Madison has collected and shared value-added numbers, it has seen some patterns emerging in elementary school math learning. But when compared with other districts, such as Milwaukee, Kiefer says there’s much less variation in the value- added scores of schools within the Madison district.
“You don’t see the variation because we do a fairly good job at making sure all staff has the same professional development,” he says.
Proponents of the value-added approach agree the data would be more useful if the Wisconsin Department of Public Instruction were to establish a statewide value-added system. DPI is instead developing an assessment system to look at school-wide trends and improve instruction for individual students.
…..
But some question whether value-added data truly benefits all students, or is geared toward closing the gap between high- and low-performing students.
“Will the MMSD use new assessments…of students’ progress to match instruction levels with demonstrated learning levels?” asks Lorie Raihala, a Madison parent who is part of a group seeking better programming for high-achieving ninth- and 10th-graders at West High School. “So far the district has not done this.”
Others are leery of adding another measurement tool. David Wasserman, a teacher at Sennett Middle School and part of a planning group pushing to open Badger Rock Middle School, a green charter (see sidebar), made national news a few years ago when he refused to administer a mandatory statewide test. He still feels that a broad, student-centered evaluation model that takes multiple assessments into account gives the best picture.
“Assessment,” he says, “shouldn’t drive learning.”Notes and links on “Value Added Assessment“, and the oft-criticized WKCE, on which it is based, here.
Ouch! Madison schools are ‘weak’? and College Station’s School District
Wisconsin State Journal Editorial
Another national magazine says Madison is one of the nation’s best cities in which to raise a family.
That’s something to celebrate.
But Kiplinger’s, a monthly business and personal finance periodical, also raps ours city schools as “weak” in its latest edition.
That’s troubling.
“Madison city schools are weak relative to the suburban schools,” the magazine wrote in its analysis of the pros and cons of living here with children.
Really?
The magazine apparently used average test scores to reach its conclusion. By that single measure, yes, Dane County’s suburban schools tend to do better.
But the city schools have more challenges – higher concentrations of students in poverty, more students who speak little or no English when they enroll, more students with special needs.
None of those factors should be excuses. Yet they are reality.
And Madison, in some ways, is ahead of the ‘burbs. It consistently graduates some of the highest-achieving students in the state. It offers far more kinds of classes and clubs. Its diverse student population can help prepare children for an increasingly diverse world.
Madison School Board member Ed Hughes compares WKCE scores, comments on the Kiplinger and Wisconsin State Journal article and wonders if anyone would move from Madison to College Station, TX [map], which Kiplinger’s ranked above our local $15,241 2009/2010 per student public schools.
I compared Madison, WI to College Station, TX using a handy Census Bureau report.93.8% of College Station residents over 25 are high school graduates, a bit higher than Madison’s 92.4%.
58.1% of College Station residents over 25 have a bachelor’s degree or higher, compared to Madison’s 48.2%Madison does have a higher median household and per capita income along with a population about three times that of College Station.
Turning to the public school districts, readers might be interested in having a look at both websites: the College Station Independent School District and the Madison Metropolitan School District. 75% of College Station students took the ACT (average score: 22.6) while 67% of Madison students took the exam and achieved a composite score of 24.2.
College Station publishes a useful set of individual school report cards, which include state and national test results along with attendance and dropout data.
College Station’s 2009-2010 budget was $93,718.470, supporting 9,712 students = $9,649.76 per student. . They also publish an annual check register, allowing interested citizens to review expenditures.
Madison’s 2009-2010 budget was $370,287,471 for 24,295 students = $15,241 per student, 57.9% higher than College Station.
College Station’s A and M Consolidated High School offers 22 AP classes while Madison East offers 12, Memorial 25 (8 of which are provided by Florida Virtual…), LaFollette 13 and West 8.
College Station’s “student profile” notes that the District is 59.3% white, 31.4% are economically disadvantaged while 10.3% are in talented and gifted.
Texas’s 2010 National Merit Semifinalist cut score was 216 while Wisconsin’s was 207. College Station’s high school had 16 National Merit Semi-Finalists (the number might be 40 were College Station the same size as Madison and perhaps still higher with Wisconsin’s lower cut score) during the most recent year while Madison’s high schools had 57.
Wisconsin’s Education Superintendent on the National “Common Core” Academic Standards
But signing Wisconsin on to the nationwide standards campaign may trump all of those. Wisconsin’s current standards for what children should learn have been criticized in several national analyses as weak, compared with what other states have. The common core is regarded as more specific and more focused on what students really should master.
Chester E. Finn Jr., president of the generally conservative Thomas B. Fordham Institute in Washington, is a big backer of the new standards. “There is no doubt whatsoever in Wisconsin’s case that the state would be better off with the common core standards than what it has today,” he said in a phone interview.
But standards are one thing. Making them mean something is another. Evers said that will be a major focus for him ahead.
“How are we going to make this happen in the classrooms of Wisconsin?” he asked.
The answer hinges on making the coming state testing system a meaningful way of measuring whether students have learned what they are supposed to learn. And that means teaching them the skills and abilities in the standards.
Does that mean Wisconsin will, despite its history, end up with statewide curricula in reading and math? Probably not, if you mean something the state orders local schools to do. But probably yes in terms of making recommendations that many schools are likely to accept.
“We will have a model curriculum, no question,” Evers said. He said more school districts are looking to DPI already for answers because, with the financial crunches they are in, they don’t have the capacity to research good curriculum choices.
Response to the Madison School District’s Math Task Force Recommendations
To: comment@madison.k12.wi.us
Cc: askey@math.wisc.edu
There are a number of points in the Summary of Administrative Response to MMSD Mathematics Task Force Recommendations which should be made. As a mathematician, let me just comment on comments on Recommendation 11. There are other comments which could be made, but I have a limited amount of time at present.
The first question I have is in the first paragraph. “One aspect of the balanced approach is represented in the four block approach to structuring mathematics lessons. The four blocks include Problem Solving, Number Work, Fluency and Maintenance and Inspecting Equations.” There is a missing comma, since it is not clear whether Maintenance goes with the previous word or the last two. However, in either case, “Inspecting Equations” is a strange phrase to use. I am not sure what it means, and when a mathematician who has read extensively in school mathematics does not understand a phrase, something is wrong. You might ask Brian Sniff, who seems to have written this report based on one comment he made at the Monday meeting, what he means by this.
In the next paragraph, there are the following statements about the math program used in MMSD. “The new edition [of Connected Math Project] includes a greater emphasis on practice problems similar to those in traditional middle and high school textbooks. The new edition still remains focused on problem-centered instruction that promotes deep conceptual understanding.” First, I dislike inflated language. It usually is an illustration of a lack of knowledge. We cannot hope for “deep conceptual understanding”, in school mathematics, and Connected Math falls far short of what we want students to learn and understand in many ways. There are many examples which could be given and a few are mentioned in a letter I sent to the chair of a committee which gave an award to two of the developers of Connected Mathematics Project. Much of my letter to Phil Daro is given below.
The final paragraph for Recommendation 11 deals with high school mathematics. When asked about the state standards, Brian Sniff remarked that they were being rewritten, but that the changes seem to be minimal. He is on the high school rewrite committee, and I hope he is incorrect about the changes since significant changes should be made. We now have a serious report from the National Mathematics Advisory Panel which was asked to report on algebra. In addition to comments on what is needed to prepare students for algebra, which should have an impact on both elementary and middle school mathematics, there is a good description of what algebra in high school should contain. Some of the books used in MMSD do not have the needed algebra. In addition, the National Council of Teachers of Mathematics has published Curriculum Focal Points for grades PK-8 which should be used for further details in these grades. Neither of these reports was mentioned in the response you were sent.
Despite initial low test scores, Madison’s Nuestro Mundo gains fans
It’s Thursday afternoon at Madison’s Nuestro Mundo Elementary School and teacher Christina Amberson, “Maestra Cristina” to her kindergarten students, speaks in rapid-fire Spanish. If you didn’t know better, you would assume Spanish was Amberson’s native language. But her impeccable Spanish is a product of many years of studying and teaching abroad in a number of Spanish-speaking countries.
Children respond only in Spanish. The only time they speak English is when English-speaking children are sitting together at tables. If Amberson overhears, she reminds them to use their Spanish.
Amberson’s kindergartners — a nearly even mix of native Spanish speakers and native English speakers — seem more confident with their language than a typical student in a high school or college Spanish class.
Everything posted on the dual-language immersion school’s bulletin boards or blackboards is in Spanish except for a little section of photos and articles about “El Presidente Barack Obama.”
It is ironic that WKCE results are used in this way, given the Wisconsin DPI’s statement: “Schools should not rely on only WKCE data to gauge progress of individual students or to determine effectiveness of programs or curriculum”. Much more on the WKCE here. The Madison School District is using WKCE data for “Value Added Assessment“.
Math Forum Audio / Video and Links
Video and audio from Wednesday’s Math Forum are now available [watch the 80 minute video] [mp3 audio file 1, file 2]. This rare event included the following participants: Dick Askey (UW Math Professor) Faye Hilgart, Madison Metropolitan School District Steffen Lempp (MMSD Parent and UW Math Professor) Linda McQuillen, Madison Metropolitan School District Gabriele Meyer […]
Art Rainwater’s Email regarding Reading First
Madison Schools Superintendent Art Rainwater sent me an email today regarding this paper. Here’s his email: Dear Jim I received a copy of your email to Diane Mayerfeld regarding reading in the Madison Schools. I would like to set straight the misinformation that is contained in the document that you included with your email. First […]