Search Results for: Waunakee mAP madison
Madison School District MAP Scores Report 2015-2016
Madison School District Administration (PDF): 1. The percent of students that tested advanced or proficient on the math portion increased 1% (45% to 46%) and increased 2% on the reading portion (40% to 42%) of the spring MAP test. 2. Proficiency gaps exist between demographic groups on MAP reading and math scores. These gaps are […]
“In addition, we see that very few schools actually achieved growth improvements of 5% or more, with changes in growth generally clustering around 0%.” Slide updates on Madison’s $500M+ Government School System
PDF slides from a recent Madison School District Quarterly Board retreat. Readers may wish to understand “MAP” or “Measure of Academic Progress” [duck duck go SIS 2012 Madison and Waunakee results] Using MAP for Strategic Framework Milestones and SIP Metrics Feedback from various stakeholders has led us to examine the use of MAP (Measures of […]
Commentary on Madison’s Long Term Achievement Gap Challenges; Single Year Data Points…
Pat Schneider: “It seems reasonable to attribute a good share of the improvements to the specific and focused strategies we have pursued this year,” Hughes writes. The process of improvement will become self-reinforcing, he predicts. “This bodes well for better results on the horizon.” Not so fast, writes Madison attorney Jeff Spitzer-Resnick in his Systems […]
Madison Area high schools ACT results; here are the scores
Four Dane County high schools ranked among the top nine in the state for average ACT score by 2013 graduates, according to recent figures from the Wisconsin Department of Public Instruction.
Madison West (fourth), Middleton (sixth), Madison Memorial (eighth) and Waunakee (ninth) all had average scores above 25 on the college admissions exam, which measures students in English, math, reading and science and has a maximum score of 36.
West had the highest state ranking among local schools in English (third) and reading (fourth). Memorial was second in Wisconsin in math, while Waunakee was fifth in science.
All of the 21 Dane County high schools scored above the national composite score of 20.9, while 16 fared better than the state composite of 22.1.Tap on the map icons to view the percentage of students taking the ACT.
Edgewood High School’s composite ACT score is 25.7. All 146 graduates took the ACT according to its September, 2013 newsletter.
An Update on Madison’s Use of the MAP (Measures of Academic Progress) Assessment
Madison Superintendent Jane BelmoreUnlike other assessments, MAP measures both student performance and growth through administering the test in both fall and spring. No matter where a student starts, MAP allows us to measure how effective that student’s school environment was in moving that student forward academically.
This fall’s administration serves as a baseline for that fall to spring growth measure. It also serves as an indicator for teachers. As we continue professional development around MAP, we will work to equip schools to use this data at the classroom and individual student level. In other words, at its fullest use, a teacher could look at MAP data and make adjustments for the classroom or individual students based on where that year’s class is in the fall, according to these results.
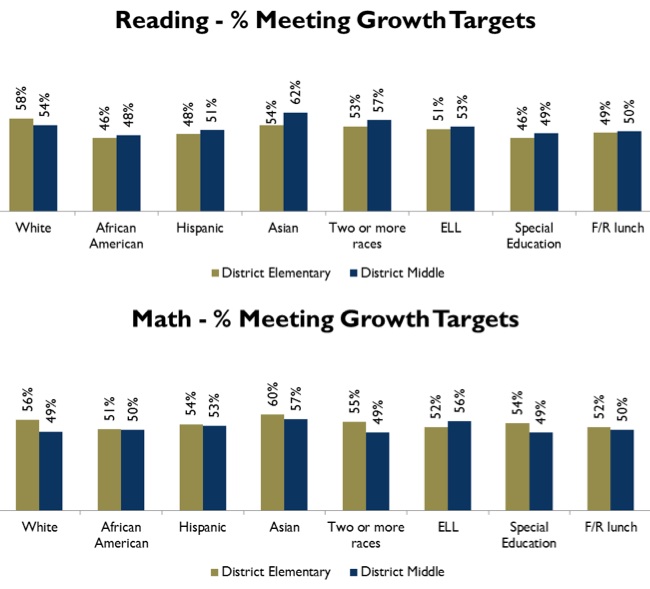
Meeting growth targets on the fall administration indicates that a student met or exceeded typical growth from Fall 2011 to Fall 2012. Typical growth is based on a student’s grade and prior score; students whose scores are lower relative to their grade level are expected to grow more than students whose scores are higher relative to their grade level.
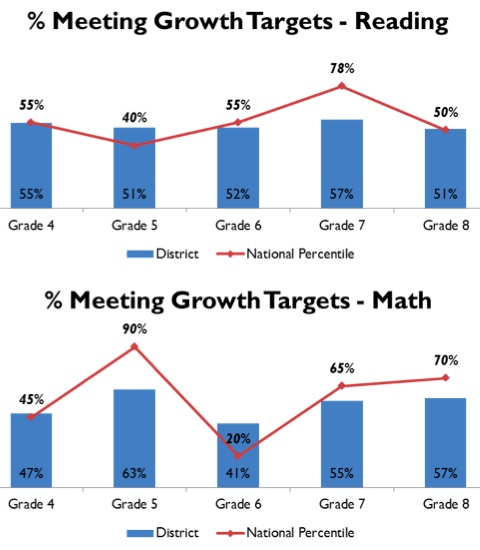
In Reading, more than 50% of students in every grade met their growth targets from Fall 2011 to Fall 2012. In Mathematics, between 41% and 63% of students at each grade level met their growth targets. The highest growth in Mathematics occurred from fourth to fifth grade (63%) and the lowest growth occurred from fifth to sixth grade (41%).
It is important to note that across student groups, the percent of students making expected growth is relatively consistent. Each student’s growth target is based on his or her performance on previous administrations of MAP. The fact that percent of students making expected growth is consistent across student subgroups indicates that if that trend continues, gaps would close over time. In some cases, a higher percentage of minority students reached their growth targets relative to white students. For example, at the middle school level, 49% of white students met growth targets, but 50% of African American students and 53% of Hispanic students met their growth targets. In addition, English Language Learners, special education students, and students receiving free and reduced lunch grew at similar rates to their peers.
MAP also provides status benchmarks that reflect the new, more rigorous NAEP standards. Meeting status benchmarks indicates that a student would be expected to score “Proficient” or “Advanced” on the next administration of the Wisconsin Knowledge and Concepts Examination (WKCE).
That means that even though overall scores haven’t changed dramatically from last year, the percent of students identified as proficient or advanced will look different with these benchmarks. That is not unique for MMSD – schools around the state and nation are seeing this as they also work toward the common core.
While these scores are different than what we have been used to, it is important to remember that higher standards are a good thing for our students, our districts and our community. It means holding ourselves to the standards of an increasingly challenging, fast-paced world and economy. States all around the country, including Wisconsin, are adopting these standards and aligning their work to them.
As we align our work to the common core standards, student achievement will be measured using new, national standards. These are very high standards that will truly prepare our students to be competitive in a fast-paced global economy.
At each grade level, between 32% and 37% of students met status benchmarks in Reading and between 36% and 44% met status benchmarks in Mathematics. Scores were highest for white students, followed by Asian students, students identified as two or more races, Hispanic students, and African-American students. These patterns are consistent across grades and subjects.
Attachment #1 shows the percentage of students meeting status benchmarks and growth targets by grade, subgroup, and grade and subgroup. School- and student-level reports are produced by NWEA and used for internal planning purposes.Related: 2011-2012 Madison School District MAP Reports (PDF Documents):
- District Summary
- District Growth Summary
- Growth by Ethnicity
- Allis Elementary
- Black hawk Middle School
- Chavez Elementary School
- Cherokee Middle School
- Crestwood Elementary School
- Elvehjem Elementary School
- Emerson Elementary School
- Falk Elementary School
- Glendale Elementary School
- Gompers Elementary School
- Hamilton Middle School
- Hawthorne Elementary School
- Huegel Elementary School
- Jefferson Middle School
- Kennedy Elementary School
- Lake View Elementary School
- Leopold Elementary School
- Mendota Elementary School
- Nuestro Mundo Elementary School
- O’Keeffe Middle School
- Olson Elementary School
- Orchard Ridge Elementary School
- Randall Elementary School
- Sandburg Elementary School
- Schenck Elementary School
- Sennett Middle School
- Sherman Middle School
- Shorewood Elementary School
- Spring Harbor Middle School
- Stephens Elementary School
- Thoreau Elementary School
- Toki Elementary School
- Van Hise Elementary School
- White Horse Middle School
- Wright Middle School
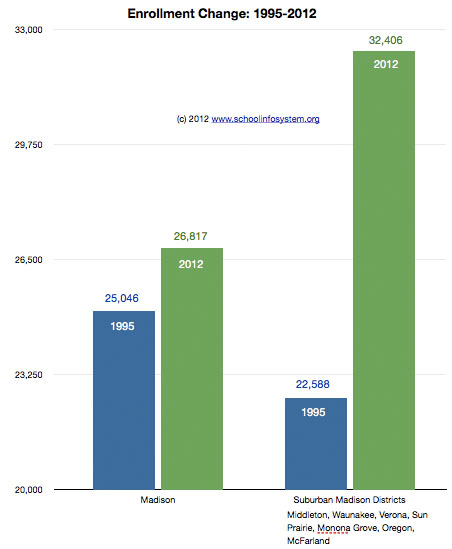
I requested MAP results from suburban Madison Districts and have received Waunakee’s Student Assessment Results (4MB PDF) thus far.
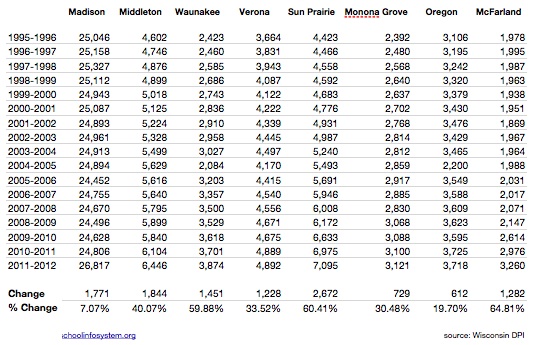
Paul Vallas visits Madison; Enrollment Growth: Suburban Districts vs. Madison 1995-2012
Related:
- Where Have All the Students Gone (November, 2005)?
- Where Have all the Students Gone? An Update (January, 2008)
- Madison School District Outbound Open Enrollment.
- Open Enrollment Leavers Survey
Paul Vallas will be speaking at Madison LaFollette high school on Saturday, May 26, 2012 at 1:00p.m. More information, here.
Much more on Paul Vallas, here.
Directions.
Per Student Spending:
I don’t believe spending is the issue. Madison spends $14,858.40/student (2011-2012 budget)
Middleton’s 2011-2012 budget: $87,676,611 for 6,421 students = $13,654.67/student, about 8% less than Madison.
Waunakee spends $12,953.81/student about 13% less than Madison.
A few useful links over the past decade:
- Notes and links on Madison Superintendent hires since 1992 (2007).
- English 10
- Small Learning Communities
- Connected Math
- Reading Recovery
- When all third graders read at grade level or beyond by the end of the year, the achievement gap will be closed…and not before
- Madison School Board member may seek audit of how 2005 maintenance referendum dollars were spent
- Madison Preparatory Academy
Dane County, WI Schools Consider MAP Assessement Tests After Frustration with State WKCE Exams
Waunakee Urges that the State Dump the WKCE
Andy Hall takes a look at a useful topic:
From Wisconsin Heights on the west to Marshall on the east, 10 Dane County school districts and the private Eagle School in Fitchburg are among more than 170 Wisconsin public and private school systems purchasing tests from Northwest Evaluation Association, a nonprofit group based in the state of Oregon.
The aim of those tests, known as Measures of Academic Progress, and others purchased from other vendors, is to give educators, students and parents more information about students ‘ strengths and weaknesses. Officials at these districts say the cost, about $12 per student per year for MAP tests, is a good investment.
The tests ‘ popularity also reflects widespread frustration over the state ‘s $10 million testing program, the Wisconsin Knowledge and Concepts Examination.
Critics say that WKCE, which is used to hold schools accountable under the federal No Child Left Behind law, fails to provide adequate data to help improve the teaching methods and curriculum used in the classrooms.
They complain that because the tests are administered just once a year, and it takes nearly six months to receive the results, the information arrives in May — too late to be of use to teachers during the school year.
The testing controversy is “a healthy debate, ” said Tony Evers, deputy state superintendent of public instruction, whose agency contends that there ‘s room for both WKCE and MAP.
….
“It ‘s a test that we feel is much more relevant to assisting students and helping them with their skills development, ” said Mike Hensgen, director of curriculum and instruction for the Waunakee School District, who acknowledges he ‘s a radical in his dislike of WKCE.
“To me, the WKCE is not rigorous enough. When a kid sees he ‘s proficient, ‘ he thinks he ‘s fine. ”
Hensgen contends that the WKCE, which is based on the state ‘s academic content for each grade level, does a poor job of depicting what elite students, and students performing at the bottom level, really know.
The Waunakee School Board, in a letter being distributed this month, is urging state legislators and education officials to find ways to dump WKCE in favor of MAP and tests from ACT and other vendors.
- More on WKCE scores – Missing Students
- 2006 MMSD WKCE Scores: A Closer Look
- “Schools should not rely on only WKCE data to gauge progress of individual students or to determine effectiveness of programs or curriculum”
- The Fordham Foundation has given Wisconsin’s state standards a “D”.
- Imperial College Ditches A Levels and Sets its own Entrance Exam
Madison Area School Student Population Numbers
Susan Troller’s recent article on possible school closings mentioned that some Madison Schools have smaller populations than others in the District. I’ve posted a simple table that summarizes MMSD elementary, middle and high school student population numbers with those from nearby suburban communities: Middleton-Cross Plains, Monona Grove, Stoughton, Sun Prairie, Verona and Waunakee. MMSD facility […]
Technology in Education
In the wake of the annual EdWeek Technology Counts issue, there has been some discussion surrounding the idea that technology is education is harmful. I attribute this to a few factors, including to overstated claims for educational technology in the past, concerns about very specific uses of technology in education like calculators, and the comfort […]
History Will Be Made On Friday Night!!!
On Friday November 18th at Madison Ice Arena [map] the Madison Metro Lynx invites you to attend their game versus Superior High School at 6:30 p.m. This is the first girls ice game in the history of the Madison Metropolitan School District! Madison Metro Lynx is a seven school cooperative effort of the MMSD with […]