Madison School District Administration (PDF):
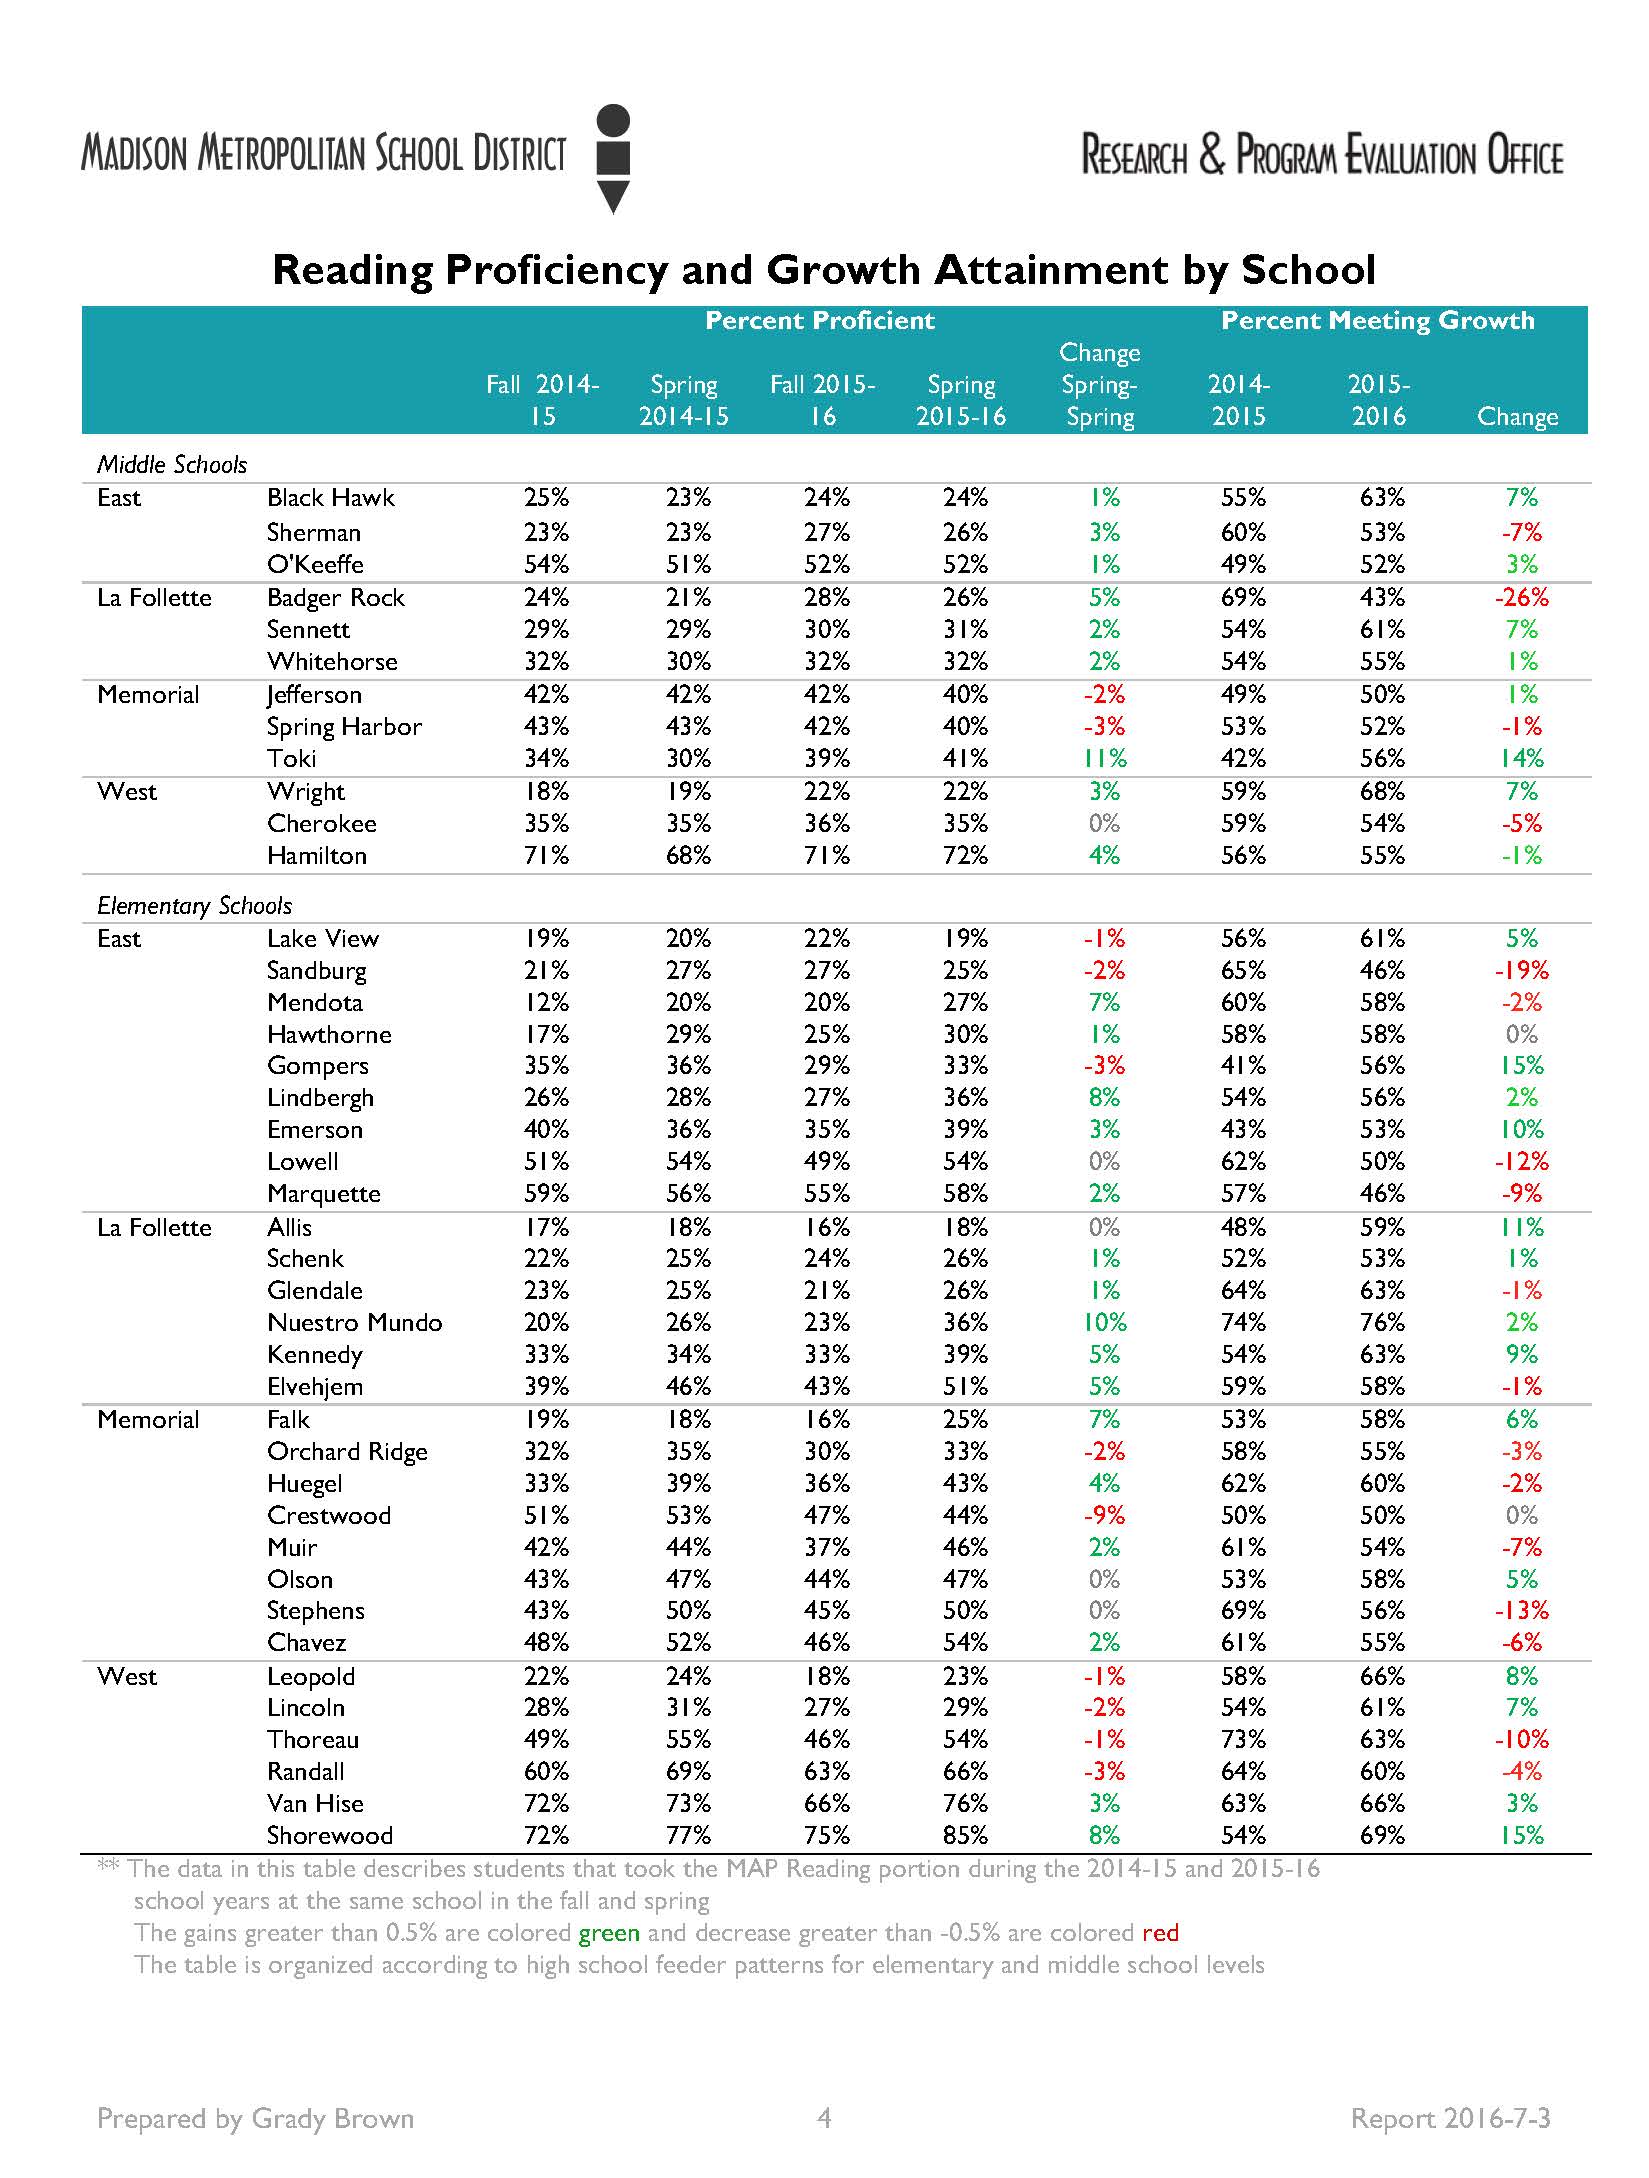
1. The percent of students that tested advanced or proficient on the math portion increased 1% (45% to 46%) and increased 2% on the reading portion (40% to 42%) of the spring MAP test.
2. Proficiency gaps exist between demographic groups on MAP reading and math scores. These gaps are similar to disparities on other standardized tests.
3. All demographic groups saw the same or an increase in the percent of students achieving proficiency in reading and math from fall to spring during both the 2014-15 and 2015-16 school years.
4. Students in each demographic group met their growth goal at more similar rates than the percent achieving proficiency. All demographic groups saw the same or an increase in the percent of students meeting reading growth goals. This is encouraging because students who have a lower score must grow more over the year to meet their goal.
The Madison Metropolitan School District (MMSD) has administered the Measures of Academic Progress (MAP) test in grades 3-8 for the past five school years: 2011-12 through 2015-16. This report focuses on progress made on the percent of students testing at least proficient in math and reading for each of the fall and spring administrations of the test during the 2014-15 and 2015-16 school years and the fall to spring growth of students during each of these school years.

2011-2012 Madison MAP assessment data.
Almost all schools set goals for MAP growth that aligned with a district recommendation: 5%, 10%, or 15%. In addition, we see that very few schools actually achieved growth improvements of 5% or more, with changes in growth generally clustering around 0%.
Notes and links, here.
Chicago, interestingly, publishes extensive school data, here.