Chan Stroman posted a valuable and in-depth examination of the District’s WKCE scores, and is it in the spirit of that posting that I would like to share my own little examination of our most recent test results. Rather than focusing on the scores of our students, this is an investigation of the numbers of MMSD students who took the WKCE exams. My intention is to simply present the data and let the reader draw their own conclusions.
This journey began with a question: How did students at West High School do on the WKCE exams now that the school has completed their three year Small Learning Communities grant. A relatively straightforward question that can be addressed by a visit to the DPI web site. However, in the process of looking at West High School’s test data from the Fall of 2006, it was surprising to see that only 39 African American students had been tested. Certainly there had to be more than 39 African American 10th graders at West this year, and if we want WKCE scores to provide an accurate assessment of the
“success” of a school, it is important that there isn’t any bias in which groups of students provide the assessment data.
The District makes available a number of breakdowns of student enrollment data by grade, by school, by ethnicity, by income status, and combinations thereof. However, there is not a breakdown that provides enrollment numbers by school by grade by ethnicity. Thus, if we want to know the number of African American 10th graders at a particular school we have to make an educated guess. We can do that by taking the percentage of African American students enrolled in the school and multiplying that by the number of students in the 10th grade. This gives us a rough estimate of the number of students enrolled. We can then compare that to the number of students who took the WKCE test to estimate the percentage of missing students.
West High School had 517 10th graders enrolled this past year, and 14% of the student body was African American. This suggests that there should be approximately 73 African American 10th graders at West which means that 34 students or 46.6% were not tested. This is very different from the overall proportion of West 10th graders not tested: 14.5% (DPI data show that 442 of the 517 students in the 10th grade were tested this past year). However, this is only one year’s data at one of our high schools. We need to put this data in context if we are to draw any conclusions. So here is the data for the four high schools for the past five years.
| High School | Year | MMSD Enrollment | Proportion African American Enrolled | Predicted AA 10th Graders | African American Tested | Total 10th Grade Tested | % AA Missing | % Total Missing | Discrepancy (AA% – Total %) |
|---|---|---|---|---|---|---|---|---|---|
| West | 2002/03 |
624
|
14%
|
85.86
|
73
|
529
|
14.99%
|
15.22%
|
-0.24%
|
| 2003/04 |
591
|
14%
|
79.45
|
54
|
484
|
32.04%
|
18.10%
|
13.93%
|
|
| 2004/05 |
523
|
15%
|
77.09
|
68
|
457
|
11.78%
|
12.62%
|
-0.83%
|
|
| 2005/06 |
563
|
14%
|
77.91
|
75
|
489
|
3.74%
|
13.14%
|
-9.41%
|
|
| 2006/07 |
517
|
14%
|
72.98
|
39
|
442
|
46.56%
|
14.51%
|
32.05%
|
|
| East | 2002/03 |
598
|
21%
|
125.91
|
85
|
481
|
32.49%
|
19.57%
|
12.93%
|
| 2003/04 |
538
|
22%
|
116.39
|
91
|
437
|
21.81%
|
18.77%
|
3.04%
|
|
| 2004/05 |
538
|
21%
|
113.54
|
94
|
444
|
17.21%
|
17.47%
|
-0.26%
|
|
| 2005/06 |
501
|
23%
|
114.15
|
93
|
443
|
18.53%
|
11.58%
|
6.95%
|
|
| 2006/07 |
472
|
22%
|
105.64
|
81
|
385
|
23.32%
|
18.43%
|
4.90%
|
|
| La Follette | 2002/03 |
416
|
12%
|
50.23
|
42
|
373
|
16.38%
|
10.34%
|
6.05%
|
| 2003/04 |
464
|
14%
|
63.72
|
41
|
385
|
35.66%
|
17.03%
|
18.63%
|
|
| 2004/05 |
427
|
16%
|
67.40
|
50
|
355
|
25.81%
|
16.86%
|
8.95%
|
|
| 2005/06 |
456
|
17%
|
79.57
|
53
|
389
|
33.39%
|
14.69%
|
18.69%
|
|
| 2006/07 |
466
|
21%
|
96.88
|
76
|
413
|
21.55%
|
11.37%
|
10.18%
|
|
| Memorial | 2002/03 |
577
|
14%
|
80.75
|
74
|
502
|
8.36%
|
13.00%
|
-4.64%
|
| 2003/04 |
612
|
13%
|
87.55
|
74
|
528
|
15.47%
|
13.73%
|
1.75%
|
|
| 2004/05 |
592
|
15%
|
92.74
|
59
|
491
|
36.38%
|
17.06%
|
19.32%
|
|
| 2005/06 |
552
|
14%
|
96.48
|
77
|
471
|
20.19%
|
14.67%
|
5.52%
|
|
| 2006/07 |
542
|
14%
|
94.01
|
94
|
488
|
0.01%
|
9.96%
|
-9.95%
|
What about other ways to look at the number of high school students who took the WKCE’s?
More than race or ethnicity, research clearly shows that school performance is strongly linked to socio-economic status. Thus we can ask are low income students represented to the same degree on the WKCE as non-economically disadvantaged students. Again because the posted enrollment statistics for the district don’t provide a breakdown of economic status by grade within a school we have to estimate the numbers of students from the overall school percentages. Given that we know that the percentage of free and reduced lunch students are increasing in our high schools, the use of a whole school perecentage to estimate the 10th grade population will likely underestimate the numbers of low income students, but these numbers are still a starting point.
Here are those data for our four high schools:
| High School | Year | MMSD Enrollment | Proportion Low Income Enrolled | Predicted Low Income 10th Graders | Low Income Tested | Non-Disadvantaged Tested | % Low Income Tested | % Non-Disadvantaged Tested | Testing Gap (Low Income – Non-Disadv.%) |
|---|---|---|---|---|---|---|---|---|---|
| West | 2002/03 |
624
|
18.7%
|
116.62
|
73
|
407
|
104.61%
|
80.22%
|
-24.4%
|
| 2003/04 |
591
|
24.1%
|
142.63
|
54
|
410
|
51.88%
|
91.44%
|
39.56%
|
|
| 2004/05 |
523
|
24.0%
|
125.42
|
68
|
379
|
62.19%
|
95.33%
|
33.14%
|
|
| 2005/06 |
563
|
25.2%
|
142.06
|
75
|
375
|
80.25%
|
89.09%
|
8.84%
|
|
| 2006/07 |
517
|
27.0%
|
139.81
|
39
|
341
|
72.24%
|
90.41%
|
18.17%
|
|
| East | 2002/03 |
598
|
31.8%
|
190.17
|
154
|
327
|
80.98%
|
80.18%
|
-0.80%
|
| 2003/04 |
538
|
39.0%
|
209.65
|
65
|
372
|
31%
|
113.29%
|
82.29%
|
|
| 2004/05 |
538
|
35.3%
|
189.69
|
118
|
326
|
62.21%
|
93.59%
|
31.39%
|
|
| 2005/06 |
501
|
42.0%
|
210.32
|
178
|
265
|
84.63%
|
91.16%
|
6.53%
|
|
| 2006/07 |
472
|
43.5%
|
205.27
|
161
|
224
|
78.43%
|
83.98%
|
5.55%
|
|
| La Follette | 2002/03 |
416
|
17.5%
|
72.90
|
66
|
307
|
90.54%
|
89.48%
|
-1.06%
|
| 2003/04 |
464
|
23.7%
|
110.04
|
61
|
324
|
55.44%
|
91.53%
|
36.10%
|
|
| 2004/05 |
427
|
26.4%
|
112.65
|
74
|
281
|
65.69%
|
89.39%
|
23.70%
|
|
| 2005/06 |
456
|
32.2%
|
146.87
|
113
|
276
|
76.94%
|
89.28%
|
12.34%
|
|
| 2006/07 |
466
|
36.7%
|
171.25
|
143
|
270
|
83.50%
|
91.60%
|
8.10%
|
|
| Memorial | 2002/03 |
577
|
19.2%
|
110.69
|
114
|
388
|
102.99%
|
83.21%
|
-19.78%
|
| 2003/04 |
612
|
22.3%
|
136.74
|
85
|
443
|
62.16%
|
93.21%
|
31.05%
|
|
| 2004/05 |
592
|
23.5%
|
139.25
|
86
|
405
|
61.76%
|
89.45%
|
27.69%
|
|
| 2005/06 |
552
|
27.8%
|
153.26
|
119
|
352
|
77.64%
|
88.28%
|
10.63%
|
|
| 2006/07 |
542
|
28.8%
|
156.34
|
140
|
348
|
89.55%
|
90.24%
|
0.69%
|
It is hard to tell if there is any pattern in the data, though it does look like we, as a District, are gradually getting better at getting our low income students tested at similiar rates as our non-economically disadvantaged students. However, when you look at overall percentages of students tested, it does not seem that Madison is doing a very good job of testing students. This is what DPI says about student participation:
All students are expected to take WSAS assessments except students who are excused by their parents. Only a fraction of a percentage of students statewide are excused from WKCE testing by their parents. An extended testing window is provided so that students who are absent on any given day can take make-up tests. Some students are not assessed possibly due to long-term absences or other reasons.
Ninety eight to Ninety-nine percent of students statewide are generally expected to take WKCE during the three-week testing window, but actual participation rates are lower especially among student groups with the lowest achievement levels (e.g. students of color and economically disadvantaged students). One to two percent of students statewide take WAA in lieu of WKCE.
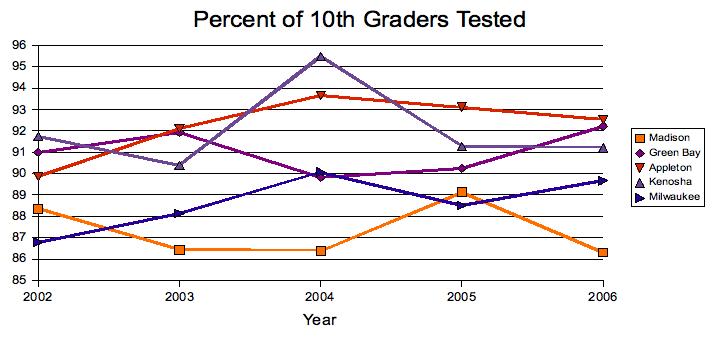
While this suggests that MMSD is not meeting the expectations of DPI regarding student assessment, it is reasonable to ask how other similar districts around the state are doing in their testing of 10th grade students. For this comparison, I examined enrollment data and number of students tested for Green Bay, Appleton, Kenosha, and Milwaukee school districts. All of these numbers come from DPI and reflect students in all high schools and alternative programs. As an aside, I will note that the third Friday enrollment numbers listed by MMSD do not match those posted on the DPI website, and it is for the sake of an honest comparison that I have used DPI numbers for all five districts.
| Year | MMSD Third Friday 10th Grade Enrollment | DPI Reported 10th Grade Enrollment |
|---|---|---|
|
2002/03
|
2274
|
2274
|
|
2003/04
|
2252
|
2263
|
|
2004/05
|
2129
|
2158
|
|
2005/06
|
2111
|
2106
|
|
2006/07
|
2058
|
2104
|
When we look at these data, we see that MMSD tests fewer of its 10th graders than all four of the chosen districts, even Milwaukee tests a larger percentage!
So there it all is for you, the reader, to chew on. What do you think it means and what do you think it says about our district?
Great analysis, Jeff, but the suprintendent and the board do not care enough about poor academic achievement to take any action. You wasted your time. So sad.
Just wondering about the DPI data…..I thought the WKCE scores posted on WINSS were just for kids who had attended a particular school for a “full academic year” (FAY) prior to the testing year….meaning that the kids would have to have been enrolled on the 3rd Friday in September in the year prior to the test year. East has very high mobility, so the FAY data for East would be counting a significantly lower number of students than actually enrolled. Would that account for some of these discrepancies? Or am I misunderstanding what is posted on WINSS?
Thank you for this, Jeff. My take on this is that this calls into question the district’s statement, from its WKCE press release, that “A higher percentage of MMSD African American students perform at the highest proficiency level on the WKCE tests than do other African American students across the state as a whole.” The numbers the district used in the press release track those from the DPI web site (WKCE only, not WKCE+WAA+WSAS, and based on FAY). If there is a significant level of “missing scores” from “missing students”, I believe it is reasonable to conclude that if scores for mobile and/or truant students were factored in, the “advanced” percentage would be lower.
I guess I’d like to respond to Ed’s comment (since a similar comment was made to my WKCE post). I can certainly understand the frustration. But the point of drilling down into the data isn’t (at least not for me, and I can only speak for myself here) to try to enlighten district administration or the board. (District administration would have to have pored over the data pretty intensively to come up with the few pieces of data that were cast as “good news” in its press release, so I’m sure it is quite aware that the real story isn’t quite so rosy. And the board is, I’m sure, familiar enough with the district’s practices to know whether or not it’s prudent to base the board’s decisions based on press releases rather than the facts.) I wanted to take a first-hand look at the numbers in order to see for myself whether there is a problem with students in our district being able to read and do math, and in order to calibrate the sincerity and credibility of how the district communicates to the public regarding these very critical matters.
The administration and board do not want to be “enlighten.” They’re completely content with the academic success of students in the MMSD. They may pay lip service to improving academic sucess, but you won’t find a single effort to change anything, except to dumb down the curriculum. The board will just keep doing what they’ve been doing (sticking their heads in the sand) and expect different results — which by the way is one popular definition of mental illness.
You care, Chen. I care. But no one in power gives a rip. Give it up. You’re wasting your time.
Don’t let hopelessly negative people put off your analytical zeal, Jeff or Chan. I have appreciated the real look at data, and not only quote them when talking with people in the district who care (parents, teachers, and residents w/out school-aged children), but point them to links of your informal studies. The more informed taxpayers we have who get loud and angry about this, the more likely administrators of various stripes are to “give a rip”. I wouldn’t put too much time into such analyses so that I couldn’t do my paid job (not that I am implying that either of you have!!), but I do find it valuable and instructive, and I thoroughly appreciate it. (As I do Laurie’s and others ‘previous postings that bring up similarly relevant questions.)
To add an anecdote on this general topic…. Our own son has consistently scored ridiculously high on WKCE’s (especially in reading), and just took the SATs this year (he is in sixth grade!) for WCATY and other G&T programming eligibility questions. He scored a 22 on the SAT’s for reading (in sixth grade, with no accommodations for his severe anxiety and other special education characteristics). For the WKCE’s this year, we were told he scored in the middle of the “proficient” range, at about 45th percentile this year – as opposed to past years, where he has scored 95th and above in reading. He also happened to miss one day of school during testing, due to administrative decisions regarding ‘consequences’ for a problem at school (which problem would not have occurred if his IEp were being followed…). What a coincidence, isn’t it, that his scores dropped so precipitously, when he happened to miss a full day of school during testing? When I asked if it were possible he was not given a chance to make up that missing day, I was told they were ‘pretty sure’ he made it up. Then when I expressed surprise at how blase’ they seemed about it, they responded again saying they were ‘almost certain’ he would have made it up, and the low scores were probably because he was just speeding through the testing in spite of them telling him to slow down and ‘do his best work’. IN other words, they had no records and no way to find out from the testing company if he had simply missed a whole section of reading testing; and it was a non-issue in their eyes anyway, because he probably was just being ‘sloppy’ and working too fast.
BTW, one of his testing accommodations is to have an adult checking to make sure he has marked his answer sheet in the correct spaces and has no big gaps or gets ‘off’ with the numbering. So how do they reconcile their version of what “probably” happened with whether or not they were checking his progress as a legally binding IEP document tells them to?
I know it is just one set of scores from one year, and it doesn’t really affect him much this year. I know we have other scores to show his ‘true achievement levels’ in other testing (because we fight to hear about those opportunities and try to come up with the testing fees for him to take part!). But I also know that these are the scores the district puts so much weight on, and that if it were his eighth grade year (when so much of high school placement is decided on early eighth grade testing!), it would completely screw up his class placements for his entire first year of high school (at least). To have them act like it was no big deal, and as though even if it did happen the way we said, it doesn’t really affect much, makes my blood boil. MMSD is using these scores as though they were hard and fast gospel, and yet they don;t care when one of the top students who can pull up their averages in several sub-groups is not tested fairly?
I used to be hopelessly hopeful. I posted analyses of test scores, believing that the “facts” would lead to curriculum improvements. NOT!
Oops. I said he scored a 22 on the SAT in reading when I meant a 22 on the ACT in reading. Not an exceptional score for a college-bound senior, but a respectable one. The trick is, he was in mid-sixth grade at the time. Thus the doubt that he “really” scored near the 50th percentile for sixth graders in reading on the WKCEs. I used to think MMSD cared about the WKCE scores for each school because they had to for NCLB – I don’t believe anymore that they care in MMSD on anything other than vague overall ‘averages’ for certain subgroups. Certainly for individual students, I have been told over and over that they ‘don’t really matter anyway’; then I hear Doyle Bldg people playing up group scores as though they were amazing and rationalizing areas where MMSD supposedly falls short on NCLB requirements.
Millie: I, too, put little to no stock in WKCE scores for students that need special accomodations. With proper accomodations, my son scored advanced in 6th grade reading. But, when he took the WKCE in 7th grade, he complained it wasn’t being delivered to him properly (it was read to him instead of him reading it aloud, and only after we complained was it properly delivered). Alas, he scored minimal in reading. However, our learning coordinator documented how the staff erred in delivery, as well as how our son’s Read 180 lexile varies according to delivery, so that when he goes to East, he can get into TAG English- which he can and will do!
So, for me, the lesson is that WKCE scores can be screwed up by staff not delivering the tests according to IEP standards..and parents just have to be extra extra vigilant. I forsee the ACT/SAT taking a week to complete!
However, I also see what happens in a school climate where there is woeful understaffing, and I wonder how many kids didn’t have a mom or dad to intervene in the testing process to ensure the IEP is rigorously followed.
My 4th grader’s WKCE scores this year were a real shock to me, but I never followed up on it and no one in the school administration cared to contact me about it. I’m used to seeing scores in the 90’s, so I was quite surprised to find a score in reading of I think somewhere in the 50’s. This was juxtaposed with a math of 99 and a perfect social studies, so a bit unbelievable. He was sick the days of reading test, so I figured he got off count on answers or some pages stuck together. Now reading Millie’s comment, I wonder if he made up the test the day he missed school. In general, these tests don’t seem to have any practical effect on his schooling, so I just laughed and forgot about it. But I think I heard that in at least one year recently, West used 5th grade reading scores as the determinant for eligibility to skip heterogeneous 9th grade English.
Anyway, it is pretty clear that MMSD does not care a bit or at least does not have the staffing to address problems with individual scores and to correct errors of this type.
West is using 8th grade — not 5th grade — WKCE scores in Reading in order to determine eligibility for skipping over English 9 or English 10 (student’s choice). Students who score at or above the 95th percentile are supposed to be offered the opportunity. Implementation has been somewhat … tortured, shall we say, possibly reflective of some people’s ambivalence about — even resistance to — the whole idea of an English-advanced student being allowed to subject accelerate.
And then there’s Accelerated Biology … . But more on that later.
Carrying out WKCE testing is significantly more complicated than it might seem. It generally takes our grade level several meetings just to figure out how to come up with enough environments and proctors to staff the different groups. We are multi-age, 4th and 5th, so there are two different tests to give, with varying time blocks. Special education accomodations require their own environments and are generally understaffed due to resource availability, not due to lack of caring (certified staff must administer the test, so many staff working with special education students can only support accomodations if they are in a room with a certified teacher). The same is true for ELL students, who (in our case) comprise two different language groups with needs for different BRS supports, one of which is not even full time at our school (again, due to lack of resource). ELL and special education students are not under the same time constraints in most situations, so testing periods do not end simultaneously. The testing window is not infinite and the test takes multiple days to administer. I know that in our building we always end testing with 1-2 days left in the window to allow for make up testing of absent students (which takes additional staffing and silent environments–never mind if it is a student who requires accomodations/special staffing). If the testing window has ended and a student has not had enough time to make up the missed sections, my recollection is that we are out of luck. None-the-less, I know that in my building there is a lot of effort put into getting students through all the testing.
Having watched a number of students take the 4th and 5th grade tests, I offer the following observations about the test at that level: some of our students are anxious during testing and make mistakes they would never make under normal conditions; some students are over confident and make careless errors competing with one another to see who can finish first (despite our best efforts to discourage this); some students find the reading passages incredibly boring and engage in the same inattentive reading that adults often engage in when we read something that we find incredibly boring.
Few students at this level place any real importance on the test–they don’t get the tests back and don’t get a score for months. Most are bored with testing by the second or third section–they don’t get to talk or move around, and the test covers a range of content that feels pretty random. Other students, of course, do really well under these conditions. Teachers see the scores at roughly the same time as parents, and in the absence of the test itself (to see where errors were made), it would be hard to offer much useful feedback to parents (6 months after the fact) as to why a student did or didn’t perform well. Students without accomodations are allowed very little interaction from the teacher proctoring the test, thus it’s hard to know why a student would be off track.
At the 4th/5th grade level, it is unlikely that a student would make many marks in incorrect places, since they mark directly in the test booklet. In other testing situations, I see misinterpretation of a question as the most common error among students who know the material–sometimes this is due to the way the question is phrased, sometimes it is due to an unfamiliar word, sometimes to hurried reading.
It is not my impression that no one cares about the test scores, and during testing periods our school is doing little else. However, it is also true that many of us take individual outcomes with a large grain of salt, and because it largely tests material that was taught by the previous teacher (due to the timing of the test) and is reported back to us too late to do remediation (and without enough specifics to identify definite holes) it is difficult to use it to inform our instruction.
As a parent, I can identify with the frustration of seeing a test score that is not reflective of ability. I’m just not sure that short of devoting a lot of time to test prep (taking multiple practice tests in which students see their mistakes and scores) that there is much her school can do about it. Personally, I would prefer she not spend her instructional time that way at this point in her life, even if the schools had the funds to purchase reams of comparable practice tests (and assuming there are some comparable ones–most do not seem to be very similar to WKCE items).
I am actually a huge believer in assessment, but not in this type of assessment at this point in a student’s education. If we look at it as a practice opportunity for future tests, then it may have value in building stamina/familiarity for future high stakes tests. If we want it to give an accurate picture of what our individual student knows in elementary school, than I think the test and testing conditions would need to be significantly altered.
Teacher L points out a number of reasons — primarily the huge gap in time between the test-taking and the results — why the WKCE should be dumped. Those on SIS who decry the state of state funding of education, and worry about the intractability of that issue, might do well to advocate for changes in the state’s assessment system that currently does little to get at the issue of proper assessment, improvements in curriculum and teaching, and targeting instuctional efforts at what kids don’t know. The WKCE is a failure in almost all regards in those areas.
I would note that there are assessment tools out there that provide much better feedback, more quickly, and over several years (that measure real progress, or lack of), that many school districts in Wisconsin are using. But it’s at an additional cost, and the state (DPI and lawmakers) has shown little willingness to embrace non-WKCE assessments as a methodology for demonstrating competency/proficiency/NCLB compliance.
Phil,
I’m curious–which tests do you like and why? Are there versions you support at each of the academic levels tested by WKCE?
MAP and DIBELS, for starters. Both offer longitudinal data for individual students for several years, and both offer a much quicker turnaround in terms of getting assessment results and changing what can be taught to students to get at better achievement. Part of the power of these tools, I would argue, is that they provide good long-term data to parents, who can track their child’s progress (or lack thereof). Data in the hands of consumers, I’d argue, it always a powerful tool in terms of achieving change.
After reviewing the information and comments regardig the WKCE test ressults, I would like say that Chan’s information is consistent with the results I came up with when I analyzed test performance last year. Madison does have an unacceptably large achievement gap and it does not appear to be improving.
Another tidbit of information I would like to share is that the “Revenue per Pupil” in Madison for 2005/2006 was $13,200 – this is more funding than any other district in WI with a student student enrollment of over 10,000 pupils. Kenosha, which is close to Madison in both enrollment numbers and demographics, came in at $10,872. In other words, our revenue per student is 21% higher than Kenosha’s. (The source of this data can be found at dpi.wi.gov/sfs/xls/cmprev06.xls) How is the extra money being spent and why is it not having a more positive impact on learning as measured by the tests?
My purpose in sharing this is not to influence administrators or MMSD Board members but to offer stakeholders and interested parties a new slant on MMSD’s fiscal accountability and responsibility to students. I encourage readers to visit the source of the data (dpi.wi.gov/sfs/xls/cmprev06.xls) so you can also see that the proportion of funding through property taxes appears to be extremely high in Madison when compared to other communities. Now I wonder what that’s all about….