Real Public School Spending vs. Real Oil Prices 1929-2007
Mark Perry:
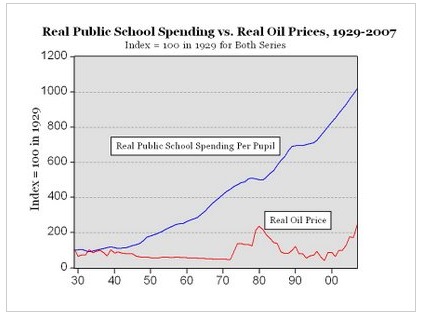
Using these data from the U.S. Department of Education and oil prices from Global Financial Data, the graph above (click to enlarge) shows expenditures per pupil in public elementary and secondary schools from 1929-2007, adjusted for inflation, and oil prices during the same period, also adjusted for inflation. Both series are price indexes set to equal 100 in 1929.
The data for public school spending are only available through the 2001-2002 school year from the Department of Education, and I was unable to find a comparable series through 2007, but I extended the series from 2002 through 2007 by assuming that the trend in spending for education would continue (about a 3% per year real growth rate).
Posted by Jim Zellmer at October 29, 2007 12:00 AM
Subscribe to this site via RSS/Atom:  Newsletter signup | Send us your ideas
