Pankaj Ghemawat and Steven Altman (PDF):
Proceeding to country-level results, the ten most glob- ally connected countries in 2015 were (in descending order): the Netherlands, Singapore, Ireland, Switzerland, Luxembourg, Belgium, Germany, the United Kingdom, Denmark, and the United Arab Emirates. On the depth dimension of the index, which compares countries’ inter- national flows to the sizes of their domestic economies, the most deeply connected economies were: Singapore, Hong Kong SAR (China), Luxembourg, Ireland, and Bel- gium. On the breadth dimension, which evaluates the extent to which countries’ international flows are dis- tributed globally or more narrowly focused, the leading countries were: the United Kingdom, the United States, the Netherlands, South Korea, and Japan.
Roughly 70% of the variation in countries’ observed levels of global connectedness can be explained based on structural characteristics such as their sizes, levels of economic development, and geographic remoteness. The countries that most outperformed expectations on the depth dimension of global connectedness, in particular, were: Cambodia, Vietnam, Malaysia, Singapore, and Mozambique.
Comparing the global connectedness of advanced versus emerging economies reveals the former to be far more connected than the latter. On trade depth, advanced and emerging economies are roughly at parity, but ad- vanced economies are about four times as deeply inte- grated into international capital flows, five times as much on people flows, and nine times with respect to information flows. The rising proportion of economic activity taking place in emerging economies continues to prompt international flows to stretch out over greater distances (and to become less regionalized), but this shift toward interactions over greater distances has deceler- ated since the crisis years.This report also introduces two new city-level globaliza- tion indexes: “Globalization Hotspots” and “Globaliza- tion Giants.” While these new indexes cover the same four pillars as the DHL Global Connectedness Index, dif- ferent (and fewer) component measures are used due to more limited availability of city-level data.
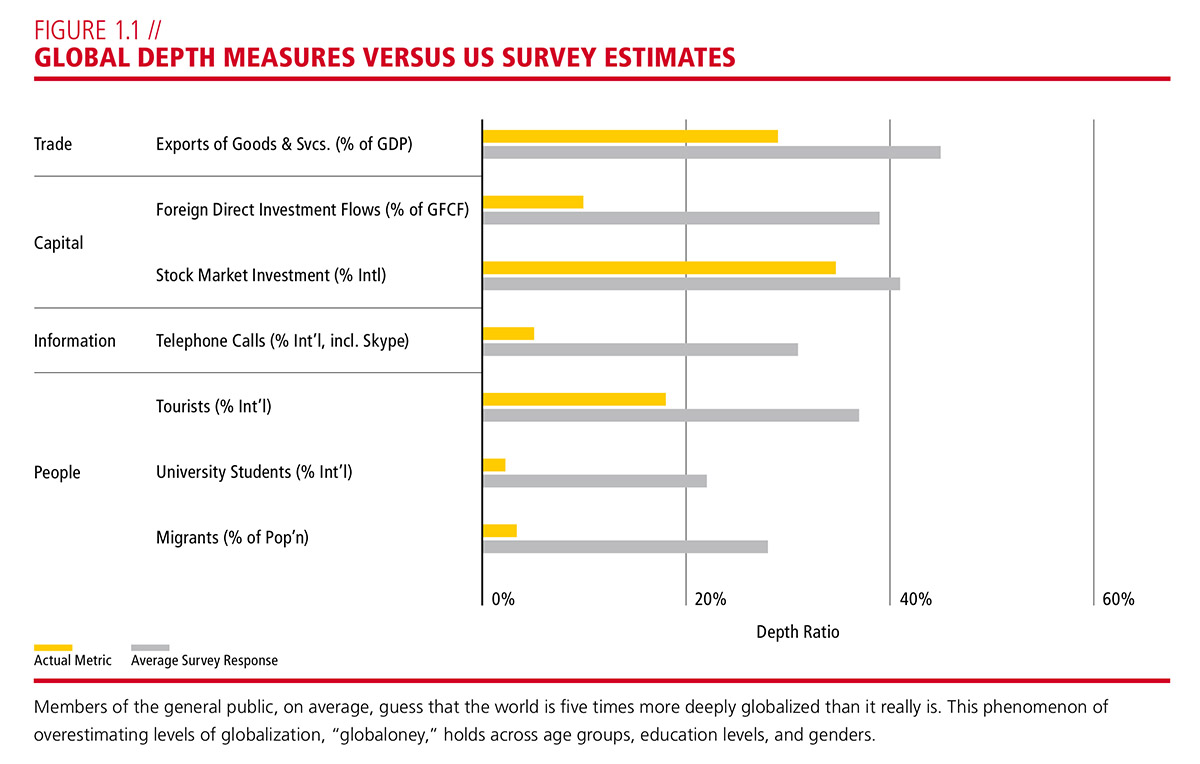
Survey data suggest that the phenomenon of globaloney extends to breadth—in this context via people underes- timating the extent to which distances and differences between countries constrain international flows. In a sur- vey of Harvard Business Review readers, 68% of respondents agreed with the quote from Thomas Friedman’s bestselling book The World is Flat that we have witnessed the creation of “a global, Web-enabled playing field that allows for… collaboration on research and work in real time, without regard to geography, distance, or in the near future, even language.”16
Actual international activity, however, still turns out to
be strongly dampened by distance. The average distance between two countries around the globe is roughly 8,500 km, but the flows covered on the breadth dimension of
the DHL Global Connectedness Index average a distance
of only 4,963 km. Figure 1.2 provides a somewhat more sophisticated take on the same pattern by comparing the distance traversed by specific types of flows to how far those flows would be expected to travel if distance and cross- country differences had ceased to matter.17 On average, this sample of flows went only 58% as far as they would in a “flat” world.